Statements often appear in the media about suggesting that more extreme mid-latitude storms will result from global warming. For instance, western Norway was recently battered by an unusually strong storm which triggered many such speculations. But scientific papers on how global warming may affect the mid-latitude storms give a more mixed picture. In a recent paper by Bengtsson & Hodges (2006), simulations with the ECHAM5 Global Climate Model (GCM) were analysed, but they found no increase in the number of mid-latitude storms world-wide. Another study by Leckebusch et al. (2006) showed that the projection of storm characteristics was model-dependent. (Note that the dynamics of tropical and mid-latitude (often called ‘extra-tropical’) storms involve different processes, and tropical storms have been discussed in previous posts here on RC: here, here, here, and here).
The factors that control this are often confounding and so make this a tricky prediction. Simple arguments based on the expected ‘polar amplification‘ and the fact that the surface temperature gradient between the tropics and the poles will likely decrease would reduce the scope for ‘baroclinic instability’ (the main generator of mid-latitudes storms). However, there are also increases in the upper troposphere/lower stratospheric gradients (due to the stratosphere cooling and the troposphere warming) and that has been shown to lead to increases in wind speeds at the surface. And finally, although latent heat release (from condensing water vapour) is not a fundamental driver of mid-latitude storms, it does play a role and that is likely to increase the intensity of the storms since there is generally more water vapour available in warmer world. It should also be clear that for any one locality, a shift in the storm tracks (associated with phenomena like the NAO or the sea ice edge) will often be more of an issue than the overall change in storm statistics.
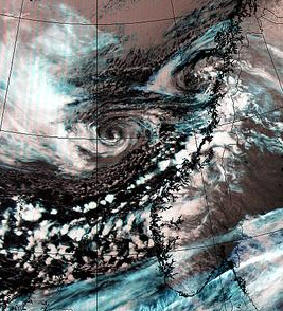 I believe that the jury is still out on the extra-tropical storm issue because the climate models are still limited in their ability to represent them adequately. For instance, wind speeds are not well captured by the models (Leckebusch et al., 2006), and modelled key characteristics of the cyclones were sensitive to the models’ spatial resolution: Work by Jung et al. (also published in Quart. J. R. Met. Soc. (2006), vol 132, p. 1839-1857) suggested that several key characteristics of extra-tropical cyclones in the global ECMWF numerical weather model are highly sensitive to the horizontal resolution. This is also acknowledged in a recent paper by Wernli & Schwierz (2006; J. Atm. Sci., vol 63, p. 2486). However, for some regions, Jung et al. noted that model problems were insensitive to the horizontal resolution employed in their model experiments. Ulbrich (EMS/ECAC06) also found a dependency of the storm statistics in re-analysis with different spatial resolution (the picture from GCMs was similar to the re-analysis, provided the re-analysis was carried out with similar spatial resolution). It was also concluded that the different models analysed gave a similar large-scale picture of how extra-tropical storms respond to a global warming: the frequency of weak storms decline and the strong storms are projected to become more frequent. The sensitivity to resolution is understandable, because while an entire storm system can be very well resolved (they can be 1000 miles across), there are very sharp features at the fronts (the comma shaped clouds) which are a challenge even for weather forecast models to get right. Secondary ‘cyclogenesis’ (where a new storm is ‘spun off’ from an existing storm) is also something that improves markedly as resolution increases.
One can try and address that by using a high-resolution regional climate model (RCM), forced by simulations from a coarser GCM at its boundaries (a process called ‘nesting’). The RCMs provide a similar description of the minimum sea level pressure (SLP – a parameter related to wind storms and the cyclone depth) as the GCMs, irrespective of their spatial resolution (The KNMI scenarios 06 Fig. 6-3). RCMs, however, are not completely free to do their own thing, but must follow the GCMs, at least on the larger scales. So should we really expect an RCM to produce a different storm climate? What implications would a substantially different cyclone climate in the RCM have for the larger-scales and the energy transport? Cyclones play an important role in the poleward energy in the mid-latitudes (‘eddy-transport’), which ultimately has a bearing for the large-scale circulation. Since cyclones involve significant parts of the hydrological cycle, such as evaporation, moisture transport, condensation and precipitation, a different cyclone climate in an RCM and GCM would presumably present inconsistencies for the water budget. Furthermore, a paper by Peng et al. (2006) suggests that eddy forcing may be responsble for large-scale response to changes in the sea surface temperatures. In other words, the cyclone climate affects the large-scale circulation, and a widely different behaviour in the RCM and the GCM would imply an inconsistency.
One robust result among most GCMs is a poleward shift in the position of the storm tracks (Bengtsson & Hodges , 2006; Yin ,2006). It is important to keep in mind that for the local communities concerned, it is changes in the position of the storm tracks that is most important, rather than the global number of storms. Another robust result is that the NAO in the models tends to shift more towards its positive phase (stronger westerly winds) as greenhouse gases rise, tending to increase winter storms coming ashore in Northern Europe, and decrease them around the Mediterranean (Miller et al, 2006).
A conceptual picture of processes affecting mid-latitude is: One, that latitudinal variations in the temperature and air flow give rise to ‘baroclinic instability’; Second, the humidity of the air also plays a role as the latter influences the energy budget. An analogy for the two can be a sloping surface: the former is the how steep the slope is and the latter the height of the drop. Sharp spatial temperature contrasts and horizontal wind shear favour an unstable growth of the storm system.
As we mentioned above, global warming generally implies a ‘polar amplification’ (stronger warming near the North Pole), and so the average poleward temperature gradient is expected to diminish, leading to less unstable conditions on average. On the other hand, a warmer Arctic may imply less sea-ice and a greater heat loss to space, which must be balanced by heat transport from the lower latitudes, a poleward heat transport which may involve the mid-latitude storms (ice insulates the ocean from the atmosphere and keeps the temperatures down). Increased temperatures also implies higher humidity, and thus a higher capacity for energy conversion through condensation – the energy fuel of convection. So it isn’t a simple picture and one should be wary of simple statements on the topic.
Since much of this article involves climate models, Gavin Schmidt’s short piece in January 2007 Physics Today, “The physics of climate modeling”,might be of interest to the non-modeler/non-expert. Any legal way to link to it?
[Response: Well spotted! I’ll put in a link as soon as it is available on both the Physics Today and GISS websites. I don’t yet have the pdf (though somewhat anachronistically I have a hundred reprints if anyone wants them). – gavin]
If the mass of air in a mobile polar anticyclone comes from the high alitudes of a polar cell, and the extra CO2 causes high altitude cooling, then the mass of the MPA might be greater, winds will be stronger and cooler in the winter. This might explain the Orange killing frosts in SE USA, or the lower latitude of certain US Midwest Koppen classification. Just guessing.
Thank Rasmus for this very interesting review of recent litterature. In the last paragraph, I don’t understand clearly : “a warmer Arctic may imply less sea-ice and a greater heat loss to space, which must be balanced by heat transport from the lower latitudes”. I thought models expect no more heat loss to space, because of nebulosity and water vapour retroactions from a warmer artic ocean (DLF forcing confirmed by Francis and Hunter recent paper in Eos).
[Response:I probably should have phrased this a bit differently, as there may be several processes involved: reduction in the sea-ice albedo, enhanced downward long-wave radiation (DLF; Francis & Hunter), and enhanced exposure of the sea surface in itself leading to enhanced heat loss. These importance of the different processes differ with the season, as the albedo feed-back won’t do much in the polar winter, but will be very important in the summer. Thus, I should have said that the heat transport from lower latitude, and the DLF, may play a more important role in winter. -rasmus]
Well, what a long description of how the models do not give the correct results. You admit that even the weather models are wrong, yet the success of them, and their similarity to climate models is used as proof that the climate models are reliable. When are you going to accept that Karl Popper is right. If there is one exception to a law then the law is untrue. If the model cannot replicate one feature then it is wrong, no matter how many it gets right. The scientific establishment is continually papering over the cracks in the models, from a cold upper troposphere and the tropical lapse rate problem to a failure to acieve energy balance closure http://nature.berkeley.edu/biometlab/espm228/Wilson%20et%20al%202002%20AgForMet.pdf
What is needed is a paradigm shift, but then old models never die, only the professors fade away :-(
[Response: That kind of simplisitic Popperism only works for idealised ‘clean’ situations where the issue is black or white, right or wrong. That just isn’t applicable to the real world where the issue is much more nuanced – how right? what is the tolerance for error? does a new feature reduce the error or not? Therefore models (in the generic sense) are supposed to increasingly match observations as they get closer to the underlying ‘truth’. This is what happens – GCMs are better at storms than energy balance models, weather models are better yet. None are perfect. This is how it works in the real world – get used to it! (PS. the paper you link is about inconsistencies in data, not GCM models, so I’m not quite sure of your point.) – gavin]
Alastair,
All models are wrong, but some are useful.
Dr. Benestad;
My thanks for this posting, your ideas expressed here, represent the clearest understanding of the mechanics of the climate and weather phenomena that I share to date. The primary concern I have is there continues to be references to the NAO other large scale patterns without a definition of what drives these patterns. Is there any current work that you know of that is focused on defining the drivers for the large scale patterns?
If I understand your implications correctly, regarding the horizontal resolution, it appears to be in relation to the RCM interactions. If this is true and the combination of certain RCMs equates to a major GCM character it would certainly help in understanding the large pattern drivers. The question is how do you define or describe the RCM characteristics? Would it simply be the combination of barometric zones at latitude and mix that define the character of the pattern, or would it be a combination of humidity gradient, temperature gradient and barometric charcteristics at latitude or are there other characteristics or categories that need to be added and/or defined?
Certainly with the variability seen over the last 30 years in which we have detailed evidence there should be characteristics emerging that seem to signal large scale patterns or combinations of RCMs that together define a large scale GCM pattern. I wish to offer my humble congratulations, I don’t mean to be insulting; however, this is the first time I have seen on realclimate.org what I believe to be a description of climate phenomena that makes sense.
Dave Cooke
#4
What is a “correct result” for scientific models ? In a complex thermodynamic system, you cannot expect a purely deterministic simulation as you suggest (one law > one phenomenon or one cause > one effect). I think meteo. or climato. models do progress on some features, less or no on others. A future problem may be the intrinsic limit of this progress, as models will become more and more complex (coupled with biogeochemistry models for example).
Well, I’m blown away by how much is known about extra-tropical storms and their relation to global warming, and all the modelling abilities, despite all the complexities and uncertainties (and me not understanding the whole of this article).
The models are improving, just as computer sophistication is improving. At a recent party we were talking about the pre-internet early 70s, key-punch cards, and how we had to write our own programs — to the amazement of the younger set present.
So when will there be a model that includes positive feedbacks, such a methane from melting clathrates and permafrost, & reduced albedo causing further warming, causing further methane releases and reduced albedo, and so on? Or are these already included in the current models.
I remember our computer prof very strictly warming us against writing an infinite “do-loop” and jamming the Berkeley CDS computer — that big monster brain at the center of the campus, I think nearly the largest one in the world at the time.
As a non-climatologist I’m fascinated by the incredible rate of progress in the development of climate models, and by how incredibly good they already are at simulating such a complex system.
However, I have not been able to find a good lay-person friendly summary of the state of the science including summaries of each model, their strengths and weaknesses, the processes modelled by each, and plans and time-frames for enhancements. Does such a resource exist?
I’m bemused by the wingers carping from the sidelines that because no model is perfect they are all useless. However, I can understand why someone with little understanding of what a computer model is would conclude from this article that they are all rather dodgy, rather than – as I interpret – very good already, but with many refinements in the process of being developed, tested and implemented.
Here’s the URL of a New York Times story about the Ayles Ice Shelf, which is now no longer a shelf but an “ice island” adrift in the Arctic Ocean.
http://www.nytimes.com/aponline/world/AP-Canada-Arctic-Ice-Break.html?hp&ex=1167454800&en=f89634f40f628a0d&ei=5094&partner=homepage
#4: It appears that this old post of mine about the residuals problem is an everygreen:
“Anyone who has come up hard and fast against reality understands that there is neither a theory or a model that explains everything. There are always residuals, unexplained anomolies and people on the fringes who will hold onto those for dear life, weaving webs of conspiracy theories that focus only on what remains unexplained.”
Thanks for an interesting summary.
Storms are spectacular and therefore very much discussed. In my opinion, fair weather should also get some attention, particularly when it is due to the “blocking high” type systems. Dynamics determine storm power, the highs determine largely where they hit. As a lay person I see it as a pinball game – with a tiltable board.
The storm tracks also impact local and regional climate. For instance in Europe an expansion of retraction by a few hundred kilometers of the frequent “permanent” high pressure over Central Russia determines if we have a cold northerly or a warm southerly flow. A “blocking high” may remain stationary for weeks at a time. Climate warming may impact these highs in ways that translate into regional climate shifts.
Re #4:
By your standard the current model of gravity is “wrong” because there is no solution to the “three body problem”. Yet we can use our model of gravity to propel the voyager spaceships billion of miles on a pinball tour of the solar system, fire the Cassini spaceship through the gaps in the rings of Saturn (twice), or hit a fast moving comet with mind bogling accuracy.
You are however on the right track with Popper. His notion was basically that theories can only be refuted, never proven. The notion is now a well accepted part of the philosophy of science. I have no idea what he said about the “usefullness” of theories that wait for decades or centuries to be refuted, but I doubt he advocated ignoring them.
[[I don’t yet have the pdf (though somewhat anachronistically I have a hundred reprints if anyone wants them). – gavin]]
I would love to have a reprint. May I email you my mailing address?
All — my climatology page has been debugged and now links correctly to four short articles on climate subjects (well, three short articles and one javascript planetary temperature calculator). Here’s a link to it:
http://members.aol.com/bpl1960/Climatology.html
Re #13 It is not true that there is no solution to the three body problem, otherwise it would not be possible to navigate a spaceship. There is no analytical solution to the three body problem. Nor is there an analytical solution to climate modelling. Iteration is used in both space navigation and climate modelling. That is why computers are so neccessary.
But if the computations for the trajectory of spaceships varied from 1.5 to 4.5, would they really have sent a man to the moon? Yet the change in temperature predicted for a doubling of CO2 range from 1.5K to 4.5K and have remained in that band for over ten years.
Of course you are told by Gavin et al. where the models succeed, but you have to read between the lines to see where they are going wrong. That is where Rasmus’ post is so revealing. It is quite clear that the models do not have an answer to the Mid Latitude storm question. In fact Rasmus has not explained what it is.
Heat is transported to the poles at a rate proporional to the temperature difference. It the poles warm then there will be less heat moving polewards. How is it then that the poles will be warmer? We know from paleoclimate studies that polar amplification does happen, and that in the Eocene there were cold blooded crocodiles in Greenland. But the current climate models cannot explain that.
Re “If there is one exception to a law then the law is untrue.”
Helium balloons and rockets fall upward. Does that mean Newton’s law of gravitation is untrue?
Re #16 Barton,
helium balloons do not fall upwards they float upwards. In order to use Newton’s Laws you have to consider all the forces, in this case graviation and bouyancy.
But as was pointed out to Eli on his blog, when Newton’s Laws did fail, predicting the perihelion precession of Mercury, then it required the paradigm shift of Einstein’s General Relativity to get to the real answer.
Correct me if I’m wrong – but if the stratosphere is cooling then the temperature gradient through the troposphere is increasing with consequent effects on such things as the non-adiabitic processes driving storms. For the same base level of temperature and humidity storm clouds will grow taller (limited by the actual tropopause of course) because the rising air will be unstable for longer.
In other words couldn’t the increase in wind speeds on the surface be at least in part due to increased vertical speeds within storms.
I have one wish – that someone will post a working film of Fulz’s Dishpan experiment – this simple experiment is a standard laboratory for undergraduate meteorologists and it explains a lot of things. Am I alone in this longing…
The ITCZ over the Indian Ocean is a thing to behold at the moment!
No, but we needed further research to know why it went up rather than down
Re:15 “Heat is transported to the poles at a rate proporional to the temperature difference. It the poles warm then there will be less heat moving polewards. How is it then that the poles will be warmer?”
Apart from being a chicken and egg question (“If the poles warm how will they be warmer?) this is surely easily answered by the fact that the equatorial regions warm too. As long as there is a difference in the temperatures there will be circulation. N’est ce pas?
re #4 et al: remember the old unwritten law of science: One exception is the “exception that proves the rule.” I guess one needs two exceptions to disprove the rule.
The difficulty with models is that the deficiencies and gradiations are well and truthfully recognized (other than the unk-unks, of course) in their development stage, but get lost or buried in the operational stage, particularly, if resurrected, they likely would alter the hoped-for answers.
Is all this a backtrack from the all-the-rage assertions in 2005 of GW causing more and stronger (mid-latitude) hurricanes because we didn’t get ANY in 2006? Or am I just be too sensitive and paranoid? It is after all an astute post.
re #4 and #15:
Climate science must sure be the only field where people feel they are seriously critiquing it by saying, “It doesn’t explain everything yet.” Do people say modern physiology is a flawed field, because we don’t yet understand how the brain works?
“…. doesn’t explain everything” is a ‘criticism’ only possible from people whose own belief system does explain everything.
In a narrowing range. The shape of the curve matters. And since you think that orbital trajectories are so cut and dry, would you care to tell me where the asteroid http://en.wikipedia.org/wiki/99942_Apophis 99942 Apophis will be on the morning of April 13, 2036? It seems that the smart guys at NASA are having a little trouble deciding whether or not it is going to hit the Earth that day….
Dan, any field that is especially politically charged suffers from a similar problem. As I work in the British Pleistocene (not literally of course), I don’t suffer from this!
RE: 15 & 20
Hey Mr. McDonald and Ms. Sally;
If you go further with this thought it would be useful.
If the heating at the ITCZ were to stabilize, so that the temperature imbalance between the Equator and the Poles reestablishes itself, what would happen to the current heat that has been transported to the Poles? (Depending on the temperatures in the Tropopause region, the combination of heat and water vapor could even reach the Stratosphere, where it would eventually distribute and provide the surface for the CL reduction of O3 and would delay the recovery of O3 in this region until HCl were to achieve solution and precipitate out.)
What if the heat at the ITCZ was constant would there not develop a fixed path of heat transport from the ITCZ to the Poles not unlike the THC in the ocean. Would this not be phenomena like a Jet Stream traveling at an angle from the ITCZ to the Pole and back again? (We have evidence of a dramatic South to North transport in the last year if you look at the Walker circulation and the deviation of the NH Jet Stream. (Add in the studies this past summer regarding the observation of the Hydrocycle transport moving north from the 20-25 Degree N region to the 30-35 Deg. N region.)
If this heat transport character were to become static would it not form a new pattern in the earths weather? Though there was evidence of this recently, it appears that currently the Jet Stream is stabilizing into its normal elliptical pattern. Does this mean that the heat transported to the Arctic is locked in and the latitude heat imbalance is reduced?
What is going to happen to all that heat that was transported to the Poles, will it stay there? Will this heat distribute through out the Arctic sea or is it more likely to convect upwards and radiate out of the water and into the upper atmosphere or space? So if the heat transport were to lessen, is it possible we will quickly see the Arctic Sea Ice return and the cycle begin all over again? What if the heat transport were to not lessen; but, become constant? So many questions and so little time…
Dave Cooke
Re #4, #15, etc: You might reflect on the fact that it’s impossible* to build an absolutely accurate model of any real-world process. Any model has to be a simplified approximation. For instance, we can model the Earth as a flat plate. That’s wrong, but it’s perfectly adequate for walking around the neighborhood. Or we can model it as a sphere, which is also wrong, but lets us usefully navigate on long ocean & airplane voyages. Or we can use a slightly oblate spheroid, which tells us where our GPS satellites and such will be – but it still doesn’t take into account e.g. me digging a hole to plant an apple tree, or the piles of worm castings that I find on warm, wet mornings.
By the same reasoning, climate models can never be completely correct, because there are always finer and finer levels of detail to consider, but they seem to do a pretty good job of pre- and post-diction. What other course would you have us take? Ignore tha bomb because we don’t know for sure whether it contains 1.5 pounds of explosive, or 4.5?
*because of quantum, to quote Terry Pratchett :-)
Sally, the idea of polar amplification is that the poles warm more than the equatorial regions, so the problem is not solved by tropical warming.
Dan, the point I am trying to make is not that the models don not explain everything. It is that the current models give the wrong results, but the scientists are blaming the data. When the satellites and weather baloons said that the the upper troposphere was not warming they blamed the satellite data. When they found a fix for that data then said that the balloon data must be wrong too by the same amount! In other words they have changed the data to fit the model. Now there is a problem with the energy balance closure, as Gavin pointed out, they are blaming the data again.
Coby, you wrote “All models are wrong, but some are useful.” However, some models are not only wrong, using them is dangerous. Global warming is happening much faster then the models predicted, and the glaciers and ice sheets are disappearing much sooner than the models showed. The life of the Arctic sea ice has been halved from 80 to 40 years, but could be much shorter than that.
Carbon dioxide levels control the surface temperatures, not those at the tropopause. The CO2 level sets the amount of land and sea ice and so the planetary albedo. The only way the loss of albedo from melting ice can be replaced is with more clouds. Increasing surface temperture does not neccessarily lead to more cloud so we are approaching a dangerous crisis.
Max Planck wrote “A new scientific truth does not triumph by convincing opponents and making them see the light, but rather because its opponents eventually die, and a new generation grows up that is familiar with it.” ~Max Planck, A Scientific Autobiography and Other Papers, 1949
So I am not going to convince Gavin et al. that they are wrong. However, we do not have enough time for a new generation to grow up before disaster stikes. As Sergeant Frazer put it “We are doomed.”
Hi Rasmus
thanks for the overview. There is one thing I’ve thought about for a long time but never found anything on that. Strong cyclones and high wind speed mainly occur in a zonal flow pattern. A meridional flow pattern with cut-off systems shows much less strong cyclones and wind speed. A zonal flow pattern is much less effective in energy transport from North to South than meridional flow patterns. A less strong temperature gradient from North to South could lead to generally more zonal flow patterns (because the energy transport to compensate the North-South gradient would be less), which would mean more strong cyclones and wind speed. Could this be a considerable effect? What do you think?
My subjective observation for Europe is that there is already some trend to more zonal flow, above all in winter. However I have not found a good objective method to verify.
If you put more energy into a system then you get more out. This will be more frequent or violent storms, but where probably depends on that butterfly in asia. To argue against this theory 2006 was the hottest year since records began but the quietest for hurricanes for some time.
I am sure that at the moment there are more questions than answers with global warming.
RE # 30
Keep your powder dry, John.
A forming El Nino in the tropical Pacific and observed large concentrations of dust blowing west off the Sahel might have had something to do with affecting the tropical systems in east and central Atlantic by knocking their high clouds into disarray. However, lots of action in the tropical Pacific and certainly the Philippines suffered numerous direct typhoon hits since June.
Stay tuned. More analysis is on the way.
It’s got to be questionable whether you can conclude more violent storms just because more energy in equals more energy out.
Im no expert on climate but as far as I see the basic case for stronger storms caused by global warming is simple. Weather people on tv reguarly point out that a certain storm is being strengthened by warm weather. For example sea surface temperature in the gulf of mexico is mentioned in hurricane forcasts for a reason.
Because in a warmer world we can expect sea surface or air temperatures in many regions to be high more often, therefore we should surely expect storms passing through warmer regions to be stronger on average than they would have been.
There are other factors influencing storm strength that sometimes make the warmth factor less important, but all that matters is that sometimes storms are in a position where a bit of extra warmth will make them stronger. In those cases at least some storms will be stronger in a warmer world.
RE #15 – “It is not true that there is no solution to the three body problem”
I was replying to #4’s narrow interpretation of Karl Popper. Iteration is an aproxomation, that’s why spaceships have “retro rockets” and the weatherman is sometimes wrong. The bigger the number cruncher the closer we get to the “truth” (or the shorter the time to find “truthiness”).
What we have with computerised “brute force” iteration is a practical but far from perfect solution for climate prediction. We may never find a solution to the maths but the success of spacecraft vivdly demonstrates we can do without it.
Disclaimer: I am a computer scientist and have worked on “brute force” LP solutions for logistical problems.
I’d like a copy of Gavin’s short paper.
c/o Jalama General Store, 9991 Jalama Road, Lompoc, CA 93436
Thanks in advance.
Hadley cells do not circulate straight from the equator to the Pole, as Polar amplification seems to be very strong recently there has been a pan Arctic shift in surface winds, implying different Hadley Cell configurations. The Arctic in some cases was warmer than the continents further South during this and last winter. This has caused unusual weather events, if colder air forms closer to the equator, then there can be an increase in wind speeds also especially in rain intensity in some locations.
Being a huge fan of models, I must disagree that they have to be rejected, they do incredible simulations, however they lack resolution, just like the data they use as input, lacks resolution. The world radiosonde network is way too sparse. MSU has proved to disappoint. Newer with older techniques (monitored at stations closer to each other) have to be devised to increase high res data input, with greater resolution and computing power, models will become even more impressive. I wonder if Polar Amplification as predicted to happen 20 years from now, which is largely happening at present, if the reasons for this phenomena are understood?
re: 28. “It is that the current models give the wrong results, but the scientists are blaming the data.”
Current models give the wrong results?? Peer-reviewed reference, please?
“When the satellites and weather baloons said that the the upper troposphere was not warming they blamed the satellite data. When they found a fix for that data then said that the balloon data must be wrong too by the same amount! In other words they have changed the data to fit the model.”
Again, peer-review reference? That is simply disingenuous and insulting to scientists everywhere. If fundamental data are wrong, correcting the data is not a “fix”. It is called quality assurance. That is a fundamental data collection process in science. Otherwise you have completely junk science.
#28
Alastair : “However, some models are not only wrong, using them is dangerous. Global warming is happening much faster then the models predicted, and the glaciers and ice sheets are disappearing much sooner than the models showed. The life of the Arctic sea ice has been halved from 80 to 40 years, but could be much shorter than that.”
Hum, not all models agree with your view… of models ! For example, in GRL december : neither Winton 2006 nor Holland et al. 2006 conclude summer Arctic sea ice will certainly disappear from 40 yrs (just one projection for seven in Holland paper). And for Greenland ice sheets, we should be more cautious with recent GRACE measures (before any dispute on models quality): a recent instrument (PGR and other calibration uncertainties), a short period (2002-2006), a well-known strong regional variability (NAO+/-) and a 2.5 factor for different estimates of mass balance published since March.
The equator may warm less than the poles, but it’s a whole lot bigger, eh?
I’d think the heat energy added to moderately warm say ten degrees of latitude around the equator is still going to be more than is added to warm up the smaller, albeit somewhat warmer, ten degrees of latitude around each pole.
Re #4
It is not clear to me what computer models have to do with scientific “laws” (besides, there is no commonly accepted definition of a scientific “law” – the term is used very differently, and inconsistently, by physicists, chemists and biologists, e.g., Dalton’s Law of Partial Pressures is very different from Mendel’s Law of Segregation).
Re #22 and #23
Evolutionary biology faces the same kind of scrutiny, from people whose believe system purports to explain everything (without, in fact, explaining anything).
Re #27
“Models are metaphorical (albeit sometimes accurate) descriptions of nature, and there can never be a “correct” model. There may be a “best” model, which is more consistent with the data than any of its competitors….if our models are as complicated as nature itself, then we may as well not bother with the model and focus only on the natural situation. Simpler models often provide insight that is more valuable and influential in guiding thought than accurate numerical fits.” Excerpts from: The Ecological Detective: Confronting Models With Data, by Ray Hilborn and Marc Mangel. Models in Population Biology, #28 (S.A. Levin and H.S. Horn, eds), Princeton University Press, 1997.
Re #15 and #28, Alisdair McDonald wrote:
“Heat is transported to the poles at a rate proporional to the temperature difference. It the poles warm then there will be less heat moving polewards. How is it then that the poles will be warmer? We know from paleoclimate studies that polar amplification does happen, and that in the Eocene there were cold blooded crocodiles in Greenland. But the current climate models cannot explain that.”
and later wrote:
“Sally, the idea of polar amplification is that the poles warm more than the equatorial regions, so the problem is not solved by tropical warming.”
and later wrote:
“So I am not going to convince Gavin et al. that they are wrong.”
Well. not exactly. The idea of polar amplification is that the contribution of greenhouse gases to atmospheric warming is greater in polar regions than at lower latitudes, because the polar atmosphere is so dry. This is a prediction that has been around for more than a hundred years, since Arrhenius’ original paper, is a prediction of most climate models, and is rather nicely confirmed by observations during the last three decades.
The energy balance in the tropics is currently not quite a zero sum game, with the energy in from the sun being slightly greater than the energy out (from the top of the atmosphere and by poleward movement of air and water vapor). That means that the pesky left-hand side of the heat transfer equation, the partial derivative of temperature with respect to time, will be positive and temperature in the tropics will be increasing. This temperature change tends to re-establish thermal equilibrium in the tropics and tends to re-establish the previous temperature difference between the tropics and the polar regions.
The net effect is a negative feedback that, with a delay, tends to re-establish/maintain the previous balances of energy input (high in the tropics and low in polar regions) and energy rejection to outer space (low in the tropics and high in the extra-tropics).
Actually, Alisdair seems to be the one who cannot be convinced that he is wrong.
Best regards.
Jim Dukelow
Re #29 I agree with your reasoning Urs, but the other possibility is that as zonal flow increases, areas away from convergence zones would have less windy conditions. Imagine a global belt of high pressure at 30 – 35 degrees say.
I think that zonal and meridional flow actually appear out of the dynamics of the system as poles within which it oscillates. My imaginary hyper-zonal system would be inherently unstable and would be broken up by the formation of cyclones. This is what appears to have been happening over the Indian Ocean in the last week with the ITCZ.
I’m not necessarily implying that zonal and meridional are the only dynamic poles. I don’t think it’s reducible to 2 dimensions. But it seems reasonable to suggest that they are dynamically unstable points.
One way to think about this is that below a certain combination of angular momentum and temperature difference – the system will become non-turbulent and completely zonal. But I think that we are nowhere near that minimum, yet. We’d have to freeze or boil all the water for a start!
I’d reiterate my point about Fulzs dish pan experiment.
I think there is a linguistic problem with phrases like ‘more windy’, ‘stronger storms’ , ‘wetter’ or ‘drier’. The problem is that meaning and usage are often confused(cf. Wittgenstein). Sometimes these prhases are used with an implicit particularity, ‘here’ or ‘always’ and other times with an implicit multiplicity, ‘on average’ , ‘more often than’.
It seems there is a problem with using yearly averages to predict the behavior of mid-latitude storms. There will certainly be a strong seasonality, won’t there? It seems that a likely scenario for the mid-latitude regions is violent flooding in early spring followed by long summer droughts due to reduced snowpack. Mid-latitude Atlantic weather can also be stongly influenced by the remnants of hurricanes making their way northwards (as was the case for ‘the Perfect Storm’). Most of the major storm ‘events’ that make the news headlines don’t actually seem to be isolated events. If Katrina hadn’t encountered a tounge of warm deep water as she entered the Gulf of Mexico, she wouldn’t have amplified the way she did – so that should be viewed as two intersecting events. To be simplistic, if more energy is stored in a climate/weather system, the frequency of energetic events should increase, as well as the chances that multiple events will happen to coincide.
Thanks for the discussion of ‘nesting’ local storm models into large-scale GCMs. Is there any possibility that GCMs will ever be able to increase their grid resolution to the point where such procedures are unnecessary?
As far as the positivist Popperian philosophy of science goes, here’s the relevant quote:
“According to this way of thinking, a scientific theory is a mathematical model that describes and codifies the observations we make. A good theory will describe a large range of phenomena on the basis of a few simple postulates and will make definitive predictions that can be tested. If the predictions agree with the observations, the theory survives that test, though it can never be proved to be correct. On the other hand, if the observations disagree with the predictions, one has to discard or modify the theory. (At least, that is what is supposed to happen. In practice, people often question the accuracy of the observations and the reliability and moral character of those making the observations)” – Stephen Hawking, The Universe in a Nutshell, pg 31.
The prediction that warming would be most evident in polar and high-altitude regions is a test that climate models have survived. The aerosol issue, on the other hand, required modification of climate models to be accounted for, and the combination of clouds + aerosols is still uncertain, apparently. An important thing here is getting the most comprehensive and accurate set of observations possible, so that model predictions can be tested – which is why funding is so important. For example, models of ice sheet dynamics were apparently very wrong when it came to the behavior of the Greenland and West Antarctic ice sheets – something that field and satellite observations revealed. Unlike what some of the above comments say, it’s okay to modify a theory, but one must then also generate a new set of testable predictions with the modified theory. Under ideal circumstances there is an open flow of information between observation and theory.
Climate science denialists have certainly fit the model described by Hawking as well (see the final bit in that quote)! The fact that the denialists so seldom call for more comprehensive observational data (i.e. more funding for satellites and cruises, for example) is rather telling. Without these datasets (ocean temp profiles, ice sheet volumes and movements, etc.) there is no way to test the models.
Re “Is all this a backtrack from the all-the-rage assertions in 2005 of GW causing more and stronger (mid-latitude) hurricanes because we didn’t get ANY in 2006?”
The US didn’t get stronger than usual hurricanes. Asia did. The US is not the whole world.
Re “Sally, the idea of polar amplification is that the poles warm more than the equatorial regions, so the problem is not solved by tropical warming.”
You have the poles warming more than the equator confused with the poles being at a higher temperature than the equator. The poles can experience more warming and still be colder than the equator.
Fultz’s dishpan:
http://magazine.uchicago.edu/0508/chicagojournal/stand.shtml
http://www-news.uchicago.edu/releases/05/050601.fultzlab.shtml
Fultz’s drink server:
http://geosci.uchicago.edu/~nnn/LAB/OPEN/
Happy new year!
http://cimss.ssec.wisc.edu/tropic/real-time/marti/2006_ONE-C/webManager/displayGifsBy12hr_06.html
Watch that and tell my why there is no discussion at all about the weather manipulation and how it may be having some affect on your problematic models. It’s all junk science until you wise up and factor in these crucial scenarios.
Re #44
Barton, I am not explaining the problem very well, so I will try again.
According to the current paradigm, if the earth’s surface warms then the outgoing radiation will increase providing a negative feedback on the temperature rise. See Jim Dukelow’s comment #40. Thus, if the polar regions warm then more heat needs to be transported there to compensate for the increased heat loss. But if the poles warm more than the tropics, then the temperature difference decreases which is the mechanism that causes the heat transport.
The answer is that there is no negative feedback from the long wave radiation. Here I accept the point made by James in #27 and Gavin that earth science is fractal. A more detailed examination would probably show a minor effect.
The reason that the problem of mid latitude storms cannot be solved is not “because there are always finer and finer levels of detail to consider” but because the wrong model is being used. The current model is equivalent to a cubic earth. Just as with a spherical earth, it is correct for a first approximation of being flat. However, if you stand on a cliff and look out to sea then you can see the world is curved, but it can always be argued that it is because the binoculars have a fixed range, hence it only seems that the world is curved. This is what the scientists are doing with their satellites, radiosondes, and infrared gas analysers – blaming the instruments rather than accepting the facts.
RE #47,
I think you are oversimplifying the mechanism of heat transport to the poles, as well as ignoring the seasonality involved (the long dark Arctic winter). There are atmospheric routes which involve evaporation of water from warm sea surfaces and rising warm air over equatorial landmasses; this is the Hadley Cell circulation. There are also oceanic routes involving western boundary currents like the Gulf Stream in the Atlantic and the Kuroshio Current in the Pacific; these are physical phenomenon that arise due to the Coriolis force. It doesn’t seem to be like a block of metal where one end is kept hot and one is cool.
The most important thing is to monitor those atmospheric and oceanic routes to see what the heat transport is really doing – that means using bottom-moored sensors that provide a constant stream of data (twice-a-year cruises just don’t cut it), as well as the standard methods of looking at the atmosphere. A moister atmosphere can also store more energy due to the heat capacity of water. The arctic winter should continue to produce cold, dry air masses, and when these air masses run into huge warm moist air masses – there you have a violent storm. The steeper the gradients, the more intense the winds, and so on. During the Arctic summer, the reduced ice cover will result in lower albedo, but are you really claiming that the polar heat transport will result in warm Arctic winters? That seems highly unlikely due to the decrease in solar insolation in the winter.
What would it mean to ‘solve the problem of mid-latitude storms’?
I’d be more worried about the seasonal effects of the warming on the Arctic permafrost and shallow continental shelves around the Arctic, as well as the fact that warming water with less deep water formation means less dissolved oxygen in the northern oceans, and that could lead to plummeting biological productivity at the upper ends of the food web. Modelling biological responses to climate change (including human responses) is important but is also very, very iffy – which is why the most important thing is not to attack ‘the scientists’ but rather to promote accurate and comprehensive data collection all over the globe!
Note also that the Antarctic and Arctic ozone holes are also seasonal effects; chlorine adsorbed to ice particles is released when the sun hits in the spring. Seasonality can’t be ignored at the poles.
All models, as some here have indicated, must limit variables.
I’ve read that when the Soviet Union collapsed there was a decrease in atmospheric CO2 loading because greenhouse gas-producing industry in that country also collapsed.
There are, of course, wild cards which have nothing to do with the physical processes of the Earth’s climate. War, famine, plague and political change do not exhaust the possibilties.
I’m rather interested in this. It’s my understanding that the polar amplification is due to
1. ice albedo feedback
2. negative feedback via evaporation in the tropics (much stronger at higher temperatures.
2 counteracts a strong water vapor greenhouse feedback, but all that extra evaporation is balanced by extra condensation somewhere, and this is why the mid to upper troposphere is expected to be a region of enhanced warming as well.
Now as pointed out, the ice albedo would have little effect in winter. But in summer, there would be increased absorption of heat in the open water. This is released in winter as the water cools and ‘tries’ to freeze. This takes a longer time, so there is less time for the air to cool past the freezing point (right?). In summer itself, the warming is not expressed so much as a temperature change. So actually, in temperature, the polar amplification is really expected to be more in winter.
There is also the reduced lapse rate in the polar troposphere. This should make the greenhouse effect on the troposphere+surface as a whole weeker, as the effective emitting temperature to space is not so much lower than that at the surface; the increase in the greenhouse effect should be weeker as well for that reason (right? – I’m trying to reason this out). In terms of W/m2, the change in radiative forcing might also be less just because there is less radiation being emitted by the surface or troposphere (as it is colder), so there is less radiation to absorb. Then there is the lack of water vapor, which means the increase in CO2 could have a larger impact than otherwise. Lack of high clouds would have the same effect. At http://www.grida.no/climate/ipcc_tar/wg1/253.htm, for the increase in well-mixed greenhouse gasses, it appears that the maximum forcing (at the tropopause, I assume) is in the subtropics (which makes sense – few high clouds, dry, warm), and the lowest is at the poles, particularly Antarctica.
It also occurs to me, though, that the low lapse rate at the high latitudes would tend to allow for greater surface warming relative to the troposphere as a whole, as convection is less likely to redistribute the warming upward.
So lower meridional temperature gradient near the surface, but higher meridional temperature gradient in the mid-to-upper troposphere – that’s my understanding. This would tend to weaken the vertical wind shear in the lower troposphere but strengthen it in the upper troposphere. I’m curious how that would affect midlatitude dynamics.
It occurs to me that the typical oceanic gyres generate east-west temperature variation from the north-south temperature variation, so unless the gyres speed up, I would guess the east-west variations would be reduced in response to a weaker meridional gradient near the surface. I would imagine that this would add to weakenning of the horizontal thermal gradients on the east coasts of North America and Asia, so I’m imagining especially reduced cyclogenisis in these areas. Am I on the right track?
I didn’t think that the greater heat loss from the polar regions due to their warming requires greater heat transport to the poles, because the higher temperature changes at the poles are being produced by greater heating at the poles (well, at the surface of the poles). Or is that the issue – that the heating is concentrated near the surface, and somehow the change over the whole depth of the atmosphere responds to surface heating with net heat loss?
From a textbook
(“Global Physical Climatology”, Hartmann, 1994) there is a simple scaling argument that suggests sensible heat transport by midlatitude eddies is proportional to
the square of the meridional temperature gradient
* the square root of d(potential temperature)/dz
* the square of the depth scale / square of coriolis parameter
* the 3/2 power of (g / potential temperature)
the reason for being proportional to the square of the meridional temperature gradient is that a given motion has net sensible heat transport proportional to the temperature gradient, but the eddie motion itself is proportional to the vertical wind shear, which is proportional to the temperature gradient.
The depth scale is proportional to the height of the tropopause for more unstable flow, but proportional to the meridional temperature gradient for more weekly ustable flow (leading to even greater response to the meridional temperature gradient). Is that why the smaller storms would be fewer while the larger storms might increase (as the the height of the tropopause may rise)?
It’s also my understanding that were it not for the instability that leads to eddies, the Hadley cell could extend from equator to pole, and in the dishpan experiments and in computer models, if I recall correctly, this happens until the meridional temperature gradient causes the circulation to break down. I’m curious – in order to balance to Angular momentum budget, a worldwide pair of Hadley cells would have to have both westerlies and easterlies; the winds would start out westerly near the poles, and then bend around as they head equatorward. I’m curious what’s expected to happen to the surface winds as the midlatitude storms weaken, increase, and move, and if that requires any shifting in the easterlies of the tropics?
One interesting thought I had is to compare simple models of idealized ciculations of various kinds and time dependent situations with the time average one-dimensional radiative convective model – ie to get some general understanding of how do variances in time and space, and their synchronicity (ie certain kinds of clouds occuring along with certain temperature variations at certain times of day, etc.), affect the temperature relative to a model in which everything is averaged out before calculating?
I apologize if this is all neatly laid out in one of the links – I haven’t had time to check them out yet.