Recently, I received multiple requests to discuss a paper, due to appear in Journal of Geophysical Research (JGR-atmosphere), that has been presented in the media just before the Bali conference and the Nobel Peace prize ceremony here in Oslo, Norway. The paper concludes that the warming measured over land is most likely exaggerated due to non-climatic effects, and it presents a regression analysis suggesting that the real (climatic) global mean temperature trend should be ~50% lower over land.
So, are the surface temperature trends inflated? This new paper by McKitrick & Michaels (henceforth ‘M&M2007‘) is a followup of an earlier paper they wrote in 2004 in Climate Research (MM2004a), which I discussed in my first RC post (Are Temperature Trends Affected by Economic Activity?) and in a commentary in Climate Research (Benestad, 2004).
So what’s new? Let’s backtrack a little and recount some of the previous arguments.
One of my main concerns then was that their analysis had not taken into consideration the dependency between the data points, as the temperature exhibits non-negligible spatial correlations. Furthermore, data from the same country were compared with the same national value in terms of economic indices. It was a bit like doing a poll by asking 10 people the same question 100 times and then claiming that it’s a survey with a sample size of 1000.
In 2004, M&M2004b said they were unaware of any paper in the refereed applied climatology literature that had performed a test where half the data was excluded when doing the model calibration and the rest was left for model validation. I guess that they were not really up-to-date then, because that has been a standard approach for a long time.
But this time they have split the data sample and used a part for validation, which I suggested in my comment in Climate Research. But they have not done it properly this time, and they still do not eliminate the effect of dependency. They split the data by randomly picking points which were either used for training the data or validating the model, thus data from adjacent sites which are related will end up in the different batches for training or validation.
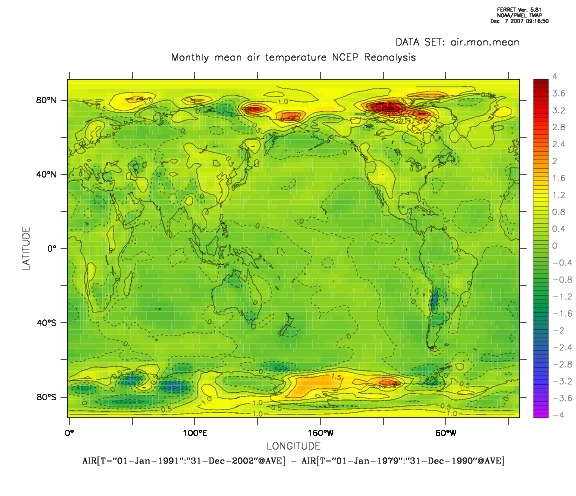
The map above shows a simple estimate of the temperature change over the 1979-2002 period (here taken as the differences in the mean over two sub-periods and the National Centers for Environmental Prediction (NCEP) re-analysis have been used instead of the CRU data), and it’s easy to see that the warming varies smoothly from location to location. In other words, the trend estimates have significant spatial correlation.
The fact that they used sea-level pressure (SLP) data from (1974) because they could not find more recent data, suggest that they still are not up-to-date. Updated data, such as the National Center for Environmental Prediction SLP, have long been available from NOAA Climate Diagnostics Center. Furthermore, a wealth of up-to-date climate data are available from the KNMI (Dutch Meteorological Institute) ClimateExplorer.
Their regression analysis appears to suffer from over-fitting, since they have thrown in a lot of variables (both ‘meteorological’ and ‘economical’) for various vague reasons.
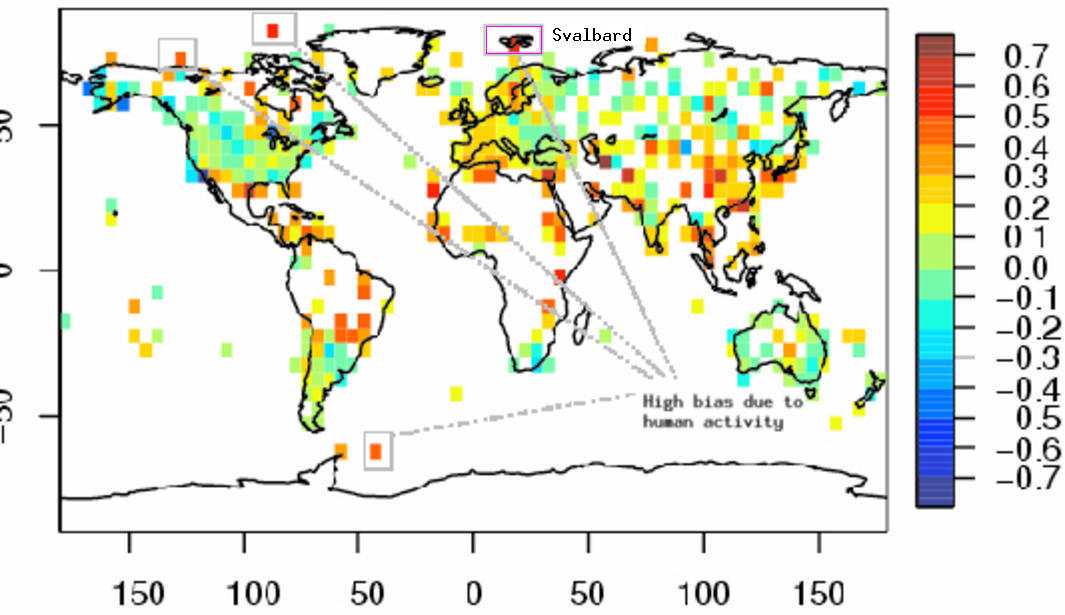
Not surprisingly, their analysis produces some strange results as a result of this shortcoming. They find that the greatest differences between measured and adjusted trends at Svalbard and other places in the Arctic and Antarctic (See marked sites in Figure below). This is not convincing. Thus, the results themselves provide examples of spurious values obtained by their analysis. Even if they were identified as ‘outliers’ (Svalbard was apparently not one), the fact that their analysis produced highest corrections for economic activity at these places suggest that their analysis is not very reliable.
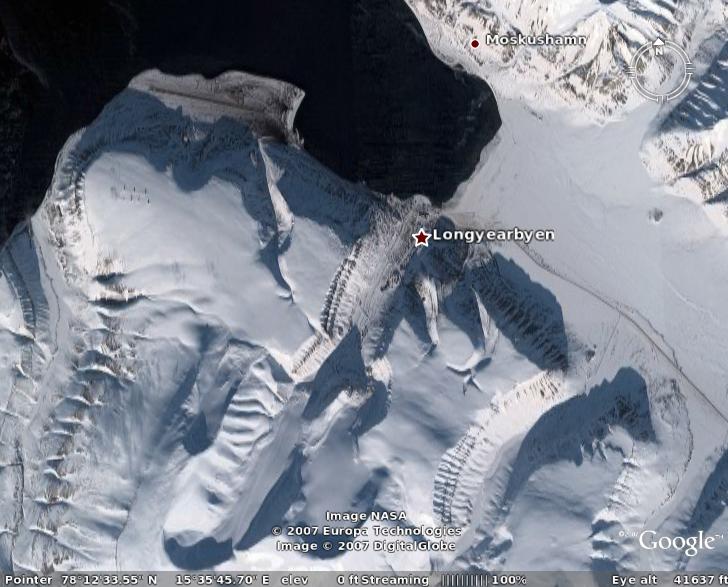
The graphic below shows a Google Earth image of Svalbard, which is one of the sites marked in the map above with a large trend correction due to economic activities.
I have not examined the economic data, but it appears that M&M2007 maybe cannot win – either (i) the spatial distribution of the economic indices are equally smooth and M&M2007’s attempt to account for dependencies within each country fails to resolve the problem of dependency between the countries, or (ii) the economic indices vary abruptly from country to country and thus have very different spatial scales and structures to those seen in the warming trends. Either option suggest that their analysis may lead to spurious results, over-fit, or suffer from inter-dependencies.
I also think that M&M2007 is biased and gives an incorrect picture, as they do not discuss the fact that also the world oceans are warming up, and whether any economic activity can take the blame for that. I think it is difficult to argue that factors such as the urban heat island effect plays an important role here.
They do not mention my criticisms raised in Benestad (2004) either, which discussed a number serious concerns about their previous study; They merely state, as if it were a matter of fact, that urbanisation and economic activity has been shown to affect local and regional temperature measurements – citing their old criticised paper.
Their analysis relies on University of Alabama-Huntsville (UAH) satellite data (Microwave Sounding Unit, MSU) with a weaker global trend than others, and neglect to examine or even mention other products such as the Remote Sensing System (RSS) data. The difference between these data sets are discussed in previous RC posts (here). They reckoned that any of their results would not be contingent on the choice of MSU product, but did not test this hypothesis.
It should also be kept in mind that their analysis involved too short time series (24 years) for a proper local trend estimation, as local circulation variations (e.g. the North Atlantic Oscillation), the annual cycle, and inter-annual variations, most likely will make the analysis more difficult. Climatic time series from single locations tend to be very noisy, but a clear signal emerges when taking the global mean (by taking the mean, random noise tends to cancel to some degree).
I find it a bit ironic when people use satellite data measurements to argue that GHG is unimportant. They rely on the fact that these measurements are derived using the very same type of physical laws as those predicting an enhanced greenhouse effect due to increased GHG levels (neglecting feedback processes).
I think it’s good that M&M2007 put a focus on the problem with data paucity and quality. There may very well be some non-climatic effects contaminating the measurements, but I am not convinced by their analysis.
So in summary, I think the results of M&M2007 analysis and conclusions are invalid because
– They do not properly account for dependencies.
– They over-fit the regression.
– Their results look unreasonable.
– They “cherry pick” the MSU data that gives the lowest trend
I’m going golfing in Pennsylvania in December and will be going in January also. So before you educated readers tell me there is a difference in weather and climate and before you go back eating your chinese and toasting to the betterment of the human condition, let me say the land masses are heating up and will be the demise of most land dwelling creatures including people. The human condition is that people are reactive, as the state of the world shows today. In a very short while, perhaps 300 years, land masses will be in the 110 degree range, and there is nary one thing we can do about it. Go back and observe, analyze, and make predictions, but do it as a Don Quixote, because we are not getting out of this one.
Economic activity is rooted in the now global capitalist push for both the desire for energy and desire for profit, deadly bedfellows for the planet, and mankind lacks the collective proactive skills to do anything different than buy and burn fossil fuels until we all die. Are temperature trends affected by economic activity? decidedly, yes. The question should be Is economic activity causing temperature trends, and we all know the answer to that.
Well, if by “econmic activity” they mean consumption of fossil fuels and forests, economic activity has a conspicuous effect. And the economic slowdown expected by many would be a relief. Moreover, or so it seems to me, if they divorce the economy from consumption of fossil fuels and forests, they risk irrelevance on economic or ecological grounds.
The probability that RC will comment on a paper being actively discussed elsewhere is approaching unity.
re Svalbard:
Economy:
Economic activity centres on coal mining, supplemented by fishing and trapping. In the final decades of the 20th century, tourism, research, higher education, and some high-tech enterprises like satellite relay-stations grew significantly. A 200 nautical mile (370 km) Fisheries Protection Zone around Svalbard was established in 1977 pursuant to the Act of 17 December 1976 relating to the Economic Zone of Norway. Despite recent discussions, Russia and Norway dispute their maritime limits in the Barents Sea and Russia’s fishing rights beyond Svalbard’s territorial limits within the Svalbard Treaty zone.
The Svalbard Undersea Cable System which started operation in January 2004 provides dual 1440 km fiber optic lines from Svalbard to Harstad via Andøy, needed for communicating with polar orbiting satellite stations on Svalbard, some owned by the National Aeronautics and Space Administration (NASA) and the National Oceanic and Atmospheric Administration (NOAA), both United States government agencies.
The Norwegian state-owned coal company employs nearly 60% of the Norwegian population on the island, runs many of the local services, and provides most of the local infrastructure. Coal production has increased significantly over the past 10 years, rising from less than 500,000 tons in 1994 to over 2,500,000 tons in 2004.[6]
Exploration for oil and natural gas is underway.
Coal mining in Svalbard:
The Ny Ålesund mine was closed down in 1963 after an explosion in 1962 when 21 lives were lost, and has since been converted to a scientific post.
As of 2006, there are three operational coal mines in Svalbard. There are large mines in Sveagruva (production 2 million tonnes per year,[13] and Barentsburg, while the small mine in Longyearbyen is used mainly to supply the town’s own power plant.
Demographics:
Svalbard has a population of approximately 2,400 people as of 2005. Approximately 70% of the people are Norwegian; the remaining 30% are Russian, Ukrainian and Polish.[citation needed] The official language of Svalbard is Norwegian. Russian is used in the Russian settlements, but formerly, Russenorsk was the lingua franca of the entire Barents Sea region. The annual population growth is -0.02%
Economic activity obviously has no direct effect on climate. Some things related to economic activity, such as urbanization, energy use, and pollution, do have effects on climate, both local and global, but economic activity in and of itself has no effect and it’s just silly to state that it does.
Economic activity means money changing hands (if we’re talking about GDP), and a few electrons, piles of paper, or sacks of gold changing hands are not going to change the climate.
At best, it’s sloppy use of language. At worst, it makes the results meaningless by not distinguishing between agriculture and coal plants (high climate effect/GDP) and a financial district (minimal climate effect/GDP).
PS: It appears that this paper is wrong on plenty of other counts, as mentioned in the main article.
Re 4. Indeed. This site has been losing its innovative edge (and some of its contributors), and has deteriorated into a column commenting other people’s work. This is not what the headline promises: Climate science by climate scientists. Furthermore, the choice of topics gives the impression that the so-called climate contrarians are the only people finding out anything interesting (true or not) about climate and its change.
You said: “I think it is difficult to argue that factors such as the urban heat island effect plays an important role here”
Consider the fact that many of the weather stations are located within the ever expanding “Heat Islands” mentioned. It would seem logical that the temperatures taken over time would reflect a corresponding rise with the growth of the urban heat islands.
Respectfully,
Joe Alderman
What’s with the RealClimate bashing in 4 and 6? This post exemplifies what’s best about RC: it’s educational and directly on-topic. This caviling borders on trolling.
Re: #4 (Steven Mosher), #6 (Dodo)
Don’t blame RC for sidetracking the discussion from real climate science to bogus pseudo-science. Place the blame squarely where it belongs: on McKitrick, Michaels, and Loehle.
The non-stop stream of sloppy research in order to discredit genuine climate science makes it necessary for RC to set the record straight. Keep up the good work!
Rasmus : They find that the greatest differences between measured and adjusted trends at Svalbard and other places in the Arctic and Antarctic (See marked sites in Figure below). This is not convincing. Thus, the results themselves provide examples of spurious values obtained by their analysis. Even if they were identified as ‘outliers’ (Svalbard was apparently not one), the fact that their analysis produced highest corrections for economic activity at these places suggest that their analysis is not very reliable.
I’m still reading M&M2007, but it seems they study two kinds of “artifact”: one due to local anthropic effect on measured data, other due to inhomogeneities. Could the Arctic and peri-Arctic biases be mainly related to observationnal difficulties (inhomogeneity) rather than economic activity as you suggest here ? There are probably few meteo. stations north to 60°N, so a lot of interpolation.
For example, I empirically observed that on Nasa Giss (Gistemp), when you smooth at 1200 km, 2007 is bit warmer than 1998, but when you smooth at 250 km (no data when no covergage), that’s the contrary. The main differences between the two estimates arise from Africa and… peri-Arctic, precisely (70-90°N).
http://data.giss.nasa.gov/gistemp/
[Response: Good question. If you want to look at trends over a longer period, inhomogeneouity is definately a problem, but is has not been a problem since 1979. THe very strong recent warming is also supported by bore holes on Spitzbergen. -rasmus]
I think it’s also worth pointing out that their analysis assumes a priori that any correlation with economic activity must perforce be related to a contamination of the surface temperatures by urban heat effects. This is certainly not the the only possibility, and the fact that they have apparently discovered urban heating in the satellite trends as well should have alerted them to this fact.
For instance, tropospheric ozone and black carbon emissions have local forcing components that are closely related to local emissions. Large scale land use similarly. The test of whether these factors produce correlations like those reported by M&M is available in the IPCC AR4 model archive. The fact that in 3 years since they first started this analysis, they didn’t once take a model simulation over the same period and do the same calculation is telling. This is of course in addition to the rather poor statistical significance alluded to by Rasmus. Checking their conclusions with random 25 year sequences from a model control run would have been a good test of the robustness to climate variability. Again something they didn’t apparently think of.
Another point : this paper of Hinkel et al. showed that UHI effect can be huge in peri-Arctc areas too : at Barrow (Alaska), 71,3°N, during the winter period, the urban area is 2.2 K warmer than the rural area.
Hinkel K.M. et al. (2003), The urban heat island in winter at Barrow, Alaska, International Journal of Climatology, 23, 1889-1905.
re: #11
The paper under discussion is outside my areas of expertise, but I get the impression that the author primarily focused on data from the physical world. Getting a handle on the quality of that data seems to be an issue.
For any given piece of research there are basically an uncountable number of things that were not done; some of more importance, some of less. Let’s make a list of what apparently has not been thought of with respect to, say, the NASA/GISS ModelE computer code. Many would say that because of what apparently has not been thought of, the ‘data’ from the code has no quality and is useless.
[Response: Your argument can be applied to anything and therefore nothing has quality or usefulness. Including your argument. Which is then self-contradicting. Think of it this way instead. All analysis is incomplete in some way. Thus conclusions should always be preliminary. As more analysis is done, the preliminary conclusion becomes stronger or falls. Writing an op-ed declaring that M&M proves that the surface record (and satellite record!) are contaminated by UHI effects is rather putting the cart before the horse, don’t you think? Especially, since most of the ideas for further analysis were already put to them in Rasmus’s original comment in the journal, and are pretty obvious in any case. If you have some obvious things to test with ModelE or new analysis you want to do, go ahead. That’s why the code is public. – gavin]
It is important that RC stay current with those such as McKitrick who believe that there are aspects to the science which are overlooked. RC represents the mainstream and as such is under continual attack. I often come here looking for specific refutations of contrarian views, especially when (as often) those views undermine orthodoxy.
RC should present current work and latest understandings as well, of course, but it is simply necessary to, sometimes, comment on other work, especially when that work gains a bit of traction.
We don’t see RC wasting much time disputing obvious denier rhetoric, but when a paper represents a seeming legitimate effort to do science, I (and I’m sure others) want to know what RC thinks.
I am unable to pull up the original papers (subscription required, etc.)
Is the “Michaels” in the M&M2007 paper Patrick J. Michaels at the University of Virginia?
Thanks!
(And, FWIW, I also thought the analysis by Rasmus was interesting and useful — Thanks!)
[Response: Yes. FYI there is a preprint on McKitricks’ site. – gavin]
At the center of this discussion is the explicit role of the GHGs in the observed warming. The terrestrial data likely remain contaminated to some degree by factors related to land use change, including vegetation change, urban heat island, changes in wetland distribution, etc. I have no doubt that due diligence has been exercised to remove the effects of the urban heat island from the terrestrial record (this has been discussed at length elsewhere on RC and other forums), but it is reasonable to conclude that artifacts related to economic activity likely remain. In light of this probability, which data should we use to validate the forcing effect of the GHGs? What are the implications of using only the ocean record?
I am an academic ecologist, and I speak and write regularly about land use change and climate change. While I have a better understanding than most on issues related to climate sensitivity, I would benefit from a direct, clear discussion of the relative importance of the forcing agents as they relate to the temperature record. Has the IPCC AR4 derived an incorrect estimate of climate forcings and feedbacks related to the GHGs? While it is unlikely that we can obtain complete certainty on this issue, it is important for mainstream climate scientists to continue to debate this issue in a manner that can be interpreted by rest of the academic community.
There is an ongoing tug of war between the global climatologists and those academics that seem to hail more from the meteorology groups. This debate is often contaminated by pejorative, and could benefit from more light and less heat. Within the academy there is a small, but influential and vocal group of GHG skeptics, including Pielke, Sr., M&M, Christy and others who variously argue that we are placing too much emphasis on mitigating the GHGs, to the detriment of the economy and human well being. While it is apparent that a low carbon economy could be a thriving economy, climate scientists must be as clear as possible about the explicit role of the GHGs. Pielke, Sr. has repeatedly claimed that the IPCC estimate of the forcing effect of the GHGs is in error. I urge the scientists at RC and elsewhere to develop a detailed analysis of this and deal with this issue as best they can. Please don’t refer me to an earlier post – instead let us see the most recent thinking on this issue explicitly addressing the most recent claims.
This issue is especially crucial to the construction of sound policy. I have recently returned from DC where I spoke with policy makers about the energy bill and cap-and-trade. My personal view is that a risk assessment approach is far preferable to a cost/benefit approach, and thus we should aggressively mitigate GHG emissions. Unfortunately, this is not sufficiently compelling to policy makers given that there are some credible scientists who argue that our money is better spent on other measures. It is arguable that we should also develop a portfolio of mitigation options related to compensating for changes in land use.
I look forward to seeing more discussion of this issue at RC and in the peer-reviewed literature. I agree with 8 and 9. It is essential for RC to do its best to clarify and set the record straight. Although I am skeptical of its conclusions, M&M2007 is being published in a top tier journal, and thus needs to be addressed as serious science.
Sincerely,
Stephen
rasmus wrote in the essay:
What makes this especially ironic is the fact that we measure the levels of greenhouse gases at various altitudes by means of the increased opacity of the atmosphere to various wavelengths (i.e., “channels” in satellite lingo). This is the mechanism by means of which greenhouse gases have an enhanced greenhouse effect as their concentrations increase over time.
and…
Complaints of this sort are right out of the creationist/IDist playbook. When scientists and mathematicians attack claims and arguments made by [ID]creationists, the response is … “look, our work is so important ‘darwinists’ have to attack it to support the ‘darwinist conspiracy’. So obviously, we’re right!”.
I suspect it’s common among science denialists of all flavors.
Paul, your golfing experience notwithstanding, the east coast of the U.S. has actually experienced cooling. This site explains that in the FAQ section on the Michael Crichton book “State of Fear.”
As for this article, I think the author missed the point. The HADcrut dataset and analysis presumes a randomness in the data for the purposes of assessing error. Even if the dataset is smooth and continuous, if there is a non-random component (i.e. a correlation), the correlation will need to be modeled in the error bars. IF that didn’t happen, this new paper is pretty significant. I suspect the reviewers at JGR-Atmos have representation in IPCC and must believe this new paper is significant.
This view of Longyearbyen give a slightly different perspective than the Google Earth view you provided.
http://static.panoramio.com/photos/original/2129791.jpg
Economic impact on temperature? Depends on where the thermometer is.
[Response: Thanks for the nice picture. The thermometer is located near the airport (with about two landings/departures a day), to the far left of the picture. Other measurements from nearby sites, such as Ny Ålesund, Sveagruva, Hopen & Bjørnøya, show similar warming as Longyear byen. There is no economic activity near these sites, except for at Sveagruva. -rasmus]
Every action within an economic system has associated with it an ensemble of ghg emissions. Those emissions can be traced and accounted for in the carbon accounts of the economic unit, and specific patterns and relationships can be identified amongst the myriad of self-organising economic units and subsystems. Thus, provided one accepts the relationship between ghg and temperature, it would be fine to assume that temperature trends are affected by economic activity. Economic activity is in effect an order parameter. Interestingly, the inverse problem can be examined. Does temperature trend affect economic activity? It certainly does.
Robert Edele #5:
The utilization of natural resources is the very basis of economic activity, therefore it IS economic activity with a direct and measurable impact on many facets of the environment, climate included,.
Money does not change hands just so the “exchangers” can have fun!
Every time I start my internal combustion engine I am taking part in econimic activity. Why? Because I have to work to buy gasoline, and in a cascade of “economic activity” a fossil fuel company has to employ and pay people to make the fuel available.
When I start my automobile, just because money is not changing hands at that instant, does preclude that activity from being economic.
We all know what is meant by the term, is it then not a bit, in your word, “silly” to argue that economic activity has no direct effect on climate?
Steve Horstmeyer
Statistics is such a difficult and counter-intuitive subject that we and the public need the best possible assistance in countering the claims of liars. Statistics makes life too easy for liars otherwise. Since very smart and honest professors have been known to make mistakes in statistics, checking by other professors is needed. Thank you, rasmus, for making us aware of a few of the pitfalls the unwary may fall into, and the level of care required to write a good paper on the subject of climate.
Here is a planned ‘economic activity’ which ought to have a positive impact, not only on climate, but also on the well-being of the peoples of the Sahel:
http://biopact.com/2007/12/eu-and-africa-to-build-green-wall.html
John Norris (#19) wrote:
You can get windspeed here:
http://www.unis.no/research/geology/Geo_research/Ole/TemperatureGruvefjell.htm
Several meters per second looks pretty standard.
This has links to the information on the various climate monitoring equipment in the area:
http://www.unis.no/research/geology/Geo_research/Ole/ClickableLongyearbyenSurroundings.htm
… including the location of the thermometer.
And satellites are SUCH hotbeds of economic activity …
And your panorama makes it clear that Longyearbyen is a small place.
Was that photo created by the surface stations photo documentation project, by any chance?
(end sarcasm)
Could someone please tell me how this paper got through peer-review at JGR-Atmosphere? I am stunned and disheartened that something this horribly flawed is coming out of an AGU publication.
If urban heat islands are to be discounted when looking for trends – surely they must be included when looking at the big picture.
If one looks at those classic images of The Earth at Night one can see the twinkling evidence of mankind’s presence most places. And those lights are mostly identifying the location and extent of UHIs.
Is not the heat from UHIs entitled to sit at the same table as heat from bare earth when we ask about the present global temerpature? When does the data from the UHI’s get considered – when their sweltering streets, shimmering towers and streaming chimneys cover more than 50% of the earth, or somewhat sooner?
Re 25
The UHI effect IS accounted for, and its (rather negligible) effect is mentioned in the IPCC 2007 and other documents. It is not whether UHI is discounted or not; the question is what effect that has on the the Global mean temp, and regardless of what McKitrick says, it is not a practical amount. It is also not influencing increased ocean heat content, melting ice caps and glaciers, satellites showing tropospheric warming or strato cooling, etc
Nigel Williams (#25) wrote:
Love the poetry, but the answer is still no.
Not when you are trying to determine global or latitudinal trends in temperature. Need to keep things weighted according to area – and cities are pretty tiny in comparison to the countryside.
*
Fortunately we don’t seem to have to worry all that much regarding urban heat islands — most of the time. As is well-known, there are various corrections made to eliminate any urban heat island effect, and they appear to have been quite successful:
Assessment of Urban Versus Rural In Situ Surface Temperatures in the Contiguous United States: No Difference Found
Thomas C. Peterson
Journal of Climate, VOL. 16, NO. 18, 15 September 2003
http://www.ncdc.noaa.gov/oa/wmo/ccl/rural-urban.pdf
*
Likewise, according to Peterson and Vose (1997) analysis cited by IPCC 2001, the long-term (1880 to 1998) rural (0.70 C/century) and full set of station temperature trends (0.65 C/century) showed that rural stations were trending slightly higher. More recently, a 1998 analysis for the long-term trends (1951-1989) rural (0.80 C/century) and full set of station temperature trends (0.92 C/century) showed urban stations trending slightly higher.
However, in both cases, the difference between urban and rural trends were not statistically significant. As such, it would appear that the Urban Heat Island effect is either negligible or corrected for when climatologists derive their trends for temperature.
Please see:
2.2.2.1 Land-surface air temperature
http://www.grida.no/climate/ipcc_tar/wg1/052.htm#2221
*
What I would be interested in is whether GISS corrects for the Urban Heat Island effect in Barrow. I would presume they do. That is standard operating procedure, I believe. And we have known that it would be a problem if left uncorrected since 1983. For the winter, not summer, since for the latter it is weak to non-existent.
Please see:
Am I the only one who noticed that reducing the land warming trend by 50% would make it lower than the ocean warming trend??
land =http://www.cru.uea.ac.uk/cru/data/temperature/crutem3vgl.txt
ocean =http://www.cru.uea.ac.uk/cru/data/temperature/hadsst2gl.txt
given that land responds faster to solar warming “seasons” it would make some sense that land should also warm faster
also there are some cool spots that surprised me like the east coast of the U.S.A and Australia
personally I think their trying to make a case for urban heat continents..
[Response: You get the prize for being the first to mention it. Well spotted! -rasmus]
Firstly, I’ve only had a 15 minute look at this paper, but the quality of the analysis concerns me.
In the abstract M&M say, “…we test the null hypothesis that the spatial pattern of temperature trends in a widely-used gridded climate data set is independent of socioeconomic determinants of surface processes and data inhomogeneities. The hypothesis is strongly rejected (P= 7.1×10⁻¹⁴ )…”
Rasmus is completely correct. They have not considered correlation between data points. If they’d doubled the number of grid points the p value would be infinitesimal.
I noticed they left out outliers – such as Arctic and Antartic “hot-spots” when fitting the model. Outliers can be a result of measurement errors or even chance results, but high lattitude “hot-spots” are clearly neither of these. They are regions of stronger than average warming trend. These outliers are most likely a sign of model failure.
I’m still coming to terms with their model, but the inclusion of many non-significant parameter estimates in Table 1 is a worry.
I suspect another big problem with the model is omitted variable bias. The rate of southern hemisphere (and tropical) warming is slower than northern hemisphere warming and that includes landmasses. But economic activity is strongly associated with the extra-tropical nothern hemisphere. As far as I can tell there is no variable in the model to account for this hemisphere effect. This effect will then be incorporated into other variables associated with hemisphere – i.e. GDP, coal production etc – resulting in a biased estimate of these effects, the so called “omitted variable bias”.
From the abstract of the paper
Using the regression model to filter the
extraneous, nonclimatic effects reduces the
estimated 1980-2002 global average
temperature trend over land by about half.
So I’m confused – is there a global average temperature or isn’t there? ;-)
PaulM posts:
[[Economic activity is rooted in the now global capitalist push for both the desire for energy and desire for profit]]
And yet the Soviet Union and Peoples’ Republic of China were/are the most egregious polluters in the world. Funny how that works.
All due apologies for going OT.
On CNN this morning (around 6:30AM 10 Dec), their science reporter Miles O’Brien did a story on Al Gore at the Nobel Prize ceremony. This is a SCIENCE reporter! Instead of illuminating us on the SCIENCE (and Gore’s efforts to publicize the science) behind the Prize, Miles lead off with Chris Horner (of “Politically Incorrect Guide to GW”) denouncing Gore. I won’t repeat Horner’s trash talk, only that it was vicious ad hominem.
Why they gave this luddite corporate hack a platform in the middle of this story is puzzling, to say the least!
The piece may show up on CNN.com. This style of reporting is despicable and must be protested.
Maybe OT, but does anyone have any idea of what kind of money it would cost in the way of funding to research and produce a paper like this? McKitrick has been recieving what looks to be rather substantial funding from the Social Sciences and Humanities Research Council to do this work (into the $100,000s).
What I’m trying to understand might be in the post but I haven’t been able to dig it out. Sorry.
I take it that a simple summary of the paper’s contention is that climatic terrestrial temperature measurements have been and are overstated because of increases in economic activity. My question: do they contend that economic activity per se is the culprit, or that heat islands are the culprit — stemming from economic activity which tends to move things from rural to urban areas. It’s not obvious how economic activity per se can add any heat without extreme stretching of the meaning of “economic activity”, other than maybe its increase in GHG output, which would form a ludicrous circular logic. In other words does their argument boil down to simply the heat island effect? Or would they claim something else?
I’m posting this before reading the comments which might have the answer….
Re #30 (Barton Paul Levenson)
“PaulM posts:
[[Economic activity is rooted in the now global capitalist push for both the desire for energy and desire for profit]]
And yet the Soviet Union and Peoples’ Republic of China were/are the most egregious polluters in the world.”
Not really, at least so far as GHGs are concerned: neither approached/approaches the per capita emissions of the USA, Canada, Australia, or even western Europe – though not for want of trying. With regard to the PRC, a considerable proportion of current emissions result from manufacture for export to the rich world; and more fundamentally, it is arguable that China is now an integral part of the capitalist world-system (although the USSR was not). It is the very success of capitalism in increasing economic activity that now threatens to bring about its own collapse.
Hello Rasmus. Thank you for your comments on my new paper. Here are some responses.
Spatial autocorrelation is an issue, in principle, with any cross-sectional study. I agree with you. You should have mentioned, though, that we applied a GLS estimator with White’s HCCME terms and clustering structure built in. Adding in local spatial AC coefficients would, for many of the regions, be redundant on top of the exiting off-diagonal elements. My conjecture is it would not affect things. However, that’s no more than a conjecture. Perhaps a reader who is interested, and better than me at programming, will figure out the math to put spatial AC controls in the GLS estimator while also controlling for heteroskedasticity and clustering.
I accept your concerns about whether we used the most updated data possible. It was a large data base to put together. It’s available at my web site. If someone wants to swap in columns with newer series (making sure the definitions are consistent) then the code can easily be re-run.
I don’t agree with your concerns about over-fitting. Over-fitting becomes a detectable problem when you have a high r2 and very low t-stats. We don’t have that, and the variance inflation factors indicate that our covariates are contributing unique explanatory power.
Your paragraph beginning “I have not examined the economic data…” seems to rule out using socioeconomic covariates under any circumstances. Yes, they change abruptly at national borders. Yes, an ideal data set would have them change continuously, but discrete changes doesn’t mean a variable can’t be used in a regression model. You’ve set up a criterion where it’s Heads-disqualified, Tails-disallowed. Can you state what circumstances you would permit socioeconomic covariates for this type of test?
You raise concerns about spurious results, but we have a few tests for this, including the endogeneity discussion in Sct 4.4. Can you be more specific? Your point was rather vague.
The oceans are obviously not at issue here. Perhaps there is an issue whether data collected from ship intakes will prove to be comparable to data collected by the argo network, but that’s for others to examine.
It is not true that our discussion of the effect of urbanization and land-use change rested only on our 2004 paper. In the on-line preprint (http://www.uoguelph.ca/~rmckitri/research/jgr07/jgr07.html)
pages 4-11 discuss anthropogenic surface processes and inhomogeneities, and there are many references therein.
Yes, we used the UAH data. I will eat my toque if that choice matters greatly, but, again, the data base is on-line and others can easily check.
Is 24 years too short to extract a trend? Well, 30 years would be better. If we had 30 years and the same results emerged, would your position change? I doubt it. So maybe the point is at most a secondary one.
Re the use of MSU data. Nothing in my paper disputes the idea that GHG are infrared-absorbing, or that oxygen emits microwaves. I’m not in a position to say anything about these things either way. But your qualifier is key: “…neglecting feedback processes…” Feedback processes are pretty much what is at issue.
Your conclusion says that there may very well be some contamination of the data. I suppose this admission represents progress. But considering the importance of the data at issue, is this an adequate response on your part? I have made the case that there is substantial contamination of the data. You don’t accept my results, which is your prerogative, but if you want to argue that there is only a small contamination problem, taking into account both surface processes and inhomogeneities (i.e. not just UHI effects), you should make the case with clear empirical methods.
Oh, and bcl, this kind of research doesn’t cost much at all. I used a bit of time of one of my research assistants for part of the data assembly. Otherwise the data are free and I used software I already own. And there are page charges for JGR. I am funded by SSHRCC for a range of research projects.
[Response: Thanks for your response, Ross. I think that your model is over-fit because I think that you have not eliminated the dependence and include too many inputs without any clear/understood connection. A regression analysis will always find a combination of weights giving the ‘best’ fit. You find greatest ‘biases’ in locations far away from places such as the Arctic and Antarctic. I don’t find that convincing. -rasmus]
Re 34 McKitrick
“the oceans are not an issue here”
If the oceans are warming, and we know that heat is going in and not going out or just being redistributed, then we know an external agent is acting on the climate system and this is unequivocal across the globe from ice sheet/glacier responses to SST/atmosphere/surface temperatures, snow cover decline, etc. I am not sure why this wouldn’t be an issue in a study going over UHI impact of global land temperatures, since one would imagine this external agent is also acting on land. One couldn’t say that the CO2+feedbacks are just acting on oceans and polar and rural regions, but not in urban areas, and that UHI makes up for this in the instrumental record.
As for the UAH data, it was not right, so shouldn’t have been used but I have no reasonable insight into how that would have effected your study. — C
John Cross (#29) wrote:
The following might help:
According to the Pathfinder data, it would appear we have slightly underestimated the trend in the global temperature (by 0.09 C) — using ground-based measurements from 1981-1998. NCEP reanalysis of the data had shaved another 0.06 C, so it underestimated the trend by 0.15 C, according to the Pathfinder data. Not sure how statistically significant that is though.
> It is not true that our discussion of the effect
> of urbanization and land-use change rested only
> on our 2004 paper. In the on-line preprint …
Can we assume the journal’s peer reviewers approved the online preprint version? I am not sure why they differ.
The real question here is whether measured global warming has been exaggerated by changing human activity in the vicinity of the measuring stations.
There is no question that the measurements themselves are affected by local human activity. We attempt to adjust for this “contamination” (to use McKitrick’s term) algorithmically.
Are these adjustments correct? For purely algorithmic reasons, I have long been skeptical.
The way to test this is to do precisely the sort of study that McKitrick has done. The correlation that McKitrick has shown between socioeconomic activity and the temperature anomaly is truly startling. I’m surprised that so many here are willing to dismiss it so quickly.
I agree with Rasmus that spatial correlations would tend to reduce the confidence with which McKitrick makes his conclusions (and I simply don’t have the background to understand McKitrick’s response), but even if the conclusions are overstated, the correlation is real, and difficult to question.
Isn’t it incumbent on purveyors of global temperature data to prove that their data is NOT “contaminated”?
Doesn’t McKitrick’s analysis STRONGLY suggest that this is not the case?
RE Longyearbyen
Does anyone know of a site with graphs of cloud cover and temperature anomalies for Longyearbyen? I’m particularly looking for records that cover the period from about 1935 to present. Anomalous high temps at west-facing near-ocean locations are my interest, and this looks like a prime candidate. All the papers I’ve googled have been behind a pay-to-view wall.
I would expect it to exhibit a rising temperature spike starting in 1939.
TIA.
JF
re #34/Rasmus: I think overfitting due to dependence and too many inputs without clearly understood connection might be a problem also in other areas like multiproxy temperature reconstructions (many uncalibrated proxies regressed on, say, instrumental temperature PCs). Maybe you could help Ross by explaining how the problem has been avoided, e.g., in the landmark paper by Mann et al. (1998)?
[Response: Step-wise regression is often preferred, but I’d recommend a proper cross-validation. -rasmus]
[Response: Cross-validation (and objective selection rules) are the key here, as indeed emphasized by Mann et al (1998), and driven home fairly convincingly by the followup papers by Wahl and Ammann we’ve referenced above. You should read these (and obviously, re-read Mann et al 1998) to understand the issues better. -mike]
Thanks Timothy 26.
I would have thought you needed to keep ‘things’ weighted in terms of energy content per unit area not just area alone? Thus won’t the energy of the UHIs figure rather more strongly in the overall picture?
Otherwise it just seems to me that we are looking for trends among a sample we are ever-reducing as old stations are knobbled by the UHI effect. Isn’t this obscuring how ‘inconvenient’ the truth really is about warming globally?
Yet would not the UHIs put more (in fact most) anthropo-energy into circulation, capture more insolation and (because of effects like inversions holding higher concentrations of GHGs) retain more energy locally at lower altitudes?
That there is still an upward trend to be found in the remaining non-UHI stations is useful info, but what do we see if we use all stations on say a 10km square grid (or 10″ grid or whatever) with stations within a square averaged and look at the past and present energy content (Joules) of the total atmosphere globally over time?
Isn’t that total energy content including UHIs the figure that matters because that energy is the meat in the sandwich between the energy additions to the system and the energy loss to space which in turn defines the global temperature?
Re: #11 Response by Gavin
[……..If you have some obvious things to test with ModelE or new analysis you want to do, go ahead. That’s why the code is public. – gavin]
Is this a valid challenge? Many (Most ?) of us don’t have the expertise or the capacity( by a long shot) either in our gray matter or on our hard drives to run alternative tests on Model E or any equivalent. Also Nasa/ Giss works as a team and on company time. Do you really expect a poster working alone in his spare time to take you up on the above statement. I don’t much like the way the war in Iraq has been handled, but if somebody were to say “We’ll put you in charge – go ahead and solve the debacle”, I’m sure I couldn’t do any better.
You shouldn’t have to have the knowledge of say a four star general or an expert climate modeler in order to make good faith criticisms. Also this works both ways. Because you’re unhappy with the M&M paper, you shouldn’t have to develop your own paper on the same topic, using their method of analysis or another method of analysis with their own or your own data.
[Response: I agree. Good faith criticisms should be welcome. But McKitrick’s op-ed and declarative statements seem to have done before any of those criticisms were dealt with. (PS. you could run ModelE on your home linux box if you want, and we have a port for windows in the works- you don’t need to do that to make good faith criticisms, but if you wanted to see how it worked you could in fact see for yourself). – gavin]
RE Nigel Williams (#40)
In principle, global average temperature over a given period would be defined as the integral over the surface area, then integrated over the time period under consideration, then divided by the product of the surface area times the time.
As stations measure temperature over a limited number of points, one will need to interpolate temperatures between stations over a given area, but in no small part this will involve removing the effects of Urban Heat Islands. Technically such an average will be refered to as being weighted by area and will make reference only to temperatures, not heat content.
Satellite measurements should be more accurate, both in arriving at global average temperatures and in identifying trends over a given period as they are able to take readings from a far larger number of points. As such when Pathfinder satellite gives a larger trend in global temperature of 0.43 C/decade but groundbased measurements give 0.34 C/decade, I suspect that the higher satellite-based trend is more accurate.
But yes, urban temperatures are important for their own sake — but they are relatively insignificant when compared to the effects of greenhouse gases, and without corrections for UHI would give a distorted picture of the rise in global average temperature. However, given the results of Pathfinder, it would appear that we have overcompensated for the effects of UHI.
#41 Timothy, what is Pathfinder Satellite ? (The link leads to another discussion without a precise reference). If you look at UAH data for lower troposphere trends on land and NH (used by M&M 2007), you get 0,24 K/dec (0,33 K/dec CRU, 0,34 K/dec NCDC, 0,29 K/dec Giss, cf AR4 tab. 3.2 p. 243). Anyway, even if the trends were the same, I guess it’s not the M&M2007 purpose to look at global correlation, rather to assess local (grid by grid) correlations between Ts, Ttropo, economic activity.
Other point (more general) : UHI is detectable even for small towns (see Torok 2001), not just big cities, and anthropic effects on surface energy budget is not limited to urbanization.
Torok S.J. et al. (2001), Urban heat island features of southeast Australian towns, Aust. Met. Mag., 50 1-13.