Guest Commentary from Urs Neu
While analyzing tropical cyclone records is difficult enough (see ‘Tropical cylone history – part I’), it is even more challenging to reliably estimate hurricane activity back in time. Recently, Nature published an attempt to reconstruct past major hurricane activity back to 1730 (Nyberg et al. 2007). The authors concluded that the phase of enhanced hurricane activity since 1995 is not unusual compared to other periods of high hurricane activity in the record and thus appears to represent a recovery to normal hurricane activity. The paper was advertised in a press release put out by Nature and received broad media attention.
Although the approach outlined by the authors is interesting, the study contains in my view a number of problems, as outlined in a comment published in Nature today (Neu 2008):
The authors use a couple of coral records and a marine sediment core from the Caribbean to reconstruct first wind shear and then major hurricane activity in the tropical Atlantic. First they find a good correlation of their proxy records to wind shear measurements in the mean hurricane development region (MDR). There are two interesting features here: the coral proxies show a negative correlation to wind shear over the MDR, but a positive correlation north of it. Thus, in relation to hurricane activity there is an opposite effect of wind shear in different regions (Fig. 2 of Nyberg et al.). We’ll come back to that later. The sediment proxy shows a positive correlation to wind shear over the MDR and no correlation north of it. Thus, since the two proxy records are correlated to wind shear in the opposite direction, one would expect that the proxies show opposite patterns and trends. This is more or less true for the period 1950-1990 used to calibrate (or ‘train’) the statistical model. However, for the preceding 230 years, the long-term trend is the same for both proxies. This clearly indicates, that at least one of the proxies has a wrong long-term trend, because they show an opposite long-term trend of wind shear. Thus the long-term trend of a reconstruction using both proxies does not seem very reliable. Nyberg et al. did not comment on this basic problem in their reply (Nyberg et al. 2008).
For the reconstruction of past major hurricane activity they use these two proxies again together with a proxy for SSTs. Besides the problem of two proxies with opposite long-term trend, the coral proxy has, as mentioned, an opposite correlation to wind shear within and outside the MDR. Since 1944 about 50% of major Atlantic hurricanes have reached major hurricane strength only outside the area of positive correlation (in the area north of 20ºN between 50 to 75ºW and north of 25ºN outside this section), i.e. in an area with no or an inverse correlation to the proxies. Since wind shear seems to be high in this area at times when it is low in the MDR, the relation of major Atlantic hurricane frequency to the coral proxy does not seem so evident from physical considerations. Moreover, the fraction of major hurricanes observed outside the MDR varies with time (Figure 1) and might have changed over the last decade, which further complicates the relationship.
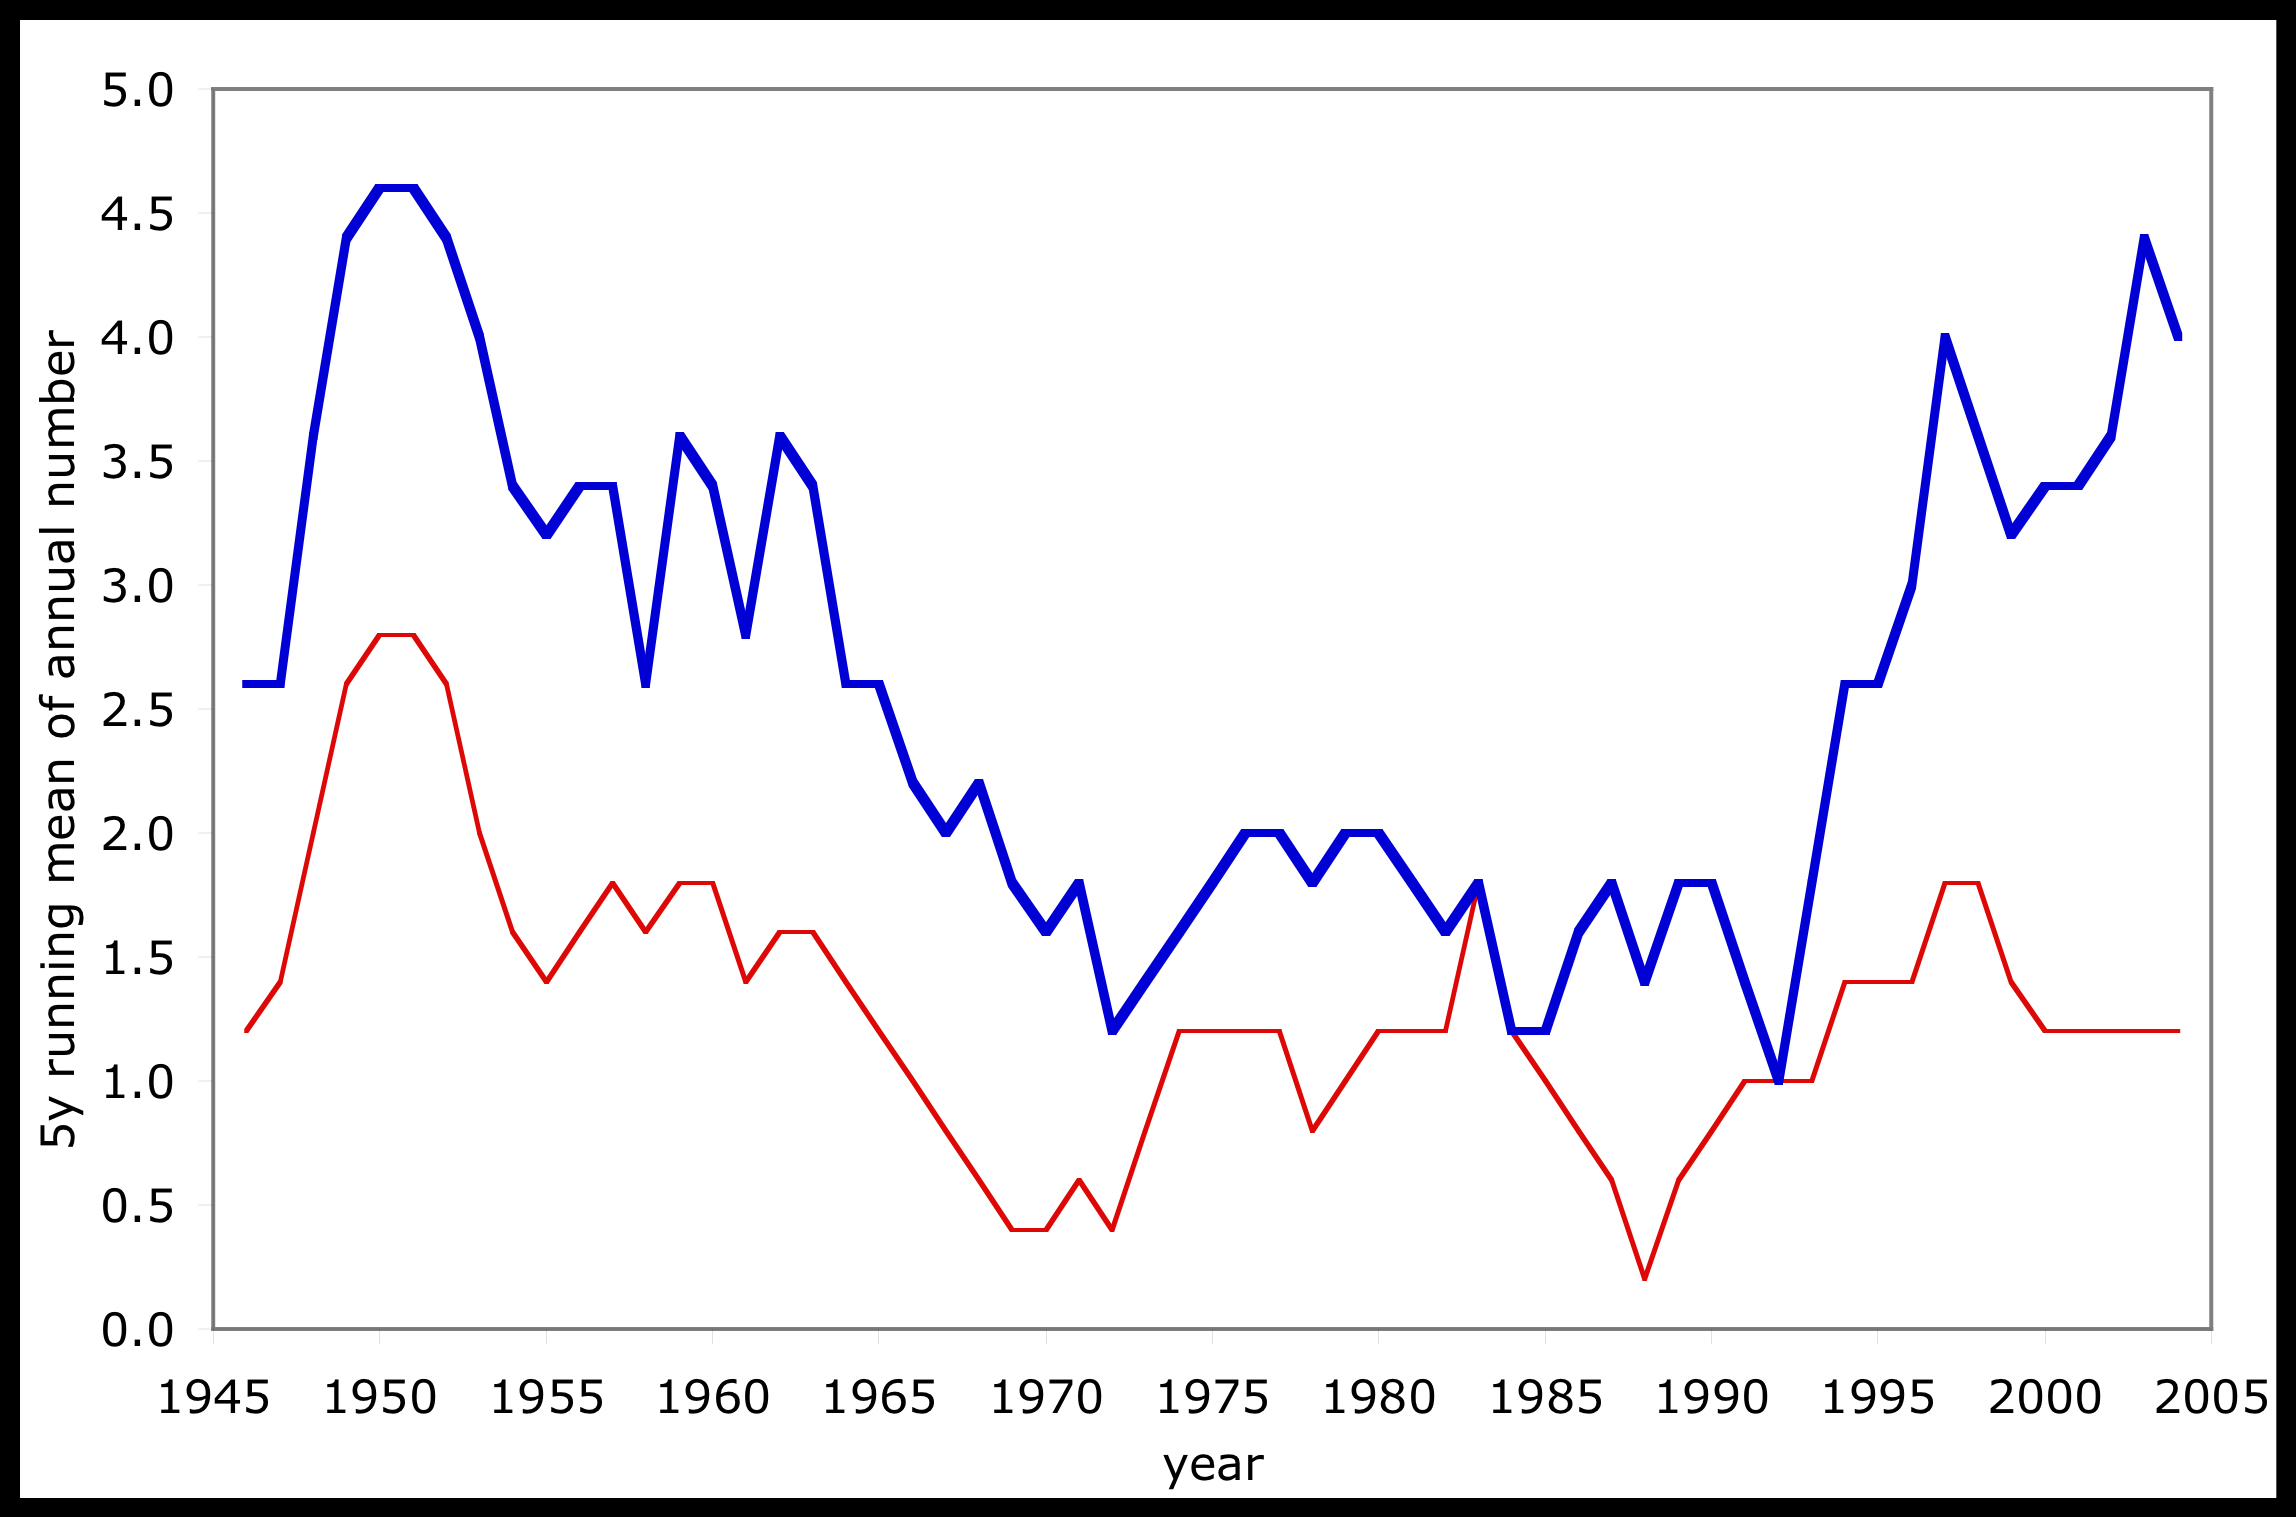
Figure 1. Major hurricanes outside the MDR. The annual number of major hurricane tracks where major hurricane status is only reached north of 25ºN or north of 20ºN between 50-75ºW (red line) and the total annual number of major hurricanes in the Atlantic (blue line), shown both as 5-year-running mean. Data is from the NOAA National Hurricane Center best track data set (HURDAT).
Although the correlation patterns presented by Nyberg et al. suggest a good correlation of their Caribbean proxies to wind shear over a large part of the Northern tropical Atlantic, this does not mean automatically that the correlation of the proxies to total Atlantic major hurricane activity is representative for the whole Atlantic as well. Firstly, hurricane activity is influenced by other factors than wind shear (which might vary over different areas), and secondly the effect of wind shear evidently is opposite in different regions.
There is a correlation of the proxies to major Atlantic hurricane activity over the period 1946-1995, however, the large activity increase already starts more than 5 years earlier in the proxies than in the hurricane record. The authors explain this time lag by the El Niño in the early 1990ies, however, since the influence of El Niño partly works over wind shear, this influence should be already included in the proxies.
Neither the reconstruction nor the calibration period covers the strong increase in major hurricane activity in the 1990ies, but it is obvious from observed wind shear, and recognized by the authors, that this increase cannot be explained by wind shear and is probably due to the increase in SSTs as several studies have pointed out (e.g. Hoyos et al. 2006). Since the training period of their reconstruction model covers a phase, where the main variation of hurricane activity seems to be mostly through wind-shear (1946-1990), but not the following phase, where SST changes are the most important factor, the model probably does not represent the influence of SSTs very well.
Now we come back to the question of the reliability of the hurricane record. One of the big problems of the Nyberg et al. reconstruction is, that it is far off the hurricane record before 1944 (Figure 3 in Nyberg et al). For the period 1850-1944, the reconstruction shows more than 3 (about 3.3) major hurricanes per year on average, while the hurricane record has less than 1.5 per year. Nyberg et al (2007) explain this discrepancy by the unreliability of the hurricane record. This explanation seems too simple. There are, as discussed above, uncertainties in the hurricane record. These are, however, not infinitely large. I have tried to estimate an upper error bar for major hurricane activity. Since there are no estimations of underreporting biases of major hurricanes, I assumed a constant proportion of major hurricanes to total tropical storm number. As Holland and Webster (2007) have shown, this proportion has some multidecadal variation, but these variations are not very large on the 50 year time scale, and there seems to be no significant long-term trend. I used the highest reporting bias estimations of tropical storms by Landsea (2004, 2007) – which are probably too high, as discussed in ‘Tropical cyclone history – Part I’, i.e. 1851-1885 plus 3 tropical storms per year on average; 1885-1965 plus 2; 2003-2006 minus 1; see Figure 2, black line).
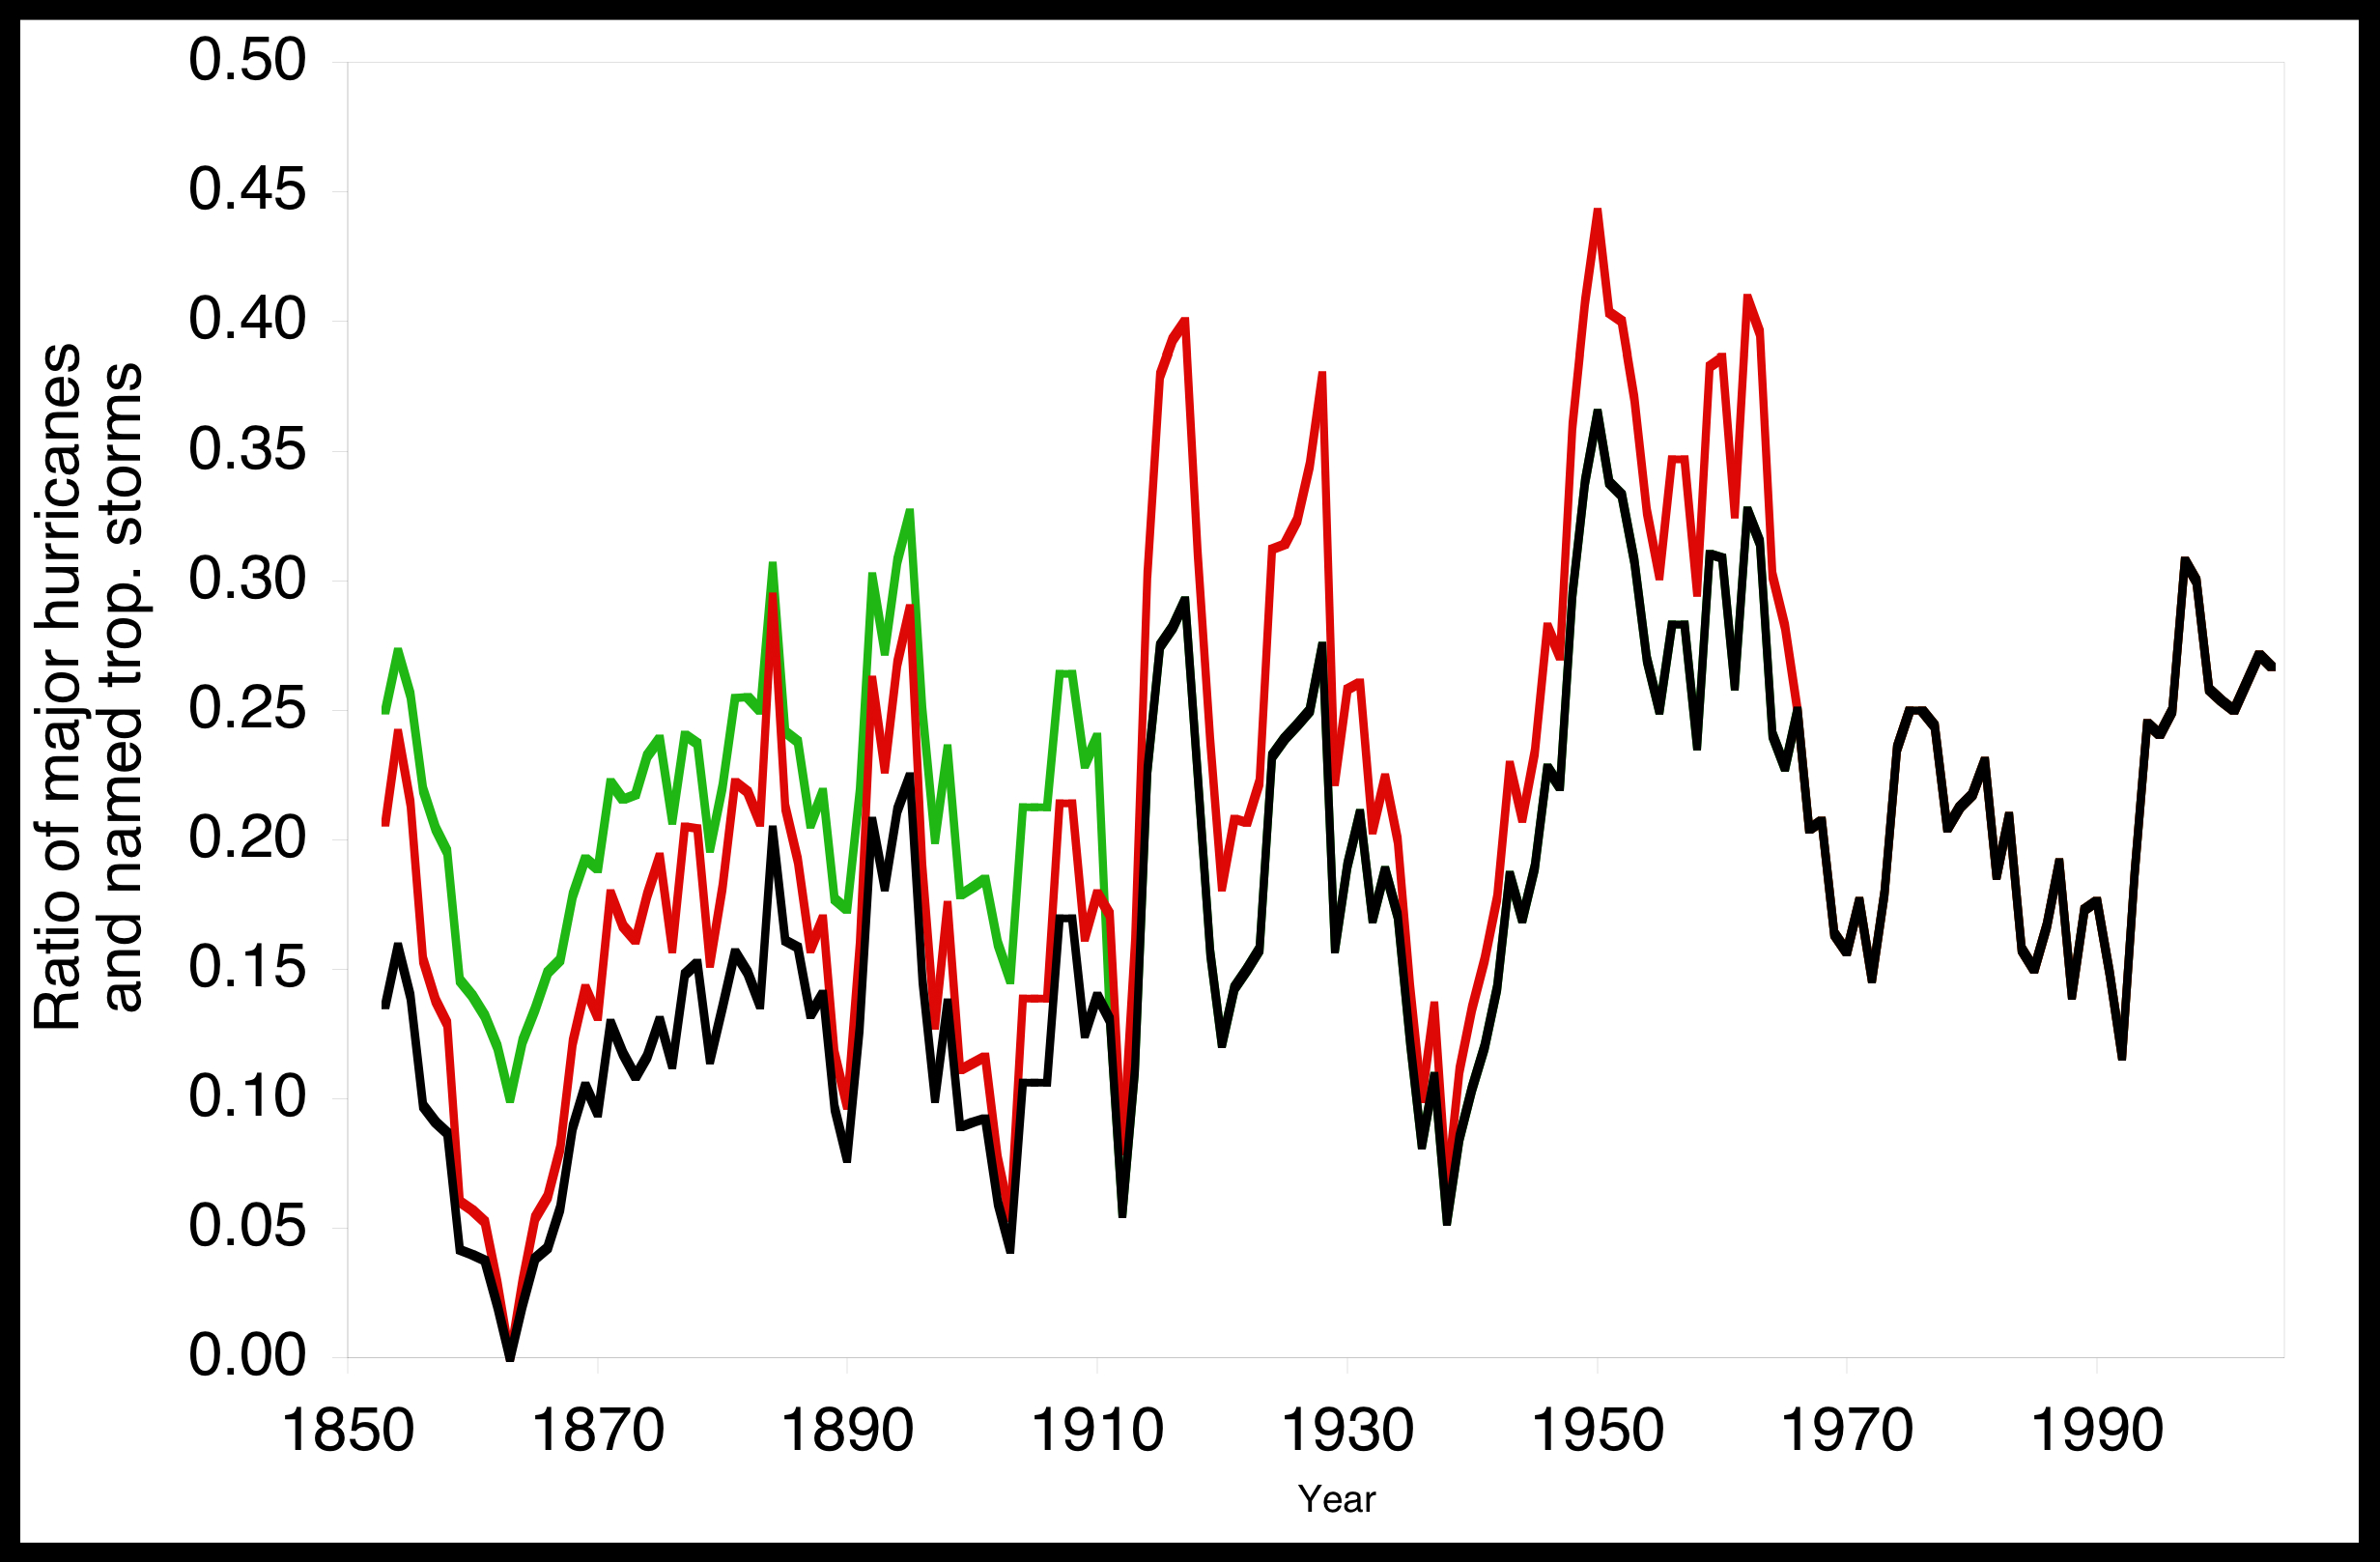
Figure 2. Major hurricanes compared to the total number of tropical storms. The red line shows the 5-year moving average of the ratio between major hurricanes and the total number of tropical storms calculated from the best track data of the NOAA National Hurricane Center (HURDAT). The black line shows the ratio after correction of the observational bias proposed by Landsea et al. The green line shows the ratio after correction for a possible observational bias of major hurricanes before 1910.
Nyberg et al. claim that Landsea suggests 0-6 additional storms per year before 1885 and 0-4 per year before 1900 and thus the ‘upper limit’ correction should be 6 and 4 storms, respectively. However, the range given by Landsea represents the annual variation of the bias, not an uncertainty range of the average (I very much doubt that Landsea thinks a zero correction on average to be possible).
The average ratio from 1910 to 1965, i.e. before the satellite area, is the same as after 1965 (21%). Thus there is no evidence to assume a significant underestimation of major hurricanes. However, for the period before 1910 a correction of plus 1 major hurricane per year is needed to attain a similar mean ratio (21% major hurricanes) as in the satellite period (Fig. 2, green line). The adjusted record has a mean of just 2 major hurricanes per year between 1851 and 1940. Thus even if taking into account a high observation bias, the Nyberg et al (2007) reconstruction overestimates major hurricane frequency before 1940 by at least 50%. Observation uncertainties therefore do not explain the mismatch of reconstruction and observation as supposed by the authors.
Even if using an extreme correction of plus 5 TCs before 1900, the corrected record does not overlap the error bars given by Nyberg et al (2007). Or, looking the other way round, to get major hurricane frequency as shown by the reconstruction, the observational bias prior to 1900 would have to be in the order of 10 tropical storms per year on average, which is not very likely.
In summary, there are serious doubts about the representativeness of the proxies used by Nyberg et al., and there is a clear mismatch of reconstruction and earlier observation. Therefore the conclusions drawn in that paper are on very weak ground.
Well, what can we conclude from the discussion: Paleo-tempestology is a brand new field of study and there is undoubtedly a long way to go before the reconstruction of extreme events (like hurricanes) in the past will be anything more than suggestive. However, there’s a lot more data out there waiting to be collected and analysed.
References:
Holland, G.J., and P.J. Webster (2007): Heightened tropical cyclone activity in the North Atlantic: natural variability or climate trend? Philos. Trans. R. Soc. Ser. A, 365, 2695– 2716, doi:10.1098/rsta.2007.2083.
Hoyos, C.D., P.A. Agudelo, P.J. Webster, & J.A. Curry (2006). Deconvolution of the Factors Contributing to the Increase in Global Hurricane Intensity. Science, 312, 94-97.
Landsea, C. W. (2007), Counting Atlantic Tropical Cyclones Back to 1900. EOS, 18, 197-208.
Landsea, C. W., C. Anderson, N. Charles, G. Clark, J. Dunion, J. Fernandez-Partagas, P. Hungerford, C. Neumann, and M. Zimmer (2004), The Atlantic hurricane database re-analysis project: Documentation for the 1851–1910 alterations and additions to the HURDAT database, in Hurricanes and Typhoons: Past, Present and Future, edited by R. J. Murname and K.-B. Liu, pp. 177–221, Columbia Univ. Press, New York.
Neu, U. (2008): Is recent hurricane activity normal? Nature, 451, E5 (21 February 2008)
Nyberg, J., B.A. Malmgren, A. Winter, M.R. Jury, K.H. Kilbourne & T.M. Quinn (2007): Low Atlantic hurricane activity in the 1970s and 1980s compared to the past 270 years. Nature, 447, 698-701.
Nyberg, J., B.A. Malmgren, A. Winter, M.R. Jury, K.H. Kilbourne & T.M. Quinn (2008): Reply to ‘Is recent hurricane activity normal?’ Nature, 451, E6 (21 February 2008)
For a fun look at paleotempestology in practice, go here: http://www.nytimes.com/2001/07/24/science/24HURR.html
Urs,
It is all good science but is it relevant? In the previous piece, you wrote that the North Atlantic had been chosen because it had the longest record, but the North Atlantic is not typical of hurricane basins. To its north is the Arctic Ocean which is covered in sea ice. The multi-year ice there has been melting and flowing back into the North Atlantic through the Fram Strait. This cold fresh water will have been preventing the sea surface temperatures in the North Atlantic from rising, in the same way as a melting lump of ice in a glass of water keeps the surface temperature at 0 C.
Thus expecting a change in hurricane activity due to rising sea surface temperatures (caused by global warming) may be a little premature in the North Atlantic.
This highlights a problem with the climate that seems to be ignored by scientists. The science is now so complicated, and with each aspect only discussed by experts that field, that no one is allowed or willing to take the broader view. Reductionism rules, and earth system science stagnates.
Re #1 — Andy:
An interesting article, but I think you may have missed another Cat 5 hurricane that made U.S. landfall in modern times i.e., Andrew in 1992. This brings up an interesting point that may have been commented on here before. During the 20th century 3 Cat 5 hurricanes made U.S landfall – the Labor Day Hurricane (1935), Camille (1969), and Andrew (1992). That suggests at least a multidecadal return period for Cat 5 hurricanes making North American landfall. But two such hurricanes – Felix and Dean – made landfall in Nicaragua and the Yucatan Peninsula in August 2007 (according to their Wikipedia pages…).
Sedimentological studies can provide local records of the frequency of intense hurricanes. When a strong hurricane strikes a coastline with sandy barrier islands, coarse deposits of sand and shell are washed into the lagoon behind the barrier island. The overwash deposits are easily distinquished from the more poorly sorted lagoonal sediments, and can be recovered through a technique called vibra-coring. These deposits contain materials that can be radiometrically dated, so a timeline of severe storms can be constructed. To date, these methods have been used to estimate the frequency of intense storms since sea level reached its current level and barrier islands stabilized. For example, a study by S. Knowles ( http://purl.fcla.edu/fcla/dl/SF00000099.pdf )shows four major storms striking Sarasota Bay, Florida, in the last 5,000 years. If conducted regionally, or grouped in a metastudy, the sedimentary record may provide information on the frequency of intense storms along the US Gulf and Atlantic coasts.
Would not the ratio chart show prejudices towards modern wx data collecting standards towards storm classification? Older storms were classifed by a combination of wind, pressure, and wave heights, while today, wind is the primary criteria.
Storm tracks seemed to show little penetration of strong hurricanes and typhoons ino the high latitudes during 2007 as compared to the previous four or five years.
the strongest Carribean storms of 2007 dissipated over the Yucutan before they had a chance o veer northward.
Does anyone here think this might be connected to the colder winters that have been reported in the NH so far this year?
When I used to live in New Mexico, tropical storm remnants -or more frequently moisture blown off of eastern Pacific tropical storms caught up the the North American monsoon was an important increment to the annual precipitation. I’ve heard that the isotopic composition of moisture from tropical weather is distinct. Perhaps there might exist some proxy signals in records of the southwest monsoon?
One source of storm records that doesn’t seem to have been utilised is the records kept by the Royal and other navies. The ships of navies kept pretty detailed records of the weather and between them will have substantial coverage of the world’s oceans. Of course, going through the records might be a trifle daunting, but I think that a lot of the necessary collation will have already been done.
Anyway, just a suggestion.
Don’t know why
There’s no sun up in the sky,
Stormy weather…
Thomas – people did look into trying to get a record of those oxygen isotope changes by looking at tree rings. However, the coverage isn’t comprehensive so you can’t really use it to get a record of Atlantic basin hurricane activity (offshore hurricanes don’t register), just the history of that particular tree.
See PNAS Miller et. al 2006 for the paper.
A previous post on this on RC discussed this:
.
Regarding comment #3. Andy Revkin’s article does refer to Hurricane Andrew,but Dr. Landsea describes it as a category 4 storm. The fact that he can’t answer whether it has a 1.0 % or 0.5% or 0.1% chance of occurrence shows how far we need to go in categorizing and understanding the recurrence interval of these very severe storms.
Going back to comment #6 it is often mentioned that El Nino leads to greater wind shear reducing hurricane activity in the Atlantic Basin. This past hurricane season a La Nina was building, that has in part been the cause of the cool winter in the west. However, over the Gulf of Mexico and Caribbean looking at the daily satellite imagery with my classes it seemed that Wind shear was high as La Nina built this year. Is this usual when there significantly changing conditions in the tropical pacific? It was also evident the wind shear was reduced at the southern edge of the hurricane formation zone, which is where the Category 5’s formed.
Talking about El Nino and atlantic hurricane activity.
If in the habit of checking global sea surface temperature maps daily, it is nearly impossible to not notice that El Nino conditions(high sst’s and episodes of trade wind reversals) in the central pacific does not rule out the possibility of cold anomalies dominating the east for months to come. Current sst’s looks like 2/3 La Nina and 1/3 El Nino, with the el nino part closest to the Atlantic. Is this unusual ?
Re: 11. Haven’t read the Landsea et al. 2004 paper in the Bulletin of the AMS, but the National Hurricane Center’s web page for Hurricane Andrew (http://www.nhc.noaa.gov/1992andrew_add.html), in referring to that paper, seems to suggest they concluded it was a Cat 5:
” In particular, Hurricane Andrew is now indicated to have made landfall on the lower Florida east coast with Category 5 intensity on the Saffir-Simpson Hurricane Scale.”
Apparently there’s a news clearing house for crap like it’s the Sun and so on.
http://icecap.us/index.php/go/about-us
They just keep popping up to meet the need for denial. So sad.
> CECAP is not funded by large corporations that might
> benefit from the status quo but by private investors
Private investors? How do you “invest” in something like this?
The website that post 15 points to is full of the most ridiculous denialist drivel. Having a post on RealClimate linked to it just helps to promote it up the search engine rank.
Looks to me like the usual suspects making the usual misinformed/disinformed arguments and preying on the same ignorant fools as ever. Makes me wonder if any of these guys have ever cracked even an IPCC executive summary.
Hank, I think the “investment” could pay off quite handily, as long as you aren’t too particular about where the money came from.
Craig, /view source, note the attribute (rel=”nofollow”).
Sorry for the digression.
RE #16, perhaps these investors have invested in seashore land near the Atlantic or Gulf of Mexico at top dollar, and they’d like to see their land value increase. The idea we may be facing increasing hurricanes, sea rise, and sea surges would be very bad news to them (on top of the real estate slump and all), so simply deny it and get others to believe them….at least long enough to sell their investments (once the real estate slump is over) at very high profit.
Well Craig RC notes these sort of places all the time. I hadn’t seen this one before. Somebody dropped it on me in a diatribe yesterday. Same players out with a new false front of legitimacy. I think exposing it for what it is has value. The global warming test recycled from that old West Virginia site is telling too. Every denier uses this same stuff. It never goes away.
Hello realClimate,
please “debunk” these http://www.dailytech.com/Temperature+Monitors+Report+Worldwide+Global+Cooling/article10866.htm
http://digg.com/environment/Temperature_Monitors_Report_Massive_Global_Cooling
Thank you for all your hard work!
Best Wishes,
Laura
Well, maybe we soon will see something like this:
Twelve-hour long drop in temperatures overwhelms a century of warming
Over the past half day, anecdotal evidence for a cooling planet has exploded. Switzerland has had its coldest night for weeks, Munich has experienced frozen fountains, several rats perished by cold in Rome, numerous cars crashed because of heavy snowfalls in the streets of London – the list goes on and on.
The total amount of cooling in all these places over the last twelve hours ranges from 10C up to 15C, a value largely overwhelming all the warming recorded over the past 100 years. All in twelve hours time.
Scientists quoted in a past DailyTech article link the cooling to reduced solar activity which they claim is a much larger driver of climate change than man-made greenhouse gases. The dramatic cooling seen in just twelve hours time seems to bear that out. This demonstrates that more powerful factors are now cooling the Earth.
Upshot: The quoted scientists would be right: It was the sun…
Re #22 “Please debunk these”.
Have patience, time will debunk them :-(
More seriously:
Such a temperature drop is not unusual for a change from El Niño to La Niña conditions. From February 1998 to November 2000 you find a temperature drop of 0.597 C in the same dataset. Nothing new in the world. And there is always natural variability (on multiple timescales) overlayed which can strengthen or weaken the ENSO influence.
Laura (22) — See
http://tamino.wordpress.com/2007/12/16/wiggles/
http://tamino.wordpress.com/2007/08/31/garbage-is-forever/
http://tamino.wordpress.com/2008/01/09/dead-heat/
http://tamino.wordpress.com/2008/01/24/giss-ncdc-hadcru/
for a thorough analysis of the temperatures for the past several years.
RE #23, I saw an article about skeptics getting gleeful over the cold snap on ClimateArk: http://www.climateark.org/shared/reader/welcome.aspx?linkid=93551
My thinking — aside from it getting warmer elsewhere & it’s the average that’s important, or one cold snap does not a cooling trend make, or it’s pretty hot where I live in S. Texas (hotter than most winters, I believe) — could this be an indication of the ocean conveyor or thermohaline current slowing down?? I also read recently that while scientists think this unlikely in the near future, they have not ruled it out in the more distant future. But like nearly everything else about GW, scientists may be underestimating this (due to their necessary (to protect their reputations) focus on avoiding false positives).
Also I have a theory that there will be more wild swings in local temps, a greater day to day variance, even along side a warming trend & a lower average variance between night and day temps (this is just based on a not-so-educated guess).
Hi again,
hmm i think this is flickering – small and big fluctuations. Something liek positive feedbacks. At least this is how i interpret it when i think about it. Well ok i read now the above suggested links. To bad im really busy atm with my stupid HP scanner :D
Cheers
Lynn Vincentnathan (27) — The weather this winter is thought to be due to a strong La Nina combined with a prolonged solar minimum.
Not attributed to anything to do with climate change.
Lynn: Clearly this is a case of changing baselines. I imagine in 50 years if they get any substantial snowfall at all in Chicago it will make the news and some old crotchity fellas will mumble about how they were right all along to deny the earth is warming. Has it been that cold this winter? Compared to say the 1970’s? I know in the Lodgepole Pine forests of the western U.S. they are still waiting for those two weeks of -40f night temps that used to keep pine beetles in check. Has the artic ocean refrozen to a depth of 3 meters or more? How about in our neck of the woods. I think the last time Galveston had freezing temps was in 1990 or thereabouts. I have an 1870 map of Galveston Bay with a hand written note on the back, “bay frozen today with 5″ of slush”. Could you imagine that happening today? Do you remember the 3 days of below freezing daytime temps in 1989 that Corpus Christi experienced? I suppose if that happened this year Rush Limbaugh would do a live broadcast proclaiming global warming has stopped. Was that really so long ago? It seems like a different world today doesn’t it? How could things be changing so rapidly and people not stand up and scream. Are humans really that short of memory when it comes to the natural world? As for me and my banana tree; we’re doing just fine this winter up here near Houston.
I hear you Andrew. Up here in Washington State, we had a tornado in January and days of temps in the upper 50s/lo 60s in february. I’ve seen hummingbirds buzzing around throughout the winter looking really healthy so far.
I lived in Chicago in the 70’s and now I live in Grand Rapids, Michigan (which doesn’t get as cold as Chicago, but we get tons and tons of snow-it’s phenomenal really). Whle this year has been more snowy than the last several in GR, we didn’t get more snow than winters 7-8 years ago. And Chicago got a lot MORE snow in the 70’s and the winters were a lot colder then than they are now. Although I have been complaining about this winter to anyone who will listen, it is mild compared to the ones I remember from 30 years ago in Chicago, for sure.
Gavin
completely off topic – but can you give me the URL link to a paper on which you were a co-author.
I can’t remember the title but I think you modelled the temperature change between late 17th (maunder min) and late 18th century – 1680 to 1780 if I recall.
Thanks in anticipation.
[Response: Shindell et al, 2001 and 2003. Also Schmidt et al, 2004 which was more of a review. – gavin]
Urs Neu —
Thanks for the fake denialist essay. That was hilarious. Can I quote you?
-BPL
For the record, Anna’s hummingbirds are winter residents in WA/OR, so seeing healthy hummers buzzing around during winter is not a big deal. Unless you’re seeing rufous or (in the drier part of the state) black-chinned etc. Now that would be interesting …
Re 34
Barton – no problem.
Philippe, hummingbirds —
Please notice which and report the arrival of the migrant species in your area: http://www.learner.org/jnorth/humm/index.html
I just looked them up, Dhogaza and you’re right. I am pretty sure they are the normal winter residents, so nothing new there. I guess they just seemed exotic to me for having seen hummingbirds mainly in Africa and Southern US before. The little buzzers are also hard to identify. Bu thanks to you and Hank for the tips.
Philippe, you’re not the first person to be surprised to learn that we have winter resident hummers in the PNW.
Though they don’t winter anywhere near OR/WA, rufous hummingbirds are expanding their wintering range northward, as far east and north as Alabama (their historical wintering range has been mostly mexico with some in the southwest US). Is this related to global warming? We don’t know, but a large number of species are expanding their ranges northward, so we certainly can’t rule it out (pitiful attempt to stay on-topic, see?)
However, as far as I know, no hummingbird as of yet has expanded its range to AFRICA :) Might I humbly suggest you need a better pair of binoculars? Or a more accurate bird book?
Any comments on this news release from NOAA?
Subject: NOAA: Increased Hurricane Losses Due to More People, Wealth Along Coastlines, Not Stronger Storms
FOR IMMEDIATE RELEASE – February 21, 2008*** NEWS FROM NOAA ***
NATIONAL OCEANIC & ATMOSPHERIC ADMINISTRATION U. S. DEPARTMENT OF COMMERCE WASHINGTON, DC
Contact: Dennis Feltgen, NOAA 305-229-4404Increased Hurricane Losses Due to More People,
Wealth Along Coastlines, Not Stronger Storms, New Study Says
A team of scientists have found that the economic damages from hurricanes have increased in the U.S. over time due to greater population, infrastructure, and wealth on the U.S. coastlines, and not to any spike in the number or intensity of hurricanes.
“We found that although some decades were quieter and less damaging in the U.S. and others had more land-falling hurricanes and more damage, the economic costs of land-falling hurricanes have steadily increased over time,” said Chris Landsea, one of the researchers as well as the science and operations officer at NOAA’s National Hurricane Center in Miami. “There is nothing in the U.S. hurricane damage record that indicates global warming has caused a significant increase in destruction along our coasts.”
Link to paper:
http://sciencepolicy.colorado.edu/admin/publication_files/resource-2476-2008.02.pdf
Gary (40) — NOAA has it mostly right, IMO. The paper appears not to have directly considered loss of barrier formations, islands and wetlands.
RE #40 — If true, then this means we have only worse to expect in the future. If anyone thought Katrina was bad, just wait until GW really kicks in!
RE the coldsnap deniers, they also point out extreme increase of snowfall. But isn’t that what’s predicted in a GW world? GW increases water vapor retention in the atmosphere, which comes down as severe precipitation events, ususally rain, but if the weather gets colder (in its usual seasonal and daily fluctuations between warmer and colder temps), that could mean extreme snow events.
So again, the denialists have proven GW as a done deal fact. At this rate of success, the denialists will soon have proven the thermohaline ocean conveyor has shut down….maybe by next year.
re: 40. As a meteorologist, I think that is quite a misleading statement and somewhat of a red-herring by Landsea. Most published, peer-reviewed trend studies on hurricanes focus on the number and/or intensity of the storms, not on economic damage or destruction due to only land-falling storms. By focusing on land-falling storms, he is only considering a small subset of storms. There is no question that the coastal area growth and population have grown exponentially along over the past four or five decades.
Re 40
A few comments to the Pielke et al. paper.
First comment: The authors mention a couple of factors they could not include in the analyses. One is building standards. They argue, that stronger building codes only have been introduced recently and therefore would not influence the result. However, building standards also can change without codes over time. I am not economist, but I suppose that building quality might have to do something with wealth, since more solid building is more expensive. This would suggest, that with increasing wealth building quality might have improved, which would decrease losses today.
A second point is warning. The possibilities to warn people against coming hurricanes have improved over time without doubt. I do not know what possibilities people really have to reduce damage costs if they are warned early enough (maybe a reader living at the U.S. coast could help), but I am not sure that it is negligible. Both factors, when not accounted for, lead to an overestimate of past damages in the author’s normalizations.
Third point: Losses very strongly depend on where the storm hits land. If Katrina would not have hit New Orleans, but hit land somewhere to the east or west, damages would have been drastically lower. Same thing with the hurricane that hit Miami. If it would have hit land at a less dense populated area, damages would have been much less. Considering the relatively small sample (only around 150 storms), an artificial trend in the very noisy distribution of population density in landfall locations might be significant and should be investigated. It might either lead to an artificial negative or positive bias in the trend.
Second comment: As the authors mention, there is no significant trend in the geophysical data (hurricane frequency and intensity on U.S. landfalls). So why should we expect an increase in losses due to changes in the geophysical data? If there isn’t an influence of climate change on geophysical data, why to go a long way round an analyse loss data to show that there is no trend?
Third comment: Basically, there are a couple of problems with statistics of extreme events. Changes in extreme events, which are rare by definition, must be enormous until it is possible to detect statistically significant trends. As Frei and Schär (J. Climate, 14, 1568–1584) have shown, a frequency change by a factor of 1.5 can be detected with a probability of only 0.2 for events with an average return period of 100 days. For the U.S. hurricane landalls (about 150 events in 100 years), the return period is more than 200 years, which further lowers the detection probability. Thus we have a very low probability to detect even a 50% increase in U.S. landfalls over the last century. If we look at losses, the above mentioned noise of population density at landfall location adds up and further decreases detection probability. Moreover, there are less than 20 events which account for more than half of the losses. To detect a trend in such a small number is extremly unlikely, even if the frequency has doubled. Thus, the probability to detect any climate change related trends in loss statistics belongs to the category hopeless.
I was recently searching for some information on the “State of the Weather” in the Southern Hemisphere the other day and was unsuccessful in finding general information. I did just come across an article in this blog someone posted an article were they mention that Australia has seen it’s warmest January on record.Does anyone know of any information about what’s going on in the Southern Hemisphere? Are they experiencing extreme weather as well???
I had to make this comment as well since everyone is OT anyways: We got a snowstorm here the other day in Albany NY, i’m sure most of you are aware of the big storm that dropped heavy snow and caused sever storms in FL at the same time. What absolutely blew my mind were the size of the snowflakes. At one point, they were almost magical, like in a fantasy… I had to go outside and experience it. I bundled up and went outside. I was wearing a black polo fleece that was a perfect backdrop for the snowflakes. When I tell you the diameter of these snowflakes were at least equal to that of a large plum, I’m not joking. they were HUGE. My camera wouldn’t work for me, because I was dumbfounded. I called it GW Snow… it was there was so much moisture in the Atmosphere the snowflakes could grow bigger and bigger. They were so big. i was covered in snow within a minute. Never seen anything like it, and living in Albany NY, I’ve seen lots of snow storms, although, before this year, the winters have been exrremely warm/mild, and snowless. Rainy, yes, but not really snowy.
Re: posts 15 & 16,
On a different forum where I post in favour of AGW, the denialists brought up ICECAP. I chose to examine who their ‘experts’ were. The ones whose names I’d seen before are (working down the list):-
Sallie Baliunas
Reid Bryson
Robert Carter
Idso Bros.
……
See if you can predict some more denialists with surnames beginning with later alphabet letters who might be on the list …….
Gavin
Re: #33 links to papers
Thanks a lot.
[Note: This comment was posted to the wrong thread–it has been relocated here (w/ a response)]
Robert Bauserman Says:
28 February 2008 at 1:49 PM
I am a bit confused about the difference in how the two proxies correlate with storm frequency. You write:
…the coral proxies show a positive correlation to wind shear over the MDR, but a negative correlation north of it. …The sediment proxy shows a positive correlation to wind shear over the MDR and no correlation north of it.
So how do we get from this to the statement that the two proxies are corrleated to wind shear in opposite directions? If both of them are positively correlated to wind shear over the MDR, and outside of the MDR one is negatively correlated and the other uncorrelated, I fail to see the difference in the direction of the relationship. Help me out here! (And yes, I have studied statistics). What am I missing?
[Response: Oops…, you are right. There is an erroneous inversion in the text on the coral proxies (it’s obvious from Fig. 2 in Nyberg et al.). Thanks!… fixed. -Urs]
Hey All;
Sorry to interject an idea not on topic. Being as I was raise near the “affected” region one of the measures we consider in regards to TCs were the “Treasure Ships”. Most of the dates of the wrecks are well documented and though they in themselves may not specify the count they may provide some insight to possible intensity. There is also the character of how many of these ships were stabilized during the storms. Rather then journey out to deep waters away from land many of the Captains would attempt to get close to the Leeward side of a land form and anchor out with at least one hook on the land form as a type of lifeline in the event of disaster.
Other incidental considerations may related to the amount of erosion over time since the land hooks were dropped. As a general rule the intent was to walk the anchor a few hundred feet onto land. (A notable example is a wreck off Melbourne Beach FL. in that the land hook was found on the shoreline in 1962. Given that most replenishment activities did not begin until after this time it would suggest that the original shore line had to be a few hundred feet out into the surf at the time of the wreck.) With the rate of erosion in this region being less then 1 foot per decade on average, and generally subject to hundred year storms, this region seldom received the full brunt of TC conditions, these types of measures may help add to the proxy data quality.
Dave Cooke