There has been a veritable deluge of new papers this month related to recent trends in surface temperature. There are analyses of the CMIP5 ensemble, new model runs, analyses of complementary observational data, attempts at reconciliation all the way to commentaries on how the topic has been covered in the media and on twitter. We will attempt to bring the highlights together here. As background, it is worth reading our previous discussions, along with pieces by Simon Donner and Tamino to help put in context what is being discussed here.
The papers and commentaries address multiple aspects of recent trends: the climate drivers over recent decades, the internal variability of the system, new analyses and model-observation comparisons – much as we suggested would be the case in any discussions of model-observations mismatches last year. We will take each in turn:
Climate drivers
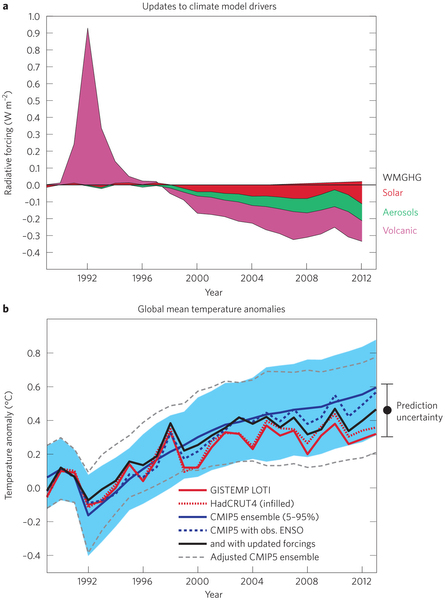 Two papers (which I was an author on) are focussed mainly on examining the impact of updated forcings on the temperature: Santer et al (2014) ($) looks in detail at the impact of small volcanoes post-2000 on the vertical structure of temperature changes, while the commentary by Schmidt et al (2014) (OA, with registration) also updates the solar, aerosol and GHG forcing to estimate what the CMIP5 ensemble would have looked like if it had used this input data instead of the earlier estimates and initial forecasts (panel b in the figure).
Internal Variability
The contribution of internal variability to decadal trends is the focus of commentaries by Lisa Goddard (OA) and Martin Visbeck (OA). They focus on recent trends in ocean heat uptake, the Pacific Decadal Oscillation and the potential for initialised decadal predictions (such as Keenlyside et al) to capture these variations. These relate to both the earlier Kosaka and Xie and England et al papers, but are mostly reviews.
[Update: See also the Clement and DeNezio perspective in Science.]
New analyses
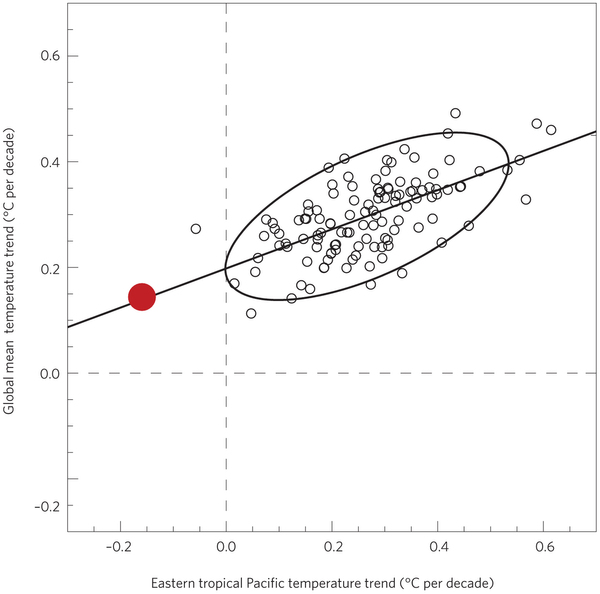 Following on from Kosaka and Xie, Fyfe and Gillett (2014) ($) show that the trends in the Eastern Pacific (1993-2012) are well outside the spread in the CMIP5 ensemble (see figure on right). This is consistent with England et al results, and yet it is unclear to what extent mis-specifications in the forcing might have affected it. For instance, if the updates to volcanic forcings from Vernier et al and used in the Santer and Schmidt papers are correct, trends from 1993 (at the maximum post-Pinatubo cooling) will be too large.
As the Nature Geoscience editorial emphasizes, there is more to climate change than the global mean temperature anomaly, and the paper by Seneviratne et al ($) shows that trends in extreme temperatures over land have continued apace throughout this time period.
Media, outreach and editorial response
Finally, there are some commentaries that look at the impact these questions have had on the wider public discussion: Hawkins et al (OA, including Twitter stalwarts Tamsin Edwards and Doug McNeall) discuss the opportunities that interest in recent trends gives scientists to discuss science on social media (also blogged about here), while Max Boykoff (OA) focuses on the framing of the issue in traditional media. Both Nature Clim. Chg. (OA) and Nature Geoscience (OA) have interesting editorials.
Overall, this is a great set of overviews of the issues – observations, comparisons, and modelling – and leads to some very specific directions for future research. There is unlikely to be any pause in that.
References
- B.D. Santer, C. Bonfils, J.F. Painter, M.D. Zelinka, C. Mears, S. Solomon, G.A. Schmidt, J.C. Fyfe, J.N.S. Cole, L. Nazarenko, K.E. Taylor, and F.J. Wentz, "Volcanic contribution to decadal changes in tropospheric temperature", Nature Geoscience, vol. 7, pp. 185-189, 2014. http://dx.doi.org/10.1038/ngeo2098
- G.A. Schmidt, D.T. Shindell, and K. Tsigaridis, "Reconciling warming trends", Nature Geoscience, vol. 7, pp. 158-160, 2014. http://dx.doi.org/10.1038/ngeo2105
- L. Goddard, "Heat hide and seek", Nature Climate Change, vol. 4, pp. 158-161, 2014. http://dx.doi.org/10.1038/nclimate2155
- M. Visbeck, "Bumpy path to a warmer world", Nature Geoscience, vol. 7, pp. 160-161, 2014. http://dx.doi.org/10.1038/ngeo2104
- A. Clement, and P. DiNezio, "The Tropical Pacific Ocean—Back in the Driver's Seat?", Science, vol. 343, pp. 976-978, 2014. http://dx.doi.org/10.1126/science.1248115
- J.C. Fyfe, and N.P. Gillett, "Recent observed and simulated warming", Nature Climate Change, vol. 4, pp. 150-151, 2014. http://dx.doi.org/10.1038/nclimate2111
- "Hiatus in context", Nature Geoscience, vol. 7, pp. 157-157, 2014. http://dx.doi.org/10.1038/ngeo2116
- S.I. Seneviratne, M.G. Donat, B. Mueller, and L.V. Alexander, "No pause in the increase of hot temperature extremes", Nature Climate Change, vol. 4, pp. 161-163, 2014. http://dx.doi.org/10.1038/nclimate2145
- E. Hawkins, T. Edwards, and D. McNeall, "Pause for thought", Nature Climate Change, vol. 4, pp. 154-156, 2014. http://dx.doi.org/10.1038/nclimate2150
- M.T. Boykoff, "Media discourse on the climate slowdown", Nature Climate Change, vol. 4, pp. 156-158, 2014. http://dx.doi.org/10.1038/nclimate2156
- "Scientist communicators", Nature Climate Change, vol. 4, pp. 149-149, 2014. http://dx.doi.org/10.1038/nclimate2167
Shouldn’t it be “It never rains but it pauses”?
[Response: No. But if I need to explain a pun, then it is probably not going to work for you. – gavin]
Perhaps the ($) placeholders should be deleted.
Steve
Re: 1, I thought I might be missing something. That’s what happens when you multi-task.
OK, groaner time.
Appreciate informative summary. FYI, hyperlink to Nature Geoscience editorial does not work – at least not for me.
It’s more than a little concerning that the last decade has had all these extreme events that well carry on, despite the hiatus.
One question out of curiosity, not scepticism: there was no talk of a hiatus even 2-3 years ago. Why has it taken 15 years for us to figure we are experiencing a hiatus?
in solidarity,
Nagraj Adve
New Delhi
It appears as if the hiatus is the sum of the response of Earth dynamic climate system – negative feedbacks driven by internal variability. And there are slow negative feedbacks (Ocean currents) and fast negative feedbacks (Volcanoes), but response depends on the forcing and could switch mode from negative to positive feedback (i.e. La Nina -> El Nino).
Nagraj Adve, see for example An imperative for climate change planning: tracking Earth’s
global energy (Trenberth 2009)
It’s gratifying to see reviews characterizing the supposed hiatus as a combination of the varied explanations, and not as a contest between competing explanations. It’s still the real world out there, and there are always many more things than one going on at once.
The mismatch in forcing datasets identified in the Nature Geoscience papers seems like a real problem for the scenarios. Wouldn’t it make sense to include either (a) a steady non-zero background volcanic aerosol forcing, or (b) a stochastic volcano timeseries whose integral matched the 20th century volcanic emissions applied randomly to each ensemble member, in future scenarios for the next CMIP? Obviously we can’t know what the future volcanic emissions are like, but zero volcanoes would seem to be a pretty extreme assumption, and this would avoid the discontinuity between a historical record that includes volcanoes versus a future that has no volcanoes. At a minimum couldn’t there be some sort of RCP4.5V that includes such a volcanic forcing to compare to the standard RCP4.5?
Nagraj Adve @6
‘Slowdowns’ and ‘accelerations’ due to natural variability have always existed, both in global temperature records and in individual model runs, and scientists have always been very well aware of them. However, they didn’t show up in published projections, which were of course based on the average of model run ensembles and so smoothed them out. The media—and of course ‘sceptics’—picked up on the so called ‘hiatus’ when it appeared that the global temperature record was diverging downwards away from the projections. And at that point the scientists had to explain what to them was very obvious. To put this in context, it should be noted that leading up to 1998 another noticeable divergence away from the projections had occurred: this time in the other direction as temps rose ahead of the models. Not unsurprisingly, sceptics didn’t make a big deal of this.
So if there was an error it was that scientists hadn’t explained the facts in sufficient simplicity to take the public along with them. Well that’s what I as a lay person put it down to. I’m sure Gavin or someone with more knowledge will put me right if I’m wrong.
charlie:
Jonathan Gregory discussed similar thoughts back in 2010:
http://onlinelibrary.wiley.com/doi/10.1029/2010GL045507/full
cheers,
Ed.
The pause conundrum came about because of the public’s need for an intuitive and familiar measure of warming. This measure turned out to be that of surface temperature. If instead, we had used an aggregate energy measure such as retained free energy, we wouldn’t have this argument. The free energy would include temperature+heat capacity, kinetic energy, latent energy, and potential energy, that would have evened out the fluctuations that we are seeing.
Alas, it will take a long time to slow down the inertia of using temperature.
Hiatus discussions may become very pointless in the next 2 years if we get a moderate to strong El Nino. Although someone could have said the same thing in 09/10.
Thanks to SkS for this link:
http://www.cpc.ncep.noaa.gov/products/analysis_monitoring/lanina/enso_evolution-status-fcsts-web.pdf
“How scientists, media and the public see the surface warming ‘pause’”
“A prestigious journal has released a special issue on what’s become something of a preoccupation in the crossover between science and mainstream media recently – an apparent slowdown in surface warming over the last decade or so.
Nature Climate Change dedicates a whole issue to the so called ‘pause’ – looking at how scientists, the public and the media have been talking about it.
The issue talks a lot about lessons for scientists in engaging with the media, but is it worth so much soul-searching when evidence suggests the ‘pause’ has barely made a ripple in the public consciousness?”
note: both ”time” magazine and ”nytimes” are poised to deliver big ”cli fi” novels and movies news stories this month of ”march” 2014. cl fi is new genre for climate fiction novels and movies, from sci fi to cli fi, google it. I don’t know the NYT reporter’s timeline, or which section the story might
appear in, and I believe he visited the cli fi lit class of a professor in
california and spoke with quite a few other people. His topic is
”climate change education”. I assumed he might have talked with some of you here too!
Gavin, is there anyone in your department considering adjusting models to contain feedbacks,(pos or neg) that were previously ommitted?
If the models fail to follow observed trends, its not the science that has failed, just the models.
Could be time to re think the feedbacks.
[Response: Feedbacks are emergent properties from the models and so are diagnostic, not input. We are rethinking processes all the time in order to better represent the real world, but as yet, they have not much changed the main feedbacks. In any case, it would not be possible to ‘fix’ feedbacks to change responses just for one decade without changing responses in all other metrics. – gavin ]
Excellent summary at Nature Geosc. Gavin, even if I still can’t see any “pause“, however I look at it. You correctly separate “pause” and CMIP5 miss-fit. I wonder how many others manage to.
Steve @#2: That was a snark after Peter @#1, right?
For an updates on the Meehl Surface Records Study that I started see Dr. Jeff Master’s blog posted on 3/4/14 at:
http://www.wunderground.com/blog/JeffMasters/comment.html?entrynum=2641#commenttop
Indeed, for the uniformed public the “hiatus” in warming across the central and eastern U.S. has been very stark this winter. Global warming is the furthest thing on a cabby’s mind in cities like Chicago or New York.
For the uneducated climate change denialist…the hiatus in warming can only fuel arguments to further delay mitigation efforts leading
to even more dire consequences in the future.
P.S. It’s almost certain that the CO2 measurements coming from Mauna Loa will be above 400 ppm when the February report is made in a few days.
Gavin,
On the climate driver updates plot most of the negative difference in volcanic forcing appears to occur prior to 2000, whereas most papers discussing the impact of small volcanic eruptions have focussed on the period since 2000. Is this pre-2000 discrepancy part of the Pinatubo reassessment?
[Response: yes. – gavin]
Hi:-). I’m just a lay person who like to look at historical temperature graphs. If that 30 year warming-cooling pattern is real, we could expect a pause until 2030 or so, not? And further, the temperature increase from one 60-year peak to the next 60-year peak:
1880-1940 is ca 0,7 F
1940-2000 is ca 0,8 F
so following the pattern
2000-2060 may see an increase of ca 0,9-1,0 F
then the temp increase from 1880 to 2060 might be around 2,4 F or 1,4 C
What indicates and worries that it may be higher, is that the cooling period at the moment, isn’t really getting colder. Anyway, we will probably not know much about the real upwards trend, independent of internal variablity, until it starts warming again after 2030. Just my thinking :-)
Guy Walton – I take it you haven’t been following the weekly updates? February’s measurements barely show any increase over January: http://www.esrl.noaa.gov/gmd/ccgg/trends/weekly.html
It’s being a tease.
Re- Comment by GlenFergus — 5 Mar 2014 @ 3:18 AM, ~#18
Glen, no it is not snark but an attempt to provide a minor copy edit suggestion for the original post. I should have been more explicit. Note under the “Climate drivers” heading the first Santer reference has “($)” after it. There are several of these. My assumption was that Gavin was putting this symbol in as a placeholder for a reference number that would be filled in after the piece was finished. I used to do this. Gavin may have decided to not use numbers at all and forgot to remove the placeholders. Or maybe not.
Steve
Gavin, in your response to Alan Bryant you wrote “Feedbacks are emergent properties from the models and so are diagnostic, not input. We are rethinking processes all the time”
I think the word “feedback” gets confusing because the engineers, and the ecologists, use the word to mean something different than you do in climate modeling.
Amateur questions follow, if/when you or any other climate scientists have time to comment:
When and how do climate modelers incorporate changes in what we know about biology? How much difference does it make that we’re on a living planet? Do you call those processes, or feedbacks? Does a ‘whole new model’ need to be produced for these, or are they somehow incorporated from time to time?
I’m thinking about what’s known from paleo records — the expansion of plankton from coastal forms to deep-sea forms, for example, changed the climate, but I don’t know if the models deal with that.
For example (I can only see the abstract):
http://www.nature.com/nature/journal/v504/n7478/full/nature12857.html
The changing carbon cycle of the coastal ocean
Nature 504, 61–70 (05 December 2013)
doi:10.1038/nature12857
and this suggests an immediate concern on our short time scale:
http://www.plosone.org/article/info%3Adoi%2F10.1371%2Fjournal.pone.0084857#pone-0084857-g014
Cenozoic Planktonic Marine Diatom Diversity and Correlation to Climate Change
David Lazarus, John Barron, Johan Renaudie, Patrick Diver, Andreas Türke
Published: January 22, 2014
DOI: 10.1371/journal.pone.0084857
I notice that even 15 years ago, Chinese air pollution was reducing photosynthesis to a worrisome degree:
http://www.pnas.org/content/96/24/13626.short
Case study of the effects of atmospheric aerosols and regional haze on agriculture: An opportunity to enhance crop yields in China through emission controls?
November 23, 1999, vol. 96 no. 24
It’s gotten much worse:
https://www.sciencedirect.com/science/article/pii/S0959652613007075?np=y
Industrial SO2 pollution and agricultural losses in China: evidence from heavy air polluters
Is the effect of aerosols on climate harder to detect than the effect on photosynthesis?
How much difference has that been making downwind, in photosynthesis and generation of cloud-forming nuclei by biological activity in marine surface layers, over the same time span?
The “$” is to indicate that the article is behind a paywall. “OA” means open access.
Re- Comment by Steven Sullivan — 5 Mar 2014 @ 7:35 PM
Thanks. I should have been able to figure that out, but I didn’t.
Steve
I think the pun requires a non-rhotic accent. To speakers of standard American English it’s rather opaque.
It only requires that accent if you are trying to force it – it’s a pun! I think it’s actually more funny as it invokes the non-rhotic “bostonian” sound – I’d add this was a visual pun – i’m scanning realclimate and chuckled when I saw the heading before I had time to really analyze whether the pun was properly constructed.
JB’s 1st rule of humor: If it makes you laugh it’s funny
If you needed the pun explained, it probably isn’t funny any more. Good one though.
To an Englishman the pun works perfectly. :-)
[Response: Of course. :-) – gavin]
link for 1st reference above
https://xa.yimg.com/kq/groups/18383638/406182470/name/ngeo2098.pdf
Whatsa matta youse guys? I appreciated the pun right away.
The pun also works well for anyone living in the American South–however rhotic (or a-rhotic!) they may personally be.
This set of data only points to the fact that climate is changing and changing fast. It’s no more a myth. There’s substantial evidence on hand regarding it. This collection of analysis can be really helpful in designing the right policy in an environment of confusion among various researchers. There’s a talk going on regarding Geoengineering. These trends may clear the air a bit regarding that.
I have produced a blog that draws a link between the NASA forecast of an El Nino and the flooding of the low lying Marshall Islands.http://www.climateoutcome.kiwi.nz/temperature.html
Bob – El Nino causes sea level to fall dramatically in the western Pacific. See this rebuttal on Tuvalu sea level I wrote for Skeptical Science. Majuro, the capital, is shown in Figure 4. The strengthening trade winds since the early 1990’s have contributed to this greater-than-average sea level rise in the tropical western Pacific, however this trend will decline when the Interdecadal Pacific Oscillation switches to its positive (El Nino-dominant) phase in the near-future.
As for El Nino, yes still looks very likely. The formation of tropical lows in the Western Pacific seem to be strengthening the westerly winds bursts so that big blob of subsurface heat in the equatorial ocean could begin to surface and shutdown the upwelling of deep cold water in the eastern Pacific. Time will tell.
So what are the current best estimates of the range of temperature that aerosols are ‘hiding’ from the current warming? IIRC, it used to be something like .5 to 2 degrees C. Is it now below 1 degree?
Given the situation in CA, this old musical version of the saying seems particularly apt: http://www.youtube.com/watch?v=-pyC7WnvLT4
In new paper explores SLR rates and the pause, The Rate of Sea-Level Rise
a rain’s slow journey
oceans swell in hiatus
divergent misleads