Every so often people who are determined to prove a particular point will come up with a new way to demonstrate it. This new methodology can initially seem compelling, but if the conclusion is at odds with other more standard ways of looking at the same question, further investigation can often reveal some hidden dependencies or non-robustness. And so it is with the new graph being cited purporting to show that the models are an “abject” failure.
The figure in question was first revealed in Michaels’ recent testimony to Congress:
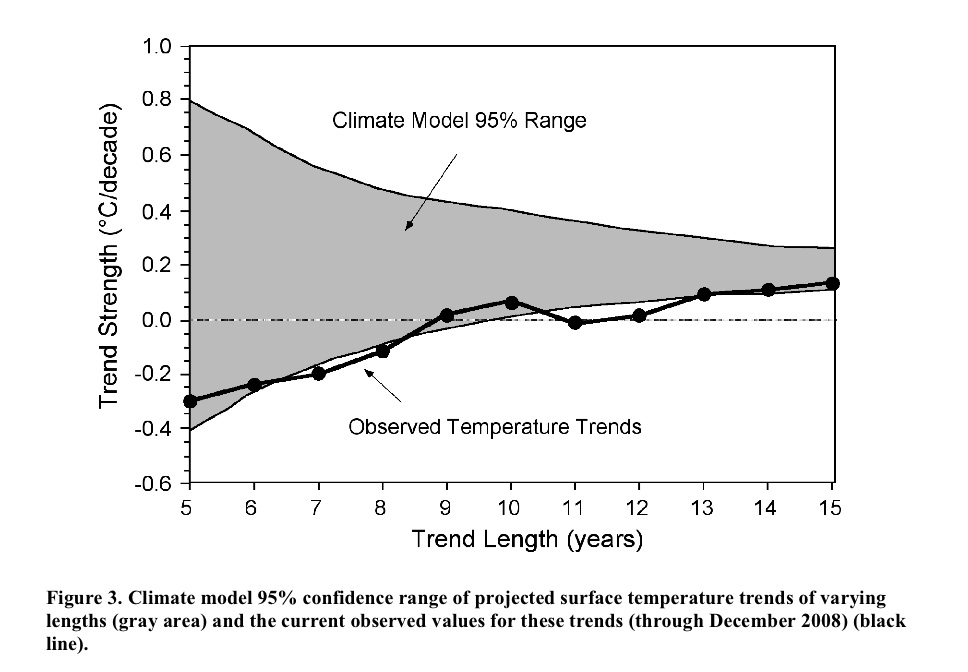
The idea is that you calculate the trends in the observations to 2008 starting in 2003, 2002, 2001…. etc, and compare that to the model projections for the same period. Nothing wrong with this in principle. However, while it initially looks like each of the points is bolstering the case that the real world seems to be tracking the lower edge of the model curve, these points are not all independent. For short trends, there is significant impact from the end points, and since each trend ends on the same point (2008), an outlier there can skew all the points significantly. An obvious question then is how does this picture change year by year? or if you use a different data set for the temperatures? or what might it look like in a year’s time? Fortunately, this is not rocket science, and so the answers can be swiftly revealed.
First off, this is what you would have got if you’d done this last year:
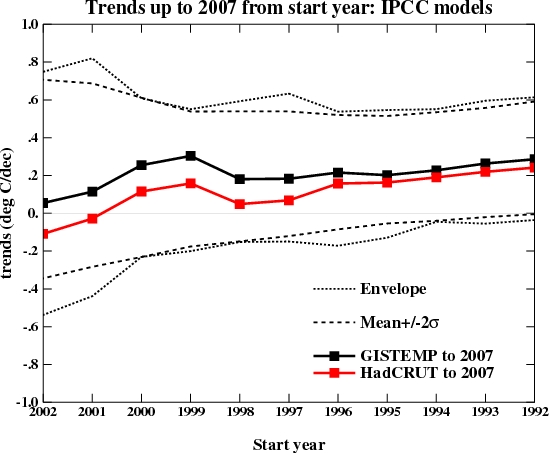
which might explain why it never came up before. I’ve plotted both the envelope of all the model runs I’m using and 2 standard deviations from the mean. Michaels appears to be using a slightly different methodology that involves grouping the runs from a single model together before calculating the 95% bounds. Depending on the details that might or might not be appropriate – for instance, averaging the runs and calculating the trends from the ensemble means would incorrectly reduce the size of the envelope, but weighting the contribution of each run to the mean and variance by the number of model runs might be ok.
Of course, even using the latest data (up to the end of 2008), the impression one gets depends very much on the dataset you are using:
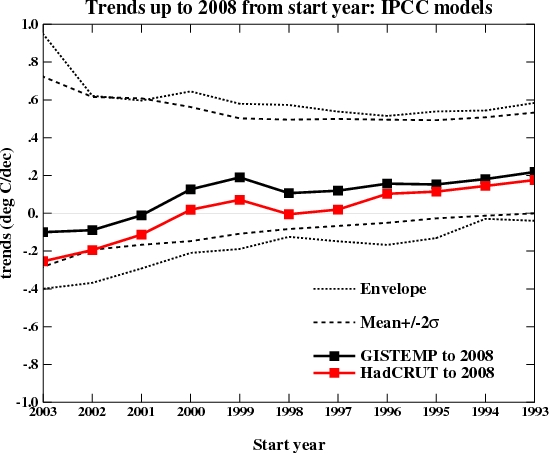
More interesting perhaps is what it will likely look like next year once 2009 has run its course. I made two different assumptions – that this year will be the same as last year (2008), or that it will be the same as 2007. These two assumptions bracket the result you get if you simply assume that 2009 will equal the mean of the previous 10 years. Which of these assumptions is most reasonable remains to be seen, but the first few months of 2009 are running significantly warmer than 2008. Nonetheless, it’s easy to see how sensitive the impression being given is to the last point and the dataset used.
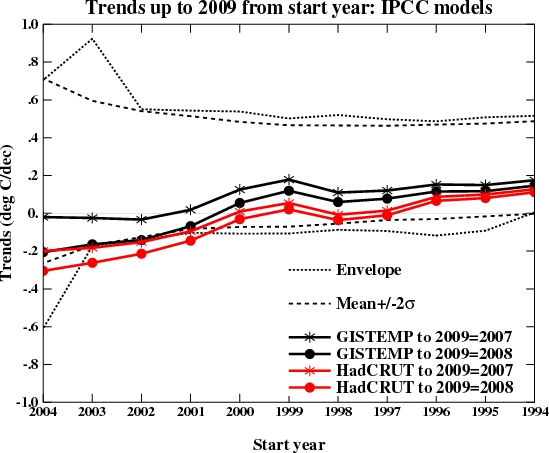
It is thus unlikely this new graph would have seen the light of day had it come up in 2007; and given that next year will likely be warmer than last year, it is not likely to come up again; and since the impression of ‘failure’ relies on you using the HadCRUT3v data, we probably won’t be seeing too many sensitivity studies either.
To summarise, initially compelling pictures whose character depends on a single year’s worth of data and only if you use a very specific dataset are unlikely to be robust or provide much guidance for future projections. Instead, this methodology tells us a) that 2008 was relatively cool compared to recent years and b) short term trends don’t tell you very much about longer term ones. Both things we knew already.
Next.
Scientists know that much of the best science is supported by NSF and NIH. People who believe that climate scientist are just hyping the issue, might also believe that cancer is not a health risk and that AIDs is not contagious. Afterall, many scientists with government grants are studying these diseases. When a scientist has data her or she believes they try to turn it into pubications and maybe even grants. However, grant reviewers are very critical and do not accept BS. NSF grants in my field typically have 6-10 reviews by expects in the field, the ratings need to be mostly excellent with some “very goods” to have much chance for success. This is why NSF funding success is on the order of 10-15% and many scientists have given up trying.
Re #54 “Dyson’s contribution to physics has been huge.”
The guy is a good physicist, no doubt about that. But what exactly is his contribution, beyond streching the imagination of his readers?
Gavin, the “!” scale for physicists goes to 11, and I’d say Dyson is maybe a 7, no more than 8.*
I think it’d be great if you’d invite him to something (maybe an ideal opportunity to have a pair of threads, one for the invited scientists and the other for us kibitzers, for focus).
_______________________
* As evidence, this idea is at least at 10 on the “!” scale:
http://www.springerlink.com/content/n870972259510024/
“Every so often people who are determined to prove a particular point will come up with a new way to demonstrate it. ”
Isn’t this in fact exactly your approach ;-)
Re:Knowing which experts to trust; towards a lay scrutiny of climatology
Perhaps if you could provide the substance of your disagreement – as opposed to merely the statement thereof – we could engage in a fruitful debate. Are you of the opinion that state-funded science should be beyond such scrutiny?
Your two points are unrelated. Yes, obviously governments do take over science to further their own interests, an idea given a huge boost through the Manahattan Project. But how objective this politicised science is, depends on what if any political implications emerge. Probably not very much from the square on the hyponenuse, but plenty if people can be convinced of AGW, regardless of whether or not it turns out to be true.
It’s no good pretending that a substantial part of the attraction of this to governments, is that it gives them an easy excuse to raise taxes. As with green taxes, and impending AGW taxes, these are never offset by tax reductions elsewhere, indicating where the state’s true interests lie.
Gavin,
I am not a stats person but what I have read by the people that seem to know quite a bit, for example Lucia over on The Blackboard on 16 March 2009 wrote:
Does this not apply to what you did? Using shorter trends to get fail to reject? I am not saying this to say that Michael is right because other sites I have read imply that he is not at the 95% confidence interval but that what he says is correct for the 90% confidence interval. What does that imply?
Correction to #105: It’s no good pretending that a substantial part of the attraction of [cigarette taxes] to governments, is not that it gives them an easy excuse to raise taxes. As with green taxes, and impending AGW taxes, these are never offset by tax reductions elsewhere, indicating where the state’s true motives lie.
BJF, less petrol being used in the UK means that the massive amounts of tax on fuel will be lost.
According to your theory, this should mean that the UK would be against AGW.
They are not.
Your theory is disproven.
[Response: No more on this. It’s just getting tedious – gavin]
On the subject of graphs & effects of AGW.
May I ask for comment on this.
http://www.telegraph.co.uk/comment/columnists/christopherbooker/5067351/Rise-of-sea-levels-is-the-greatest-lie-ever-told.html
“One of his most shocking discoveries was why the IPCC has been able to show sea levels rising by 2.3mm a year. Until 2003, even its own satellite-based evidence showed no upward trend. But suddenly the graph tilted upwards because the IPCC’s favoured experts had drawn on the finding of a single tide-gauge in Hong Kong harbour showing a 2.3mm rise. The entire global sea-level projection was then adjusted upwards by a “corrective factor” of 2.3mm, because, as the IPCC scientists admitted, they “needed to show a trend”.
[Response: Do even you take this kind of nonsense seriously? Please take the conspiracy crap somewhere else. It is too tedious to bother with. – gavin]
Jari in 54 wrote:
Alan of Oz wrote in 102
Well, he is rather interesting in this regard. His first great achievements in theoretical physics were roughly by age 26 — in 1949:
Not that unusual — as far as major contributions to theoretical physics go. However, he didn’t stop there:
He was still doing major (“seminal,” in this case) work by 1966. This is around the time that he is age 43. Normally theoretical physicists aren’t doing any of their great work beyond their late twenties or early thirties. But he continued making major contributions well into his forties. By that time he should have been well settled into a job teaching physics, not making major contributions.
But of course, most people probably know him for his science fiction ideas, e.g., the Dyson sphere and Dyson tree. It takes a certain degree of education simply in order to be able to understand the nature of his greater achievements. And of course the Dyson sphere and Dyson tree are good examples of his signature optimism, the later involving a genetic engineering to make trees produce items that we want, to act as factories even for poorer villages. Actually this reminds me of how genetic engineers intend to use bacteria. For example, we already using bacteria to produce insulin.
What I find ironic is that it is his can-do optimism that is in this case working against our ability to do something about our dependence on fossil fuels and the climate change that this dependence is resulting in, that is, switching to alternate energy, preserving modern civilization and the world economy beyond Peak Oil and Peak Coal, preventing climate change from becoming such a huge problem that it destroys that the world economy — and more than likely leads to a series of highly destructive wars over limited resources. And yet it is only by means of making this sort of change to our civilization that we are likely ever to get to the point at which we engaging in the sort of genetic engineering and bending of higher organisms to our purposes that he envisions. Doubly ironic, I suppose. A little too unbelievable to write as fiction, actually.
BFJ Cricklewod, I am sorry, but I do not see how I can have a fruitful debate with a conspiracy theorist who believes that the entire scientific community is committing a giant fraud to increase its funding. That accusation is so beyond the pale it indicates that you and objective reality are so unfamiliar that you don’t even exchange holiday greetings.
First, you have to realize that it is the entire scientific community against which you level those accusations. Not one single, solitary scientific professional or honorific science organization has dissented from the consensus opinion on climate change. Not one. And it’s been examined in minute detail by the NAS, AGU and a veritable alphabet soup of scientists.
Second, the whole premise that anyone benefits from our having to address climate change is simply absurd. It means that all scientific inquiry has to take a back seat to survival for at least a generation or maybe two. How does that benefit me as a frigging rocket scientist?
Third, if there were such a conspiracy, the strongest incentives would be to blow the lid off of it, become famous AND be hailed as a hero of science. Can you imagine an ambitious, young scientist resisting that temptation of fame and glory AND doing the right thing as well? Ben Franklin said, “Two men can keep a secret if one of them is dead.” We’re talking about a conspiracy involving hundreds of thousands of folks who generally are pretty lousy at lying.
Sir, you owe to the entire scientific community, to the very profession of scientist a heartfelt apology. You owe to yourself an honest examination of whether your silly, conspiracy-laced view of the world holds water. Until you realize this, I am afraid we have nothing to discuss.
Sven, OK work with me here. If you start before 1998, your starting data is quite close to the big El Nino year. If you start in 1999, then 1999 is Bigger than 1998, right? Therefore it doesn’t influence the starting point.
Take a little while if you need it to let that sink in.
I think folks are drawing entirely the wrong conclusion from Dyson’s skepticism. He’s as smart as they come. His very early work on QED is brilliant. The lesson is that no matter how smart you are, if you venture far outside your realm of expertise, your opinions count no more than the man on the street. Expertise matters. Years of study matter. Actively publishing in a field and advancing the state of understanding matters. The real question I would like to hear Dyson answer is why anyone should take seriously his opinions on a matter in which he is far from expert.
John Reisman (#90) –
My mention of “slight” was in the context of a hypothetical lower emmision (“were this pace slow enough…”) This hypothetical scenario is not showing itself to be useful in the debate, so I´ll give it up.
Your ellaborate answer was useful for its own content, though. Thanks for your reply.
Thanks to David Benson (#88) too.
dhogaza wrote in 99:
Not that uncommon a view among Libertarians and Objectivists in the past. Ayn Rand held to such a view — at least until she developed lung cancer. It was romanticized in her novels. The heroes smoked — it represented the promethean power over fire, the “fire” lit in the active mind — and even helps one achieve a higher level of attention, or as an Objectivist would put it, “focus one’s mind.” Then she gave up smoking, presumably right there in her doctor’s office.
Objectivists and other Libertarians continue to have an uncomfortable relationship with smoking to this day. But of course nowadays most Objectivists and Libertarians acknowledge the risks to one’s health that smoking poses — at least for some people. And yet some smoke — and of course feel guilty about it since this demonstrates a lack of will power, or they will go one step further and try to rationalize it, arguing that it isn’t an issue if they don’t have a family history of smoking-related illnesses or that since it helps on focus one’s mind smoking is somehow worth the risk.
Even if you were to convince them that smoking is some sort absolute sin they would still have a problem with outlawing it. They will pretty much always have a problem with taxation for any “worthwhile” goal — including the maintanence of an army, police force, sewage system, highway system — pretty much anything. Never did find out what they thought of when it came to innoculations against disease.
Nowadays the Objectivist movement is fragmented into a number of different groups. You have those that stuck with Leonard Piekoff (who has since stepped down) and the Ayn Rand Institute, those that went with David Kelley and the Objectivist Center (since renamed the Institute for Objectivist Studies then Atlas Society), the the Kiwis associated with Lindsay Perigo (who has since stepped down) and the Free Radical in New Zealand.
The most liberal of these groups is probably David Kelley’s Atlas Society. They get along with other Libertarians. Those with ARI don’t — as a way differentiating themselves from those who do. (But it wasn’t always this way.) The Kiwis actually called themselves Libertarianz (with a “z”) but had a falling out with David Kelley’s group.
Some of the more consistent Libertarians are anarcho-Capitalists following in the footsteps of Murray N. Rothbard (a former Objectivist) Others are constitutionalists more along the lines of Frederick A. Hayek. Both Murray N. Rothbard and Frederick A. Hayek were students of Ludwig von Mises, where von Mises also taught Alan Greenspan and George Reisman, the latter two of which were followers of Ayn Rand.
*
But the Ayn Rand Institute on the right and Atlas Society on the left still take pretty much the same view on smoking…
Here is ARI:
Ayn Rand, Smoking, & Atlas Shrugged
by Andrew Lewis (May 19, 2000)
http://www. capmag.com/article.asp?ID=566
… and here is AS:
Smoking
Answered by William Thomas
http://www. objectivistcenter.org/cth–1275-Smoking.aspx
Me? I was in what I thought of as “No Man’s Land,” standing with no one, recognizing no authority greater than reality itself, and standing for dialogue when I formed “The Objectivist Ring.” But that was after I split with ARI. I felt guilty about smoking when I was aligned with ARI and broached the topic with Dr. Andrew Bernstein and then again when I “moderated” The Objectivist Ring and broached the subject with a good friend and dialectician.
*
BFJ Cricklewood wrote in 107:
BFJ Cricklewood is himself a Libertarian — and here he is arguing with an Anarcho-Soc.ialist, apparently:
… and here he is making reference to Frederick A. Hayek’s “problem of economic calculation”:
When I met Mar.xists from South Africa and one of them said of me, “No use arguing with him — he’s an Objectivist and his mind is all made up,” I thought that it was proof of the superiority of Objectivism over Mar.xism — proof that our arguments were superior and that we would win in the long-run. Nowadays it seems more like pig-headedness.
Personally, I doubt there is much use in arguing with Cricklewood. His mind is all made up — and no one can change it, except with the fairly remote possibility of himself.
To dismiss Dyson is to dismiss thought. He thinks about things far more broadly and openly than is suggested by the inference that he’s a brilliant old coot who is past his prime and out of his bailiwick. I have read Dyson and found him to be a far more interesting writer and thinker than anyone here, which is meant neither to insult nor surprise. For those who are fearful of his challenge to climate orthodoxy, though, here is a quotation from a recent publication of his:
“One of the main causes of warming is the increase of carbon dioxide in the atmosphere resulting from our burning of fossil fuels such as oil and coal and natural gas.”
He thinks decidedly outside the box, though, particularly about biomass and the future of biotechnology and farming, and there’s one aged scientist who I hope lives a lot longer. I understand perfectly well that climate modelers want to own the expertise about climate – it’s only human – but surely contributions from outside that narrow field should be welcomed, if disagreed with, rather than being dismissed out of hand.
>> Adam Gallon
> [Response: Do even you take this kind of nonsense seriously?
> Please take the conspiracy crap somewhere else….
He’s _from_ the ‘somewhere else’; n.b. anti-Gore link behind his name.
I say, let’s forget the negative thoughts on Dyson – I like having my mind expanded – and concentrate on what seems to be working. My questions are uninformed and one of you might like to extend yourself for a chat off line. I basically don’t understand the entire role of anthropogenic forcing and would like some clarity. The parameters that have been mentioned in McKitrick and Michaels 2007 don’t make much sense to me and I was hoping for some enlightenment. Or, another paper to read that might have more in the way of breaking down the anthropomorphic parameters.
In case you want to see what an aesthetic engineer does you can see my TOPEX/POSEIDON visualization that I did for EAPS.
On another topic – does anyone use those student in situ data from GLOBE? for their GCM? I think at one point GISS did.
“To dismiss Dyson is to dismiss thought.”
Muh? So Dyson is the God Of Thought???
To dismiss Dyson is to dismiss Dyson. No more, no less.
And it’s funny how you come to that with Dyson yet fail to think the same if it’s someone saying “AGW is real, it’s now and we must do something”.
I’m not a stats person either, but I think Lucia is using a test that Santer uses, but for some reason doesn’t point out that Santer also stated that this test could return false negatives. I don’t think her CIs take this into account.
Walter, I agree that Dyson is brilliant, but he is far, far outside his realm of expertise. Dyson tends to be a “big-picture” kind of guy who doesn’t sweat the details. Climate change is one of those inconvenient details that could derail his technophilic vision of the future. I think he tends to be a bit naive–not uncommon in a physicist.
It is crucial to pay attention to those who are actively advancing understanding in the field
GBS – Aesthetic Engineer (118) — I encourage you to read W.F. Ruddiman’s “Plows, Plagues and Petroleum”. He also has a guest thread here on RealClimate regarding the early anthropocene.
I also suggest David Archer’s “The Long Thaw”.
#100 Ray, I’ve just done some recalculations of high Arctic sunset locations, turns out, I didn’t do it to standard during 2001. After the Powerful El-Nino of 1998, there was an extended La-Nina:
http://www.appinsys.com/GlobalWarming/ENSO.htm
(would like to put graphs instead of linking)
…. Of which in 2001 I filmed and observed 7 sunsets well below the astronomical horizon by 2 degrees (this may be a world record). Flash forward to now, same sample number of observations during roughly the same days, again at end of a powerful La-Nina>> Results: none, zip, no high zenith distance sunsets beyond 92 degrees. I translate this as effects of La-Nina starting from a higher energy atmosphere, corresponding to overall higher temperatures throughout the atmosphere at the beginning and the end of a LaNina (not necessarily measured fully measured by conventional means due to lack of data resolution).
I give one example on my web site.. Look for the sun line pictures.
Re Mark #120
wmanny wrote in 116:
Mark wrote in 120:
Mark, you might find this of interest… Comment #43, Monckton Flunks Latin at Deltoid
PS
to the above…
Paste the following into your browser, but get rid of the space:
http://wattsupwiththat.com/2009/03/24/guardian-headline-leading-climate-scientist-democratic-process-isnt-working/#comment-104058
@Doktor Bettnässer
All statistical tests can return both false positives and false negatives. In section 6 of their article, Santer et al 2008 discuss a feature that can cause their test to return slightly more false positives than intended. That is, when the test is designed to result in 5% false rejections of the null hypothesis, it may result in a few more. This is illustrated in their figure 5, and can be seen by nothing the result of synthetic tests for the 5% level appears to return a bit more than 5% false positives. Squinting at their graph, it looks like they get somewhere between 5% and 6% false rejections when they set their criteria to return 5% false rejections.
You are correct that I do not correct for this in my blog posts but I have mentioned it from time to time.
I have also mentioned several other issues with the test in Santer.
Though Santer did not discuss the possibility, it is known that t-tests involving linear fits will result in too many false negatives if the underlying trend is non-linear. Non-linearities in very evident underlying are exhibited in model mean over all models: There are dips associated with volcanic eruptions. These dips do not average out over different runs of individual models. I’ve estimated the effect on the surface trends computed since the 80s, and the increase in false negatives is larger than the rate of false positives for a similar period.
I do not do the corrections for either effect in the recent blog posts, but have discussed these issues rather generally and even specifically, for example here.
Because the magnitude of the counter acting effects depends on the degree of non-linearity, the rms of the residuals to a linear fit, the length of the trend and the temporal auto-correlation of the “weather noise”, it is difficult to generalize whether the method will generally result in too many false positives or negatives. One must make assumptions and estimate the effect in each instance. However, though I make no formal correction, I know the order of magnitude of both effect and correcting would not change the reject/fail to reject diagnosis in any important way.
For what it’s worth, I haven’t specifically checked for the effect of non-linearities on the underlying trend (as estimated based on the model mean) on the liberality of the test on the tropospheric trend presented in the test reported in Table III in Santer et al. Given the reported magnitudes of d*, I anticipate if I did check, the major results would remain intact provided one sticks to the specific years used in the analysis. The d*’s in that table are sufficiently below the threshold for the 95% confidence intervals, though, it is possible this could change if the test of the tropospheric trends included more recent data. (This, would, of course depend on what the more recent data show.)
Wayne, That is cool! Interesting correlation. Any idea of the cause?
timothy chase,
wow – thanks for the detective work. man those guys are unscrupulous.
#127 Ray,
Any analysis is difficult because we lack resolution, it would be nice to have more stations
everywhere. Since its not possible, must rely on other means. Best possibility,
the ice is thinner, the observed sunsets are purely over sea ice, ray paths exactly over NW passage ice.
Local measurements have thinner ice, but National Ice Center is off line
http://www.natice.noaa.gov/products/arctic/index.htm
I cant confirm if it is so. But a Upper air profile from a land station may differ low over sea ice, for the lower atmosphere may be warmer over thinner ice compared with previous years. Refraction
is stronger in colder air, so its likely that the lower atmosphere over thinner ice is warmer.
I have a question about another testimonial which seems quite compelling.
It’s christy’s testimonial about the models on CO2 and cloud sensitivity (which overstate wraming or are wrong according to him):
http://waysandmeans.house.gov/media/pdf/111/ctest.pdf
Are the models actually this lousy and does he have a point? Isn’t he one of the lead authors of the IPCC?
[Response: His graph on the 1988 projections has been significantly distorted by playing with the baseline. See here for a much better discussion of the same issue (summary: the models projected a ~0.23+/-0.04 deg C/dec, and the data showed ~0.20+/-0.04 deg C/dec from 1984 to 2008 ). His second graph is exactly what we discussed in the main post. His characterisation of Spencer’s work is a huge overstatement since Spencer’s paper only looked at the MJO (Madden-Julien Oscillation, or Intra-seasonal oscillation) which is a dynamic oscillation in the tropics and not a response to surface warming at all. He doesn’t discuss climate sensitivity at all. Climate models results can indeed be usefully questioned – but Christy’s tesimony was not one of those efforts. – gavin]
Nickolas writes:
I regressed NASA GISS temperature anomalies 2001-2008 on year and got a positive slope that was statistically insignificant. Where did you get “sharp global cooling” from?
Billy Ruffn accuses Gavin of arrogance for saying he could educate Freeman Dyson on climate science.
You know what, Billy? I accuse Freeman Dyson of arrogance for saying he can educate climate scientists on climate science, when he himself has never studied the subject.
And I accuse you of arrogance for spouting off about Gavin when you don’t understand the discussion to begin with.
CAPTCHA: “multiplied flames”
wmanny writes:
If it’s not statistically significant, it’s not a “trend.”
BFJC writes:
How about evaluating what’s true on the basis of the evidence instead of endlessly blathering about who benefits, and other worthless ad hominem arguments? It doesn’t matter if the government wants to rape puppies and torture small children–either what it says about tobacco is right, or it’s wrong. Gassing about their motives proves nothing one way or the other.
barton, re: nickolas’ “sharp cooling” – that’s funny/sad. sounds like a claim that’s been through several non-scientist hands. somebody changed “decrease in warming” (a very questionable starting point) to “cooling”, then someone added “sharp” – it’s like they played telephone.
Somebody was watching…
Smoking
Answered by William Thomas
http://www. objectivistcenter.org/cth–1275-Smoking.aspx
… is gone.
But I have a copy.
If you want one you can get it here for the time being:
http://209.85.173.132/search?q=cache:ztCMHH9B1LcJ:www.objectivistcenter.org/cth–1275-Smoking.aspx+http://www.objectivistcenter.org/cth%E2%80%931275-Smoking.aspx&cd=1&hl=en&ct=clnk&gl=us
Timothy, from the Google Cache page the link to “current page” still finds it. Slight difference from the link as you have it formatted:
http://www.objectivistcenter.org/cth–1275-Smoking.aspx
Uh, oh, watch for software help.
As typed this is two hyphens —
And in the link, between “cth” and “1275” should be two hyphens. It looks like something is changing those to a single long dash, from the preview. That would break the link, eh?
Ike (re:89),
You ask:
“Your i.e. does not follow. Are you really claiming that models perfectly simulate “internal model weather noise”? Do you believe that if you examine model output you are looking at the real world?”
I answer:
Our analysis captures the impact of model weather noise on the short-term model surface temperature trends. Whether or not the models capture the general characteristics of ‘natural variability’ is one of the things we are examining.
-Chip
Deep Climate (re:72),
Thanks for your comments.
a) Our trend calculations are not “off by a year.” There are 11 years of data from 1998-2008.
b) Our CI calculation is more general than Gavin’s. It is explained a bit in Michaels testimony as well as in my comment 36
c) Gavin does not include an “uncertainty envelope for the observations.” However, his point that the value of observed trends change given the start and stop date of the observations is valid. Michaels showed the data from the last stop date available (i.e. the current values as of December 2008). In our paper, we’ll show the time history of n-year trends (over all start and stop dates)
d) We will include the GISS data as well in our paper.
-Chip
Hank Roberts wrote in 138:
Don’t type in the two hyphens. Copy and paste, then get rid of the space if it is there. Or just click on the link for the cached.
It works for me when I click the link for the cached version.
In any case, remove the space from the original address, put it into Google. Hit search. The original page will turn up as one of the results — the first result — and then “Cached” will appear as a link directly beneath it — to the right.
However, since that has the long hyphen another approach is to enter the following into Google:
site:www.objectivistcenter.org smoking
Once again, the first result will be the “Smoking” article and you will have a link to the Google “Cached” version underneath and to the right.
Hey — I was helping to track down creationist organisations on the web and compile evidence for the British Centre for Science Education for a while. They leave tracks, you can follow them, and you can tell other people how to find them. However, the cache will remain in Google only for so long. Maybe two weeks.
So it helps to get the copy.
*
Captcha fortune cookie:
Siberia sacks
Sounds like someone is carrying around some extra baggage…
Hank, you are right — I just didn’t understand.
The old web page is still there. Just me being paranoid — this time.
Deep Climate writes in 77:
The two subperiods… For the sake of the example I will focus on the GIS figures…
Deep Climate continues in 77:
You would be speaking of from the trend in temperature anomaly (warming) from 1979 to present being greater than either of the two shorter trends from 1979 to 1998 and from 1998 to present — if I understand you correctly.
I take it that this would be similar to the following:
The long-term ice area loss from September of 1979 to September of 2007 was -10.7%. Then we actually gained some ice area from 2007 to 2008 (although we lost about half the ice volume going from 2007 to 2008 — if I remember correctly). But even though the trend was negative from 1979 to 2007 and then positive from 2007 to 2008, the trend from 1979 to 2008 was more negative (-11.7% per decade) than the trend from 1979 to 2007 (-10.7%).
*
Captcha fortune cookie: deplores the
We both do.
I wander what the above graphs look like if you use more accurate satellite data i.e. RSS or MSU data instead of GISS or HadCRUT3, as in recent years the land based temperature records have been diverging upwards from the satellite data.
[Response: No they haven’t. UAH is the main outlier though. However, you would need to use the MSU-LT diagnostics from the models to have a like-with-like comparison. You can’t assume that the trends are the same as the surface air temperature. – gavin]
#111 Ray Ladbury
I neither claim nor imply ‘conspiracy’. Everything I refer to happens in the open.
Ditto ‘fraud’, at least as far the scientific community is concerned. The politicisation of science is driven by political structures, by the state paying for science, thereby systematically selecting some scientists over others.
Not too surprising really, given they all have the same ultimate employer.
It obviously doesn’t. Benefits only go the the state (and to climatologists/meteorologists at the expense of rocket and other scientists).
As mentioned, conspiracy by scientists doesn’t enter into it. The overall mix and flavour of science is set by its paymasters, who fund, select and reward institutions and people they prefer – the criteria for which may well include factors other than their scientific prowess.
But Yes, scientists who dare to differ would be able to make a name for themselves. But, given the single (and political) source of funding, what is the likelihood of such people being funded in the first place, or maintaining funding once they step out of line?
[Response: What a load of twaddle. First off most funding for all sciences is decided among their peers (on grant review panels etc.) not by government bureaucrats; most funded research has nothing to do directly with what gets discussed in the media or on blogs; almost all of it is funded without thought to what the conclusions will be; and there are dozens of different sources of funding (NSF, NASA, NOAA, foundations, DOE, university endowments etc.). The idea that they all share an identical agenda is laughable. – gavin]
#135 Barton Paul Levenson
Where there are no easy answers, how much confidence can one have in the “consensus” if one side of the argument is funded vastly more than the other? Facts do not speak for themselves.
re 146. That funding side, as in the tremendous amount of disinformation funded by Exxon/Mobil, right? Because if you are not being equally skeptical with their disinformation campaign, why? Oh, because you have an agenda! Unlike the data which are unbiased.
BTW, learn about what “consensus” means in the scientific sense before spouting off about things that you apparently do not know. Hint: Consensus and peer-review are two of the foundations of all science. Always have been.
Which side of the argument are you thinking about?
1. The government-funded scientists who were long unconvinced that our CO2 emissions would have a significant effect on climate?
2. Or the government-funded scientists who later changed their mind as more and more scientific work supported the supposition?
If government-funded science biases results as you claim it does, such a state change in the government-funded scientific consensus would be impossible.
“how much confidence can one have in the “consensus” if one side of the argument is funded vastly more than the other?”
Yup. Compare the entire university funding grant of the world to the combined total revenue of the oil/coal/gas and tobacco industry.
How can we believe the denialists when their funding comes from a group that have a captive market and can raise ‘taxes’ without losing revenue (unlike governments)?
Gavin, I thought you were going to knock this sort of crap on the head. If not, then I’ll repeat the UK has a HUGE tax base from fuel taxes. Either the UK has the only altruistic government (which is killing their tax revenue for the benefit of other governments) or you’re wrong.
Oracle says: funds balk.
How untrue.
#145 Response, Gavin
I can well imagine that’s how it looks from the inside. But the fact is they all do share a common sponsor. And one way or another, either directly or indirectly, the single he who pays the pipers will unavoidably call the single tune.
[Response: You have absolutely no idea how the federal government works. There is no single tune – more a complete cacophony of random notes that very occasionally give rise to some beat frequency for a short time. The rest of the time, it’s mostly chaos combined with a huge inertia. No black helicopters anywhere to be seen. – gavin]