Some of you that follow my twitter account will have already seen this, but there was a particularly amusing episode of Q&A on Australian TV that pitted Prof. Brian Cox against a newly-elected politician who is known for his somewhat fringe climate ‘contrarian’ views. The resulting exchanges were fun:
We've had a pause in warming & NASA corrupted data, says Malcolm Roberts. @ProfBrianCox examines the graphs #QandA https://t.co/HTNk4Bzrk1
— QandA (@QandA) August 15, 2016
The insinuation that NASA data was corrupting the data, lead to the following series of tweets:
Some thoughts on climate deniers (no other word suffices in this case), who accuse my team of fraud. 1/nhttps://t.co/CcCJnlPd3b
— Gavin Schmidt (@ClimateOfGavin) August 15, 2016
The analysis has only ever used publicly available data, analysis code has been public since ~2007 & has been independently verified 3/n
— Gavin Schmidt (@ClimateOfGavin) August 15, 2016
Link here: https://t.co/5rGGCxVXBp 5/n
— Gavin Schmidt (@ClimateOfGavin) August 15, 2016
These changes are small compared to overall trends. Interactive plotter available here: https://t.co/t7wFU3ofev 7/n pic.twitter.com/9gFMzktEzO
— Gavin Schmidt (@ClimateOfGavin) August 15, 2016
So I'm flummoxed. Where do these ppl feel data manipulation is happening? It's not in inputs or the code or presentation. So where??? 9/n
— Gavin Schmidt (@ClimateOfGavin) August 15, 2016
Refusal to see this, cries of 'show me the data' when all data is accessible at a click, can only be described as denial (sorry) 11/n
— Gavin Schmidt (@ClimateOfGavin) August 15, 2016
Oops. Just added to the conspiracy theories by linking to an internal server(!) Here is the public version: https://t.co/nALWMlNDcP 13/12
— Gavin Schmidt (@ClimateOfGavin) August 15, 2016
By coincidence, yesterday was also the scheduled update for the GISTEMP July temperature release, and because July is usually the warmest month of the year on an absolute basis, a record in July usually means a record of absolute temperature too. A record February (as we had earlier this year) is generally with respect only to previous Februaries, summer temperatures are still warmer even if the anomaly is smaller. And so it proved…
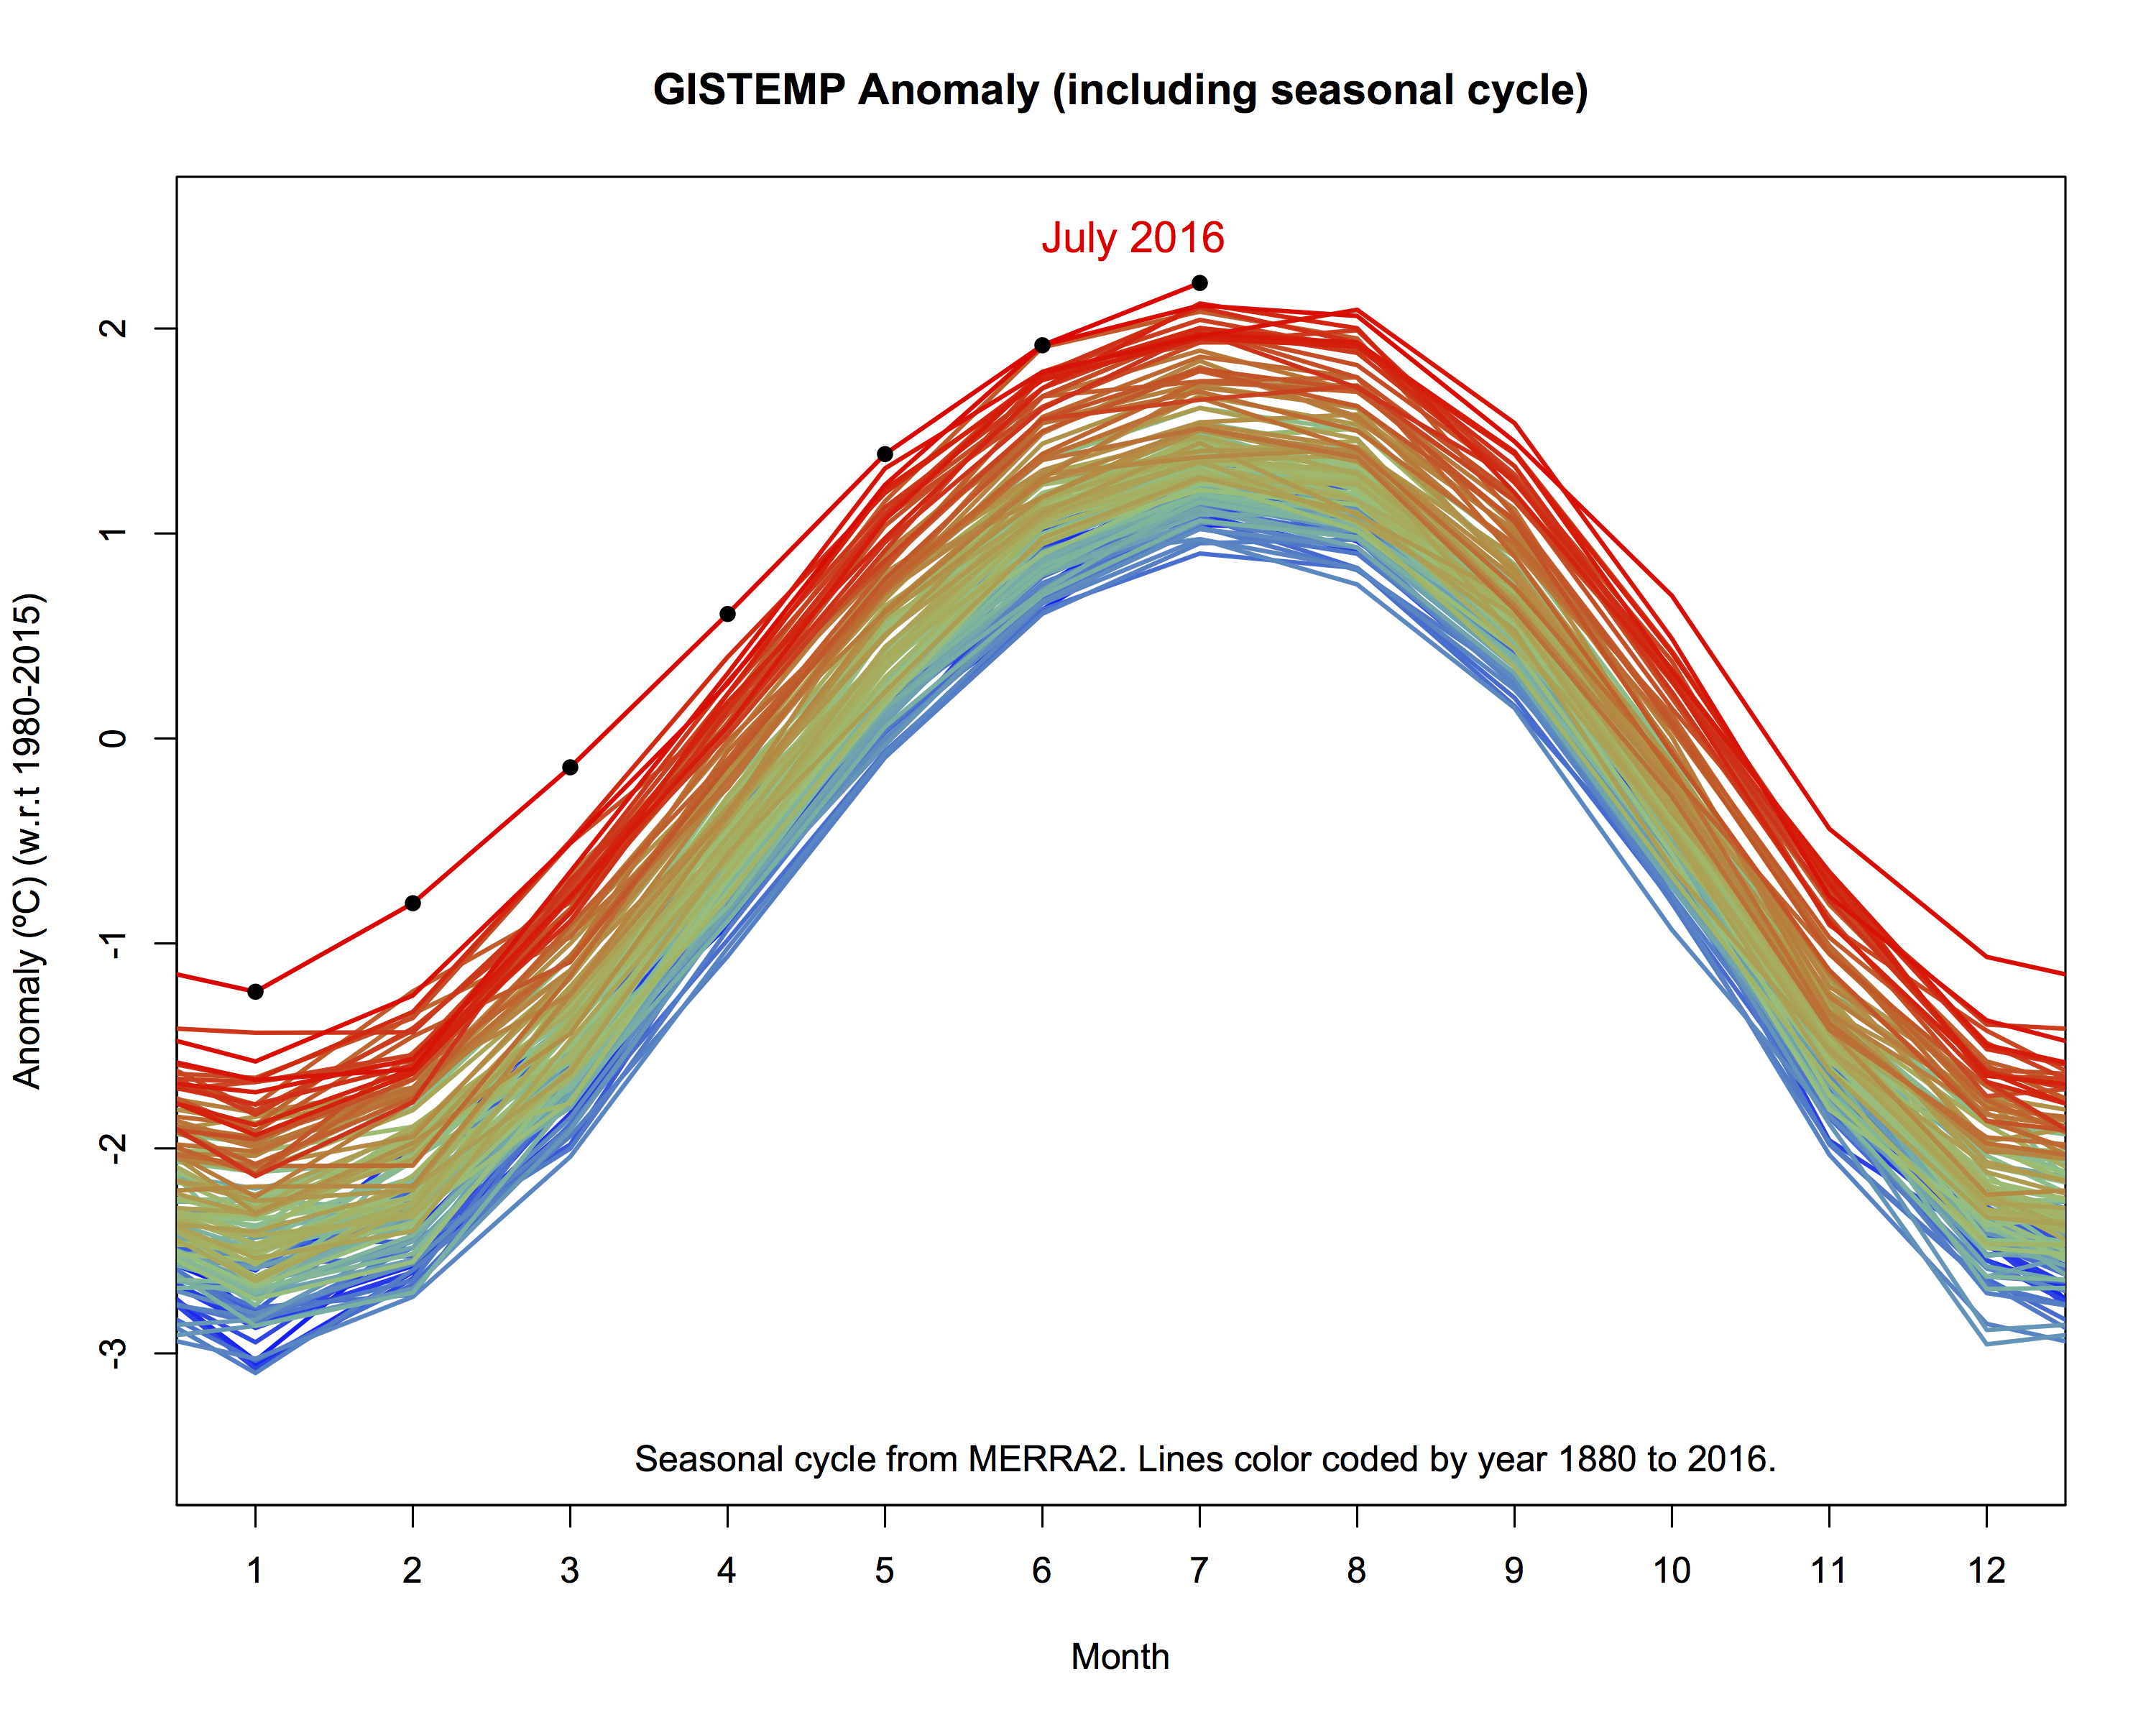
Normally we just plot the monthly anomalies (with respect to each month), but here I used the estimates of the seasonal cycle in temperature from MERRA2 to enhance the analysis so that months can be compared in an absolute sense.
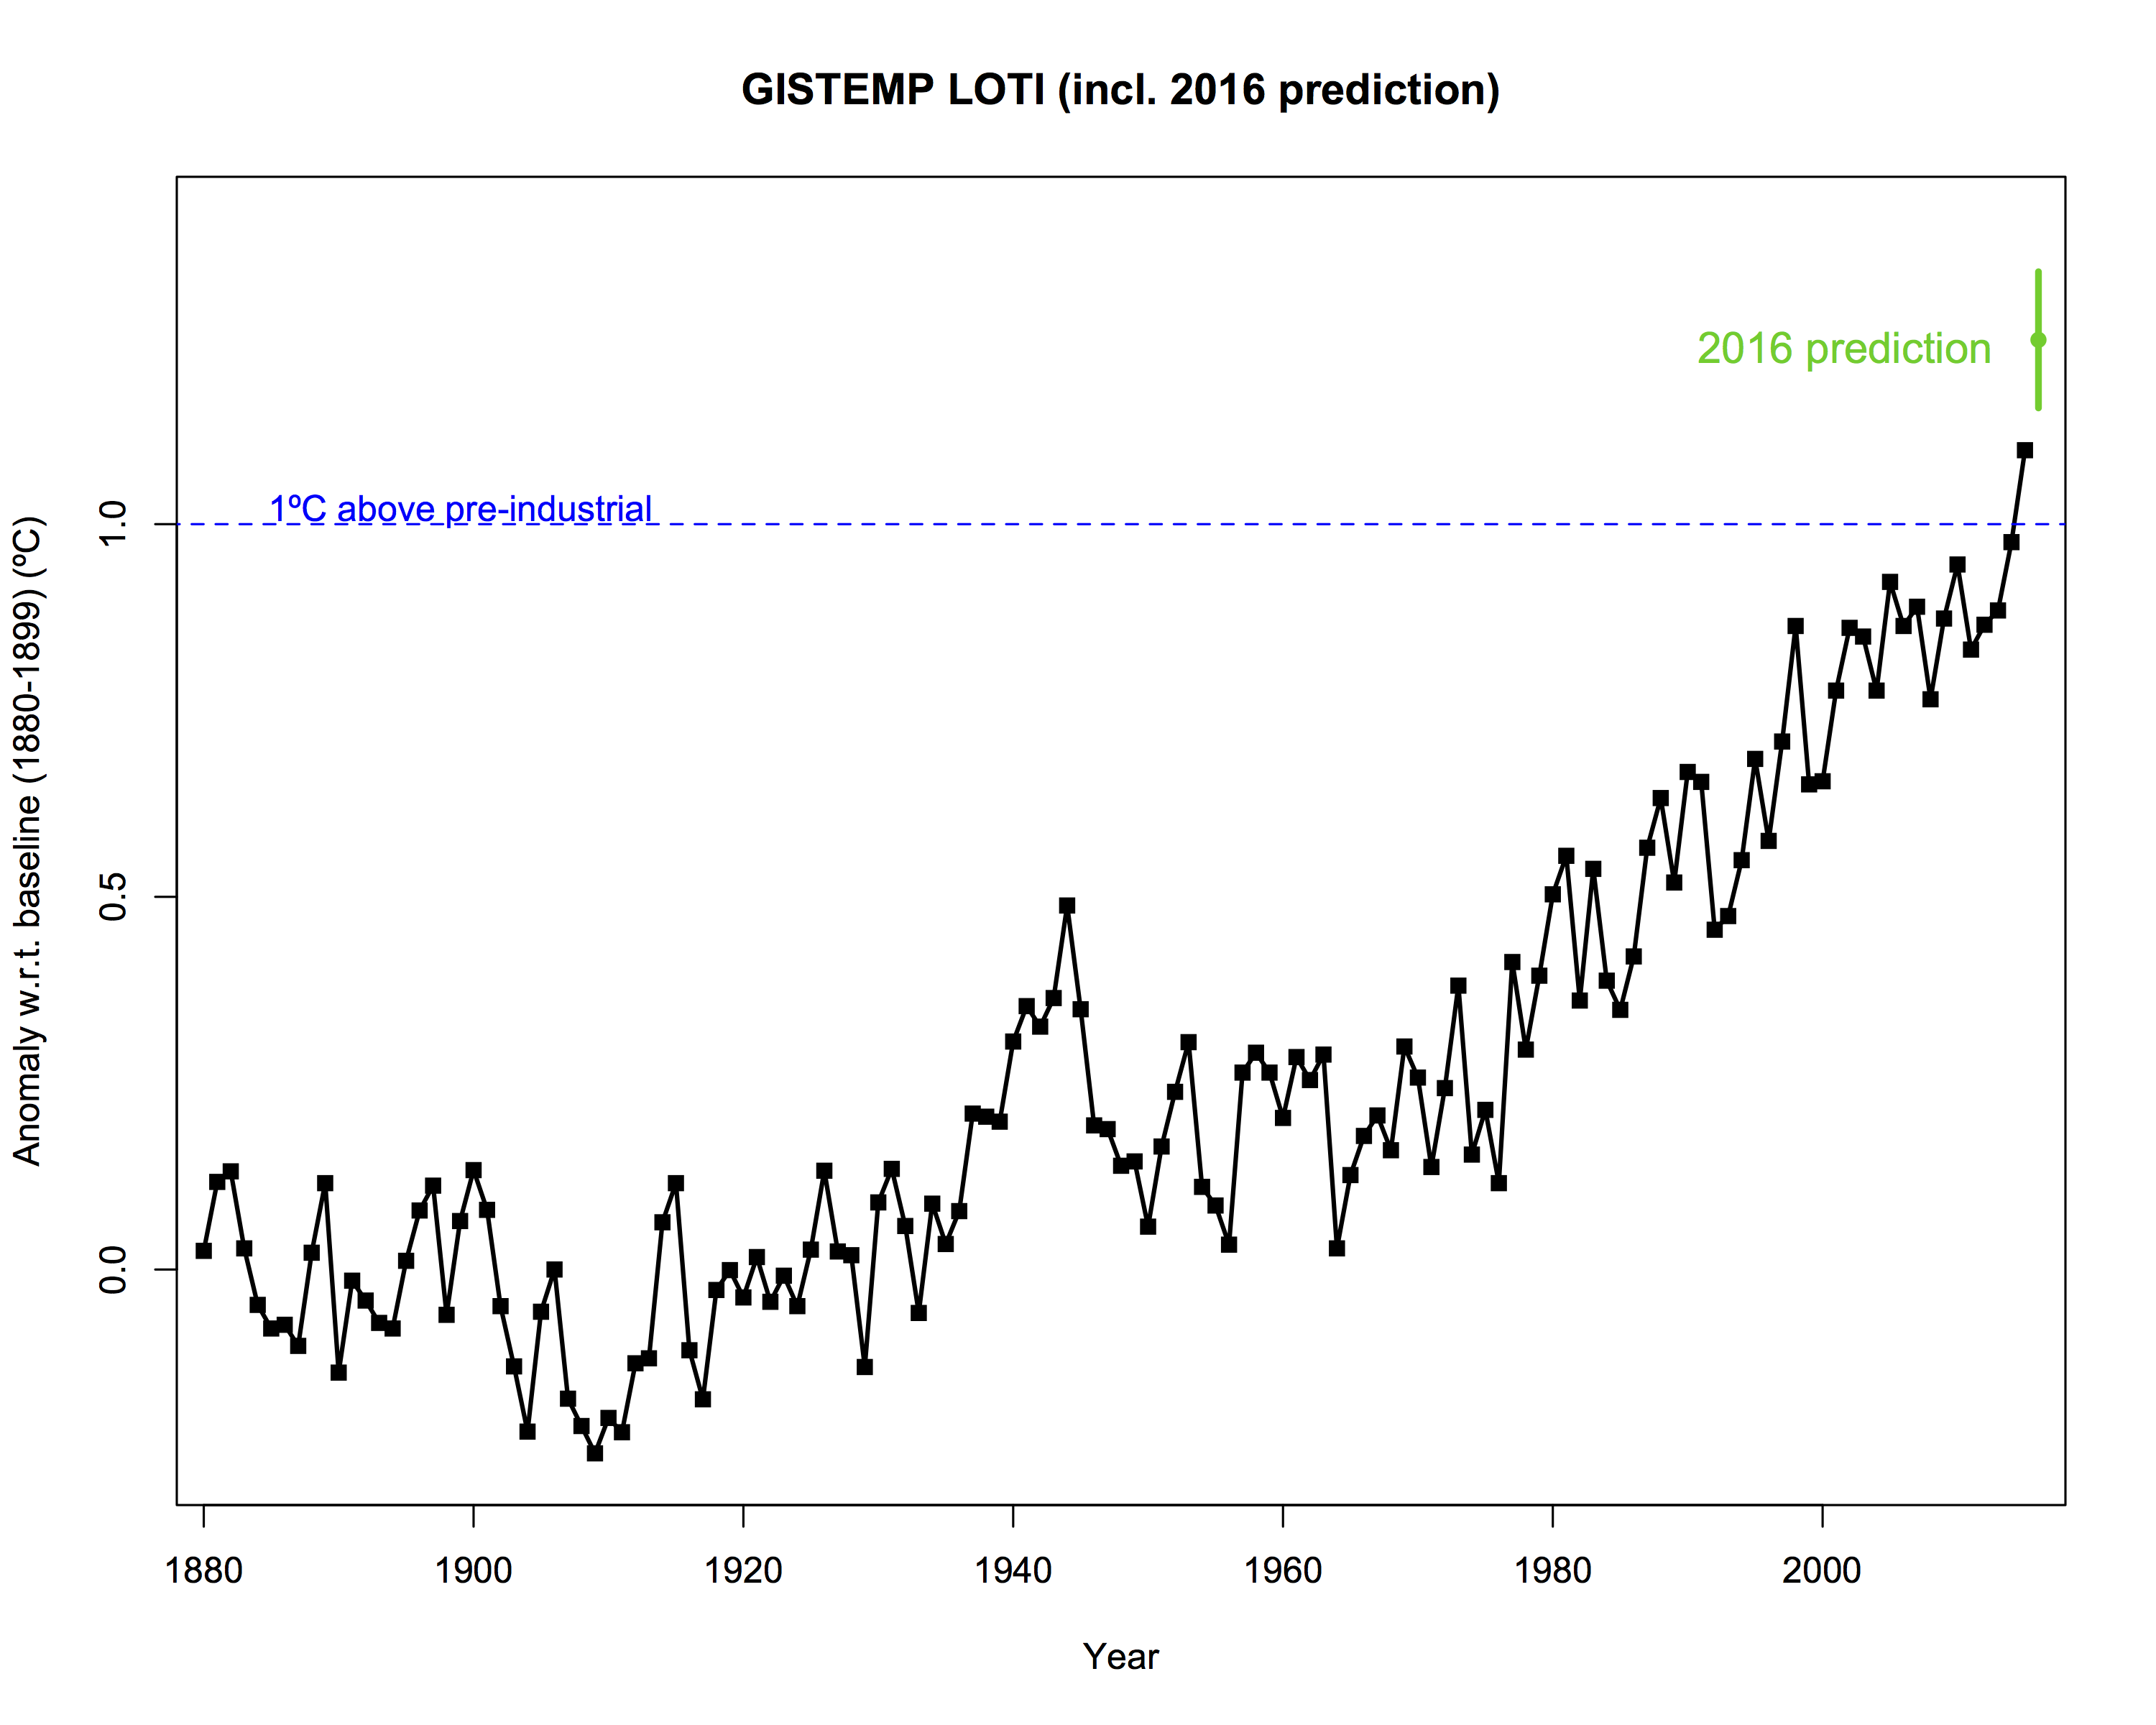
This string of record-breaking months is coming to a close now that El Niño has faded, but it is sufficient to give a very high likelihood that 2016 will be a record warm year in the surface records.
RE: 15 Victor:
As if most of us would not know that UAH and RSS do not report surface temperatures. They report the “lower troposphere” which, if you compare it to radiosonde measurements, corresponds to about 5 km (15 000 ft) height. That is not the surface where we and the ecosystems we are mostly dependent live in. The fact that the mid troposphere happened to be hot in 1998 has very little importance relative to what is happening all over before and after.
Roberts referred to the long term England temperature record and how it had risen more quickly in the 1700s. Is this true and how would this be relevant to the current situation?
Ocationally, August is warmer than July in a given year. It seems like the likelihood of that happening is growing with time from examining the figure. It would be great if you could publish the offsets used to make the figure from the GISS anomalies so that and other aspects of the figue could be better understood.
Francis,
Here is the CET record: http://www.metoffice.gov.uk/hadobs/hadcet/ I will leave it to Roberts to explain what he meant.
Keith Woollard:
“Dr Cox was invited to provide proof of the human component. He wasn’t asked if there was warming, or how much warming”
You cannot prove there is a human component of warming unless you prove there is warming. Proof of warming is a necessary part of proving a human component. Thus “(Cox) took the politicians option of not answering the question” is an unsupported claim.
From Francis:
“Roberts referred to the long term England temperature record and how it had risen more quickly in the 1700s.”
It’s incredibly hypocritical of global warming denialists to whine that compilations of global temperature anomaly like GISTEMP have large distances between recording stations and this makes them an inaccurate estimate of global anomaly and then we have a global warming denialist extraordinaire, Roberts, claim that a SINGLE locality, Central England, can provide an adequate estimate of global anomaly.
You just can’t make up hypocrisy like this. It’s innate to the character of global warming denial.
Mathematical Reticence
(a prediction of more twitter storminess)
Attempting to analyze data leads to a natural parsimony in math. Statistics urges us to limit the number of parameters we use in analysis because using more weakens what we can learn about any one of them. However, it is habitual to work up to first or second order and then stop since the eye and fitting algorithms can’t see much more than a curve in typically noisy data. I’m not thinking of data with inherent instrumental profiles but time series in change detection experiments, the -Is something happening?- type question.
An instrumental profile is a priori and deserves a complex treatment. A time series wants to be treated with parsimony. However, the stopping at second order habit becomes reticence of the sort which may impede understanding if there is reason to suspect that an infinite number of orders may be involved. The Taylor expansion of the exponential function, for example, is unending containing terms of unboundedly high order.
In terms of parsimony, it has as many parameters as a second order fit (if you count an offset as a parameter) but it requires nonlinear treatment, fitting in logarithmic space, for example. But in terms of reticence it may seem to the biased to lack in conservatism.
Hansen et al. recently explored the effect of stratification of meltwater water on storminess, sea surface temperature and sea level rise and found that, among other things, their model predicted strong feedbacks in ice sheet exposure to destabilizing influences. Strong feedbacks imply exponential behavior, as any right thinking differential equation will tell you. Further, their model explained a number of current phenomena and helped explain past instances of very rapid sea level rise and extreme storminess.
Thus, their model predicts the first several meters of sea level rise in the next 50 to 150 years depending on the empirically measured doubling time of ice sheet mass loss. Doubling time is an exponential parameter. That number is not all that well constrained yet thus the range in timescale.
But given that their model works in the past and present, it would be unparsimonious to avoid using an exponential fit to the mass loss data and instead settle for a second order fit that is logically inconsistent with the model. The model cannot predict without the nonlinear treatment.
A pedantic treatment would use a logistics function since we know there is only so much ice sheet mass to be lost. But the early stages of a logistics curve are so close to exponential that their approximation is adequate for the scope of what they are predicting and it is mathematically more parsimonious.
But let us be very clear, it is a prediction just as they state in the abstract, Hillary Clinton partisans and reticently posturing journalists notwithstanding. The work is peer reviewed, and claiming is says other than what it does for political gain is dishonest.
“don’t feed the trolls, it just encourages them.”
For what it’s worth, this type of comment suffers from a certain amount of hypocrisy as it is concern trolling.
[no known relation to that other Roberts]
> long term England temperature record …?
Well, why trust some guy on a blog, when you can check the claim for yourself?
The search terms you want are
CET
Central England Temperature
and to narrow it down a bit, try
CET temperature England 1700s rate change
http://www.climate-lab-book.ac.uk/2014/cet-2014/
Re: Malcolm Roberts: “The Galileo Gambit and other stories: the three main tactics of climate denial,” Stephen Lewandowsky, DeSmogUK, Aug 14 (from “The Conversation,” Aug 10):
“Conspiracism, the Galileo gambit and the use of sciency-sounding language to mislead are the three principal characteristics of science denial. Whenever one or more of them is present, you can be confident you’re listening to a debate about politics or ideology, not science.The Conversation” –Stephan Landowsky, DeSmogUK, Aug 14 (originally on “The Conversation,” Aug 10).
http://www.desmog.uk/2016/08/14/galileo-gambit-and-other-stories-three-main-tactics-climate-denial
https://theconversation.com/the-galileo-gambit-and-other-stories-the-three-main-tactics-of-climate-denial-63719
https://theconversation.com/profiles/stephan-lewandowsky-685
Along with the three tactics of denialism mentioned, one sees at work the archetypal tactic of blaming the victim–the perpetrator blaming the victim. Familiar, isn’t it? By the perpetrator I don’t just mean Malcolm Roberts, but the the entire structure that props him up: coaltails, the “One Nation” party, and more.
http://www.desmogblog.com/malcolm-roberts
http://www.desmogblog.com/directory/vocabulary/23802
The Galileo gambit is consistent with the tactic of blaming the victim–if not its quintessence. It pre-empts the role of victim for the perpetrator. So today’s perpetrators of disinformation get to play the role of victims. It also distorts what the suppression of Galileo was about. Like today, it was a matter of power, politics and purported religion aligning to suppress scientific findings. The perpetrator-as-victim (or perpetrator-as-aggrieved-party) is a rampant form of disinformation spin.
And OMG, Malcolm Roberts is using the “sovereign citizen” language–requiring a separate comment. It’s too big for this one.
V 43: There is a huge difference between the uncritical application of statistical methods and the understanding of basic scientific principles. A great many climate scientists acknowledge the difficulty I’ve raised, and their response is based on their analysis of the various forcings affecting global temperatures, NOT the simplistic juggling of arcane statistical formulae.
BPL: Arcane? ARCANE? Victor, Pearson’s r is INTRO STATS material. Freshman statistics. Found in any introductory stats book. You can find it in “Statistics for Dummies,” okay?
You made a statement: There is no long-term correlation between elapsed time and temperature.
I responded by showing that “correlation” has a precise definition, and by that definition, your assertion was WRONG.
You were wrong, Victor, and you still are. Why don’t you man up and admit it, instead of whining about the math?
How we know humans are causing the present global warming:
http://bartonlevenson.com/AnthropogenicCO2.html
@Lauri – Victor was told this for example here. But if you look over his many comments made on this forum, you will see that Victor either has a reading comprehension problem or a stolid refusal to learn anything he doesnt want to know. You cannot cure wilful ignornance – ignore his trolling.
38 Keith Woollard: “Watch the whole video Thomas. Dr Cox was invited to provide proof of the human component. He wasn’t asked if there was warming, or how much warming, or how many people agreed with him, or how condescending he could be, or what pat answers he could provide.”
Smiling. No comment about “representations” and what that means in the context of everything. Noted. I watched it live on my TV Keith, I rarely miss Q&A because it’s such fun and also a deadly serious program at times. No need for a video. So you’re wrong again Keith! Did you actually “hear” what Cox said in reply? I suspect that a major Cognitive Dissonance event had you by the tail and you missed it all.
KW: “He took the politicians option of not answering the question”
Cox’s answer was clear – Go look at the Science. Go listen to what Scientists across the world have to say about the MOUNTAINS of Evidence that already exists.
Like all disorientated deniers you fail to grasp the true meaning of consensus. Foolishly you assume that scientists (including non-climate scientists) and their representative bodies accept the science of climate change because some other scientist told them so. And being so weak minded they become sheep and just follow along.
No, that’s not the case but of course that fool Roberts thinks it is. Listen to his comments on Q&A closely and his recent press comments. Unlike yourself and unlike Roberts scientists and others with intelligence actually READ the scientific literature, read the material put out by representative bodies, and they understand what is being said. That literature contains THE EVIDENCE in tens of thousands of Papers. It’s only summarized in the IPCC reports. The devil is in fact in the details of every single study going back 100+ years. It’s called Science Keith. It’s known as accumulated human knowledge.
The consensus that exists among scientists today is based on the evidence. The evidence, the data, the studies, the maths is NOT BASED ON ANY OPINIONATED CONSENSUS OR GROUP BELIEF. Evidence matched with a sound scientific method and the credibility of them there scientists then leads to agreement and a minority who disagree – that AGREEMENT ON THE EVIDENCE THEN BECAME A GLOBAL CONSENSUS OVER SEVERAL DECADES. It has only become stronger not weaker.
What gullible Deniers like you and Roberts do is the complete opposite. Your opinion has zero value. The only way you can maintain your foolish beliefs is by intentionally ignoring the data, the evidence, the maths and the laws of physics. And/or not being blessed with sufficient human emotional control, skills and intelligence to comprehend it. Cox is not the problem here, it’s you Woollard.
Prof Cox took the correct approach. Tell them where the “evidence is”. Next he refused to be sidetracked by Roberts fanatical bullshit and incompetence. Rule #1: “Never try to argue with drunks, drug addicts, fanatics or idiots.”
It’s a waste of time except for the laughter from onlookers, as happened on Q&A. :-)
This might help some climate science deniers to get past their cognitive dissonance by learning how to listen properly to what others say and work out when they are being conned by rhetoric and sophistry in an evidence free zone.
– http://www.nizkor.org/features/fallacies/
– http://esgs.free.fr/uk/logic.htm
– https://en.wikipedia.org/wiki/Fallacy
Emphasis on the word might
44 Chris O’Neill says: “Depends on your definition of liar.”
Yes. My definition follows that of Emeritus Professor of Psychology (UCSF) PAUL EKMAN, Telling Lies: Clues to Deceit in the Marketplace, Politics, and Marriage, Copyright (c) 1992, 1985 by Paul Ekman. (a great book btw, quoting…)
In my definition of a lie or deceit, then, one person intends to mislead another, doing so deliberately, without prior notification of this purpose, and without having been explicitly asked to do so by the target.
There are two primary ways to lie: to conceal and to falsify.
In concealing, the liar withholds some information without
actually saying anything untrue. In falsifying, an additional
step is taken. Not only does the liar withhold true information,
but he presents false information as if it were true. Often it
is necessary to combine concealing and falsifying to pull off
the deceit, but sometimes a liar can get away just with concealment.
eg
“A liar can choose not to lie. Misleading the victim is
deliberate; the liar intends to misinform the victim. The lie
may or may not be justified, in the opinion of the liar or the
community. The liar may be a good or a bad person, liked or
disliked. But the person who lies could choose to lie or to be
truthful, and knows the difference between the two.
Pathological liars who know they are being untruthful but
cannot control their behavior do not meet my requirement.
Nor would people who do not even know they are lying, those
said to be victims of self-deceit. A liar may come over time
to believe in her own lie. If that happens she would no longer
be a liar, and her untruths, for reasons I explain in the
next chapter, should be much harder to detect.”
49 Keith Woollard says: “Surely this is something more appropriate to get posted under “Australian Silliness”
Nah this is Keith: https://www.youtube.com/watch?v=T47Ivf4pxaM :-)
When Aussies are really serious they do things like overturn decades of accepted medical consensus aka “false beliefs” by using Science to take our collective knowledge another step further. http://www.nobelprize.org/nobel_prizes/medicine/laureates/2005/press.html
and
https://theconversation.com/the-future-of-australian-science-a-nobel-prize-winners-view-3865
Climate scientists globally do the same such as those who run and contribute to RealClimate. Listen to them. God gave us all two eyes and two ears so we could all listen and see (aka Learn) twice as much as we can speak. Try it one day. :-)
People laughed out loud at the Papers put out by Darwin and Einstein too. Some still refuse to believe it. Can you believe that? :-)
Back to song birds and the Science:
http://www.sciencemag.org/news/2014/10/fairy-wrens-humans-learn-embryos
http://science.sciencemag.org/content/353/6301/812
http://rspb.royalsocietypublishing.org/content/281/1797/20142089
Read Keith, read! http://www.dictionary.com/browse/read (seriously, do grasp that definition and run with it)
I do not understand why people cite and argue about correlations between CO2 ppm and surface or satellite derived temperature. CO2 ppm effects a radiative forcing in W/m^2 and temperature response to forcing in K is mediated by a host of feedbacks and heat capacities. Considering that ocean absorbs well over nine tenths of the radiative imbalance, surely the best arguments ought to look at ocean heat content ?
As, for example, in
https://www.realclimate.org/index.php/archives/2013/09/what-ocean-heating-reveals-about-global-warming/
sidd
The temperature record from Central England is reproduced in “The rough guide to climate change”. For those who have not gone to the trouble of following the links given earlier, here is my qualitative description:
From 1772 until about 1900 the temperature fluctuates between about +0.1 and -0.9 degrees Celsius (eyeball readings). The zero point seems to be the average for the mid-twentieth century.
From 1900 to about 1980 the temperature fluctuates between about -0.3 and +0.3 degrees. After 1980 it rises almost without pause to +1.0 degrees by the year 2000.
To say the temperature rose quickly in the 1700s is pure nonsense. In crude terms the actual fluctuations amounted to about four or five peaks (depending on how you define them) matched by an equal number of dips — all the way to 1900.
Weaktor,
Thanks for being you. Your very presence on the other side of the climate debate does more to validate the science than anything else you could do.
You claimed no correlation. R-squared measures correlation. Period.
I sometimes wonder how you manage to type the crap you type without bursting out laughing.
Some sufficient conditions for defining a lie are one thing, but I haven’t seen a statement of necessary conditions for a lie.
Anyway, the type of liar Roberts is is one who repeats lies without saying he’s quoting someone else. When you make a claim without citation then it is your claim and you are responsible for your claim.
The Real Victor: https://www.youtube.com/watch?v=9S6i_xLUlkM
Thomas: Emphasis on the word might
AJ: Agreed. You could drop a pencil and it MIGHT pass right through the table, too. When’s the last time you disagreed with anybody about anything significant and heart-felt and they changed their position? 100,000,000 out of 100,000,000 times the person you think you just logically annihilated came away from the conversation smiling about how she annihilated your Idiocy with pure Truth and Logic. I’d bet your life that Roberts is ecstatic at how he totally nuked Cox. (Not my life, though. That pencil MIGHT be on the floor) :-)
———
Chris O’Neill: I haven’t seen a statement of necessary conditions for a lie.
AJ: If you don’t personally believe what you deliberately and without error, hyperbole, or humor espouse or insinuate, or do believe what you omit specifically in order to further your position, you’re lying. Roberts doesn’t appear to be a liar. What he omits is stuff he rejects as errors or lies (like the GISS graph) What he says, he most probably believes. If you visit his pages, he seems authentic and not nearly as idiotic genetically as he’s made himself through serious effort.
Love that Norman Gunston interview!!!
My concern with the article is not the science, that is fascinating. My concern is the link to climate change. No matter what your field, to get noticed you have to have those two words in the press release
BPL: You were wrong, Victor, and you still are. Why don’t you man up and admit it,
AJ: Come on. Why would you expect, no, DEMAND that he do what you’ve never ever done in your entire life? (at least not here) The last incident was when you declared that buying a Powerwall would make a grid connection superfluous. That was at least as laughably wrong as anything Victor has ever said, yet you didn’t man up and admit your error.
So, are you saying that you were right about the Powerwall and Tesla (and everybody who’s ever lived off the grid) is full of crap with regard to their product, or are you saying you are not just as bad/even worse than Victor, but also a full-blown hypocrite?
” The average American household (of which there are about 115 million) uses 30 kWh per day of electricity” and “For off-grid applications, the rule of thumb is to have enough storage for three days of zero input. ”
http://physics.ucsd.edu/do-the-math/2011/09/got-storage-how-hard-can-it-be/
So, 90KWH is needed and the Powerwall is 6.4KWH, so the average home requires 14 Powerwalls. (Off-gridders usually get their consumption MUCH lower, but that’s a different topic)
How about a REAL response this time? You NEVER give a real response, ever. You pontificate falsely, I call you on it, and then you whine about my social skills, or lack thereof. Yep, I’m caustic, but you’re generally wrong and never admit it.
So, to paraphrase you, why don’t YOU man up and admit that a Powerwall will not allow the typical homeowner to go off grid?
Psychology is interesting, and you’re a grand case….
Oh, and that claim about how scientists are fighting hand over fist to admire your papers and help get them published… I noted that the only paper you’ve mentioned here was summarily rejected (because it was laughable?) and asked for a list of your vast work. Crickets, as always, responded. (or did I miss your response? Unlike you and your twin Victor, I’ll happily admit my error if so. I cherish admitting when I’m wrong, as it shows character.)
(I apologise to you, Victor for lumping you with BPL.)
Just in case anyone is unaware: Realclimate (Gavin), in 2007, dealt with one of Robert’s confusions – about temperature adjustments concerning the contiguous USA in the 1930s vs recent,- here:
https://www.realclimate.org/index.php/archives/2007/08/1934-and-all-that/comment-page-13/
The adjustments made small changes to the USA temperature record but had an “imperceptible” effect on global temperatures, contrary to Robert’s ignorant witterings.
“where in all cases 2015 is cooler than 1998” – Victor
Liar, Liar.. Pants on fire.
In instance does the satellite data show what you claim Victor.
You aren’t even able to use the plotting tool you link to properly.
The default running averaging period is 1 year, so 1 years worth of data is excluded from both endpoints. That is made obvious from the plot itself.
That means of course that since all temperatures in the months Sept,Oct,Nov,Dec 2015 are excluded from the plot.
So your claim about 2015 is a lie since insufficient time has passed to include all of the data in 2015.
Now if you shrink the running averaging period to zero so only month by month data is shown, in all cases the 2015 temps are higher than 2009. So again you are a liar.
So in all cases you are a liar Victor.
AJ 74, in his typical, charming manner: Psychology is interesting, and you’re a grand case….
Oh, and that claim about how scientists are fighting hand over fist to admire your papers and help get them published… I noted that the only paper you’ve mentioned here was summarily rejected (because it was laughable?) and asked for a list of your vast work. Crickets, as always, responded. (or did I miss your response? Unlike you and your twin Victor, I’ll happily admit my error if so. I cherish admitting when I’m wrong, as it shows character.)
BPL: I did list my publications. Apparently you missed it. No surprise there. You might make that claim again after I list them here, again.
I made no claim about scientists fighting to help me publish. That’s merely your fantasy of what you would like me to have said.
Apparently you missed the list. Here. Try to read it again. If you post one more time that “the only response was crickets,” I will reach through the screen and slap you.
Peer-reviewed:
Levenson, B.P. 2015. “Why Hart Found Narrow Ecospheres–A Minor Science Mystery Solved.” Astrobiology, 15, 327-330.
Levenson, B.P. 2011. “Planet Temperatures with Surface Cooling Parameterized.” Advances in Space Research, 47, 2044–2048.
Non-peer-reviewed:
“Statistical Data on Orthoselection for Intelligence.” Tripolitan (J. Tripoli Sci. Assn.) 15, 5-10. Levenson, B.P. 1983.
“Social Design Considerations for a Lunar Colony.” Selenology 6, 22-28. Levenson, B.P. 1987.
“An Examination of Jules Verne’s Moon Gun, ‘Columbiad’.” Selenology 7, 19-21. Levenson, B.P. 1988.
“Analysis of the August 17, 1989 Total Lunar Eclipse.” The Strolling Astronomer (J. Am. Lunar Planetary Soc.) 38, 61-64. Graham, Francis G. and B.P. Levenson 1995.
“Get Your Stars Straight.” The Lyriodical, 3rd Quarter 2009.
Levenson, B.P. 2015. Accuracy Check on Predictions of Near-Term Collapse. Brit. J. Sci. 13, 8-20.
Victor complains of a so called “lack of scientific understanding”, but shows his own massive lack of understanding when he calls basic statistics arcane, and appears to think the satellites measure the same thing in the same way as surface data like giss.
It’s gobsmacking really. Hilarious beyond words. I can’t believe he really believe his own complete rubbish, and must be from a lobby group of some kind, trying to muddy the waters.
BPL,
Thanks for the list of your two peer-reviewed articles. I didn’t see your first post. Very good and I applaud your efforts. Unfortunately, only the abstracts were available in my rather short search. Are the full texts available?
But, of course, you totally ignored the main point, that the Powerwall is inadequate as a substitute for a grid connection, and even if one did string 14 Powerwalls together, it would be just about the most expensive and least efficient way to go. Are you going to man up and admit your error, as you demanded of Victor, or are you not just wrong by over an order of magnitude in capacity and maybe, I dunno, two or three orders of magnitude in cost, but also a hypocrite?
So I note that, again, as always, when you make a flagrant error and I call you on it, the only response is crickets. (How could you not see this comment coming?)
My suggestion is that you restrict your posts to subjects on which you have at least a tiny bit of knowledge, and that you do a cursory search to see how your bit of knowledge might be cultivated into something productive. That way you won’t have to sit there stewing about how somehow I caused the embarrassment you bring upon yourself with so many of your dashed-off posts about stuff of which you haven’t a reasonable grasp.
As to my colorful hyperbole about peer review and how it relates to you, I thought you were a writer. Most writers recognize such techniques. I suppose I shouldn’t be surprised that you don’t, or, more likely, that you choose to pretend to be stupid when it suits your purposes. Do you actually think that appearing stupid is somehow an effective insult about me? (Though I must admit that a while ago I did something at least similar when I took your typo “wind and nuclear alone” at face value. That was wrong of me and I apologise.)
Again, congratulations on getting published. Well done! (Now man up about the Powerwall and you’ll probably be rewarded by my dropping dead of a heart attack in surprise!) (Cue the crickets)
> Alfred Jones
Dear hosts, would you verify that this guy isn’t someone old and familiar back under a new name? check IP address?
Just seems oddly like a blast from the past.
No offense to Al, AJ, or whoever you are, if you’re real. It’s the exceptional verbosity that fails the smell test, to mix a metaphor.
#76 Vendicar: Here’s another satellite graph, courtesy of Tamino’s website: https://tamino.files.wordpress.com/2016/03/compare.jpg
Here’s the context: https://tamino.wordpress.com/2016/03/02/new-dataset-from-rss-end-of-the-satellite-pause/
As you can see, Tamino’s post is dated March, 2016. And as you can also see, the temp. for 2015 was considerably lower than that for 1998. Even if the data for 2015 is incomplete, it’s very hard to see how the difference could be made up in a few months.
Victor (#80), try reading the paper from which Tamino borrowed the graph. As you can see, the paper was submitted to the journal in the autumn of 2015, so would have been written much earlier in the year. As you can also see (Table 1), the study includes data only through December of 2014.
#80 Victor
The actual paper that the chart came from was submitted in October of 2015. Seems the 2015 data would likely be quite incomplete. Regardless, on said chart, the spike that occurred in 1998 happened very very quickly, so yes, with an el nino event, the difference could easily be made up in a few months.
In my humble opinion the most appropriate way to bring issues of concern to the attention of RC, say regarding ‘posters’ ‘site issues’ ‘errors’ whatever, would be to use your personal email and direct your concerns privately to contact-at-realclimate.org (see about page)
I see Victor still cannot comprehend the difference between a modern day satelite temperature record and all the others … that rather than undermine the previous data sets showing / proving / emphasising / projecting further global warming that them there satelite data actually confirms it.
Educational refs for those surfing the web and stumbling across agw/cc science deniers and their high priests. (topics may fit some and not others – use with caution)
We know that online trolls score high on the so-called Dark Tetrad of personality traits—narcissism, sadism, psychopathy, and Machiavellianism.
https://www.psychologytoday.com/blog/your-online-secrets/201608/why-internet-trolls-enjoy-making-you-feel-bad
http://www.sciencedirect.com/science/article/pii/S0191886916307930
and 2014
https://www.psychologytoday.com/blog/your-online-secrets/201409/internet-trolls-are-narcissists-psychopaths-and-sadists
http://www.sciencedirect.com/science/article/pii/S0191886914000324
https://en.wikipedia.org/wiki/Hubris
https://en.wikipedia.org/wiki/Grandiosity
https://en.wikipedia.org/wiki/Peter_principle
https://en.wikipedia.org/wiki/Dunning%E2%80%93Kruger_effect
Narcissists & Sociopaths (ASPD) Are Dangerous!
https://www.youtube.com/watch?v=Y-rPTGt1w1o
Who are Pathological Narcissists? Knowing about NPD, BPD & ASPD
https://www.youtube.com/watch?v=o7j2axIRja4
Narcissists (try to) Destroy Who they cannot Control
https://www.youtube.com/watch?v=8JAUzP4b1X0
http://www.mayoclinic.org/diseases-conditions/narcissistic-personality-disorder/basics/definition/con-20025568
http://www.narcissistic-abuse.com/faq1.html
http://psychcentral.com/disorders/narcissistic-personality-disorder-symptoms/
It happens sometimes :)
—
A question: I have a vague memory of years ago someone ‘denier/pseudo stats dude’ was hassling nasa/giss for their raw data of what they used to feed in the avg/mean models for global temps… saying that the adjustments being made was being done to over-state the extent of warming?
Maybe i saw it talked about here too but I can’t recall who what when. If you do can you please pass on some urls or keywords/names about this so I can find it and use it to slip under Marohasy’s conspiratorial rhetoric (aka lunacy/deceit) re Prof Cox, graphs, today is as warm as 97/98 was etc? My gosh some people are funny/sad/mad all at the same time. ;-)
At least it has reminded me why denialist websites ain’t worth an single atom of Carbon and why I rarely if ever bother. But she’s yahooing about a 60 plus page papers she’s “gunna” publish soon that ‘proves’ the corruption/manipulation of data by Bom/GISS etc she keeps rambling about this thing called ’empirical evidence’ like Roberts did on the Q&A program.
And she still does not believe that ‘evil/nasty/wrong’ Gavin dude about #itsnotrocketscience lol, oh boy.
Ooops, I’m a silly aussie!
1934 and all that & Steve McIntyre
Filed under: Climate Science Instrumental Record — gavin @ 10 August 2007 “Another week, another ado over nothing.”
Thanks 75 Slioch we’re on the same page. :)
#82 and #82. Sorry about that. You’re right, Tamino’s graph covers temps. only through 2014. Here’s another try, using the SkepticalScience trend calculator: https://www.skepticalscience.com/trend.php
This time set the Moving Average to 0 months and the end date to 2016.
Thomas @31
Here is a youtube version of the question. https://youtu.be/YAmDu3-bU88
try this for a challenge (posted on the Conversation after the QandA episode):
https://theconversation.com/our-planet-is-heating-the-empirical-evidence-63990
Alastair B. McDonald @52.
I don’t know whether you are saying that Malcolm Roberts presents an explanation in the video clip or whether you expect him to appear here to explain himself. Whichever it is, I don’t see either route presenting an explanation for us.
In the video clip Malcolm Roberts is saying that there is a period at the end of the 1600s/beginning of the 1700s in the CET record when there was a temperatures rise greater and faster than any rise in recent decades. The early years of this CET record are a bit of a challenge, more a best-reconstruction of temperature than an instrument temperature record. Within the technology of temperature recording, the landmark is Fahrenheit’s invention of both the mercury thermometer and his temperature scale in the 1720s. So it is no surprise to see the monthly data in the early years of the 1658-to-date record being in whole degrees Celsius and being reliant on very few & unlikely sources. (See Manley (1953) and Manley (1974) for details.) So comparing in detail seventeenth century CET with recent CET is a bit apples-&-oranges.
That said, the CET (10-year averages – Wiki graph here) shows a rise 1966-2001 of 1.220ºC in 35 years. In the following 9 years (to 2010, which provides the latest 10-year average 2006-15) temperatures have dropped back by 0.322ºC. Malcolm Roberts could be comparing the 1966-2001 rise with the years 1695-1710 which yields a rise of 1.222ºC, a faster rise but not very convincingly “greater than the latest warming that finished in 1995” and so apparently not ending in 2001, according to Malcolm Roberts. (In terms of warmest years rather than warmest 10-year periods, 2014 holds the record with 2006 in second place.) Or he could be comparing the latest 1966-2001 warming with 1695-1733 which yields a rise of 1.796ºC over the 38 years, a greater rise but not convincingly faster. And it should be mentioned that the 35 years that precede all this 1695-1733 rise, the first years of the early-extended CET, we see a 1ºC drop in temperature which the following ‘greater and/or faster’ rise was but reversing,
And of course, this pedantic analysis has diddly-squat relevance to global temperature records. But the video does give us ample evidence to show that Roberts is incapable of relevance when offering numbers to support his delusions.
AJ: If you don’t personally believe what you deliberately and without error, hyperbole, or humor espouse or insinuate.
The word “if” implies a sufficient condition (for a lie in this case). i.e. it is not a statement of necessary conditions for a lie.
Victor:
I don’t know what you can “see” Victor but my eyes tell me that that graph: https://tamino.files.wordpress.com/2016/03/compare.jpg only includes data to the end of 2014.
Perhaps you need to get your eyesight filter fixed Victor.
Hank Roberts: Dear hosts, would you verify that this guy isn’t someone old and familiar back under a new name?
AJ: The moderators have been explicit: Posters must use a single name for comments attached to a single post, but changing names between comment sections is not discouraged in the slightest.
Your attempt to instigate a witch hunt to invade my privacy disappoints me. “No offense to AJ” – There aren’t many explanations except insult. Care to enlighten as to your motivation?
Again, congratulations on getting published. Well done! (Now man up about the Powerwall and you’ll probably be rewarded by my dropping dead of a heart attack in surprise!) (Cue the crickets)
Comment by Alfred Jones — 21 Aug 2016 @
AJ, Congratulations on being a complete asshole. You make it look so easy even a caveman can do it.
87 Glenn Tamblyn, Do I detect a slight hint of dismissive ridicule in your question? Good work mate. LOL
Roberts may help to blow the lid off the degree of fraudulent denialism downunder in time. I can’t wait to hear what he says under Privilege in the Senate in coming months. I may be dreaming but have a feeling he will not last 18 months. The old “give a man enough rope and ……. ” applies.
88 mary voice, wow thanks for that one. I didn’t know that technique existed. Can’t wait to use that one for Jennifer Marohasy BSc PhD and her cheer squad.
[…] someone asked: “Does Jennifer believe that NASA and the UN are faking temperature data?”
I replied: “I don’t believe that NASA and the IPCC are faking the data: I provide compelling evidence to show this. Indeed, they, and the Bureau of Meteorology are remodelling temperature series so that they fit the theory of anthropogenic global warming. In the case of both Amberley and Rutherglen cooling trends have been changed into warming trends without any reasonable justification.”
http://jennifermarohasy.com/2016/08/speaking-truth-to-power/
Won’t make a molehill of difference (who’d believe a Geologist or any Scientist right?) but that’s ok. One day the denial will become undeniable.
Then I can say: “That’s ok Jennifer, we all make mistakes mate. We’re only human!”
86 Victor: Can’t you deniers fund your own Trend Calculators and rigorous software systems to prove how right you are?
Man, if you were a country going to war, you’d send your enemy a note asking if you Lease some of their weapons for the duration.
Victor (#86): To include the most recent data, set the end date to 2017. As you can see, the recent values comfortably exceed the 1998 peak in all RSS versions.
#97 Spilgard: “To include the most recent data, set the end date to 2017. As you can see, the recent values comfortably exceed the 1998 peak in all RSS versions.”
Yes, of course. But the dispute that started this exchange (some time ago) centered on a claim that, according to the satellite data, 2015 was cooler than 1998. I defended that claim and as a result was accused of lying.
Now as far as the most recent data is concerned, that’s misleading, because 2016 is far from over. No question we’ve been seeing extremely high monthly temperatures of late and that trend could continue. Or not. We’ll have to wait and see.
AJ: (Now man up about the Powerwall and you’ll probably be rewarded by my dropping dead of a heart attack in surprise!) (Cue the crickets)
BPL: Why you want to hear about the Powerwall in terms of crickets escapes me, but I’ll do my best.
A Tesla Powerwall(R)(c)(TM) has a mass of about 97 kilograms and stores 6.4 kilowatt-hours of energy, which it can release at up to 3.3 kilowatts of power.
Crickets are a family of insects, Gryllidae. An average adult cricket has a mass of 2.65 x 10^-4 kg. If we assume this is all carbohydrate or protein, this is equivalent to 1.06 kilocalories of energy or 4.435 joules. Utilization is undoubtedly only a tiny fraction of this; perhaps 10^-6 without feeding again, which would imply a cricket operates at a power level of c. 4.4 x 10^-6 watts.
The Tesla Powerwall(R)(c)(TM) therefore exceeds a cricket in mass by an average of 366,000; in energy storage by a factor of 2.304 million; and in power by a factor of 750 million. In other words, it would take three quarters of a billion crickets to produce the maximum power capacity of a single Tesla wall!
I think the facts speak for themselves here.
Was that what you wanted?
Cox, etc were asked for evidence of Man induced climate change. He replied with graphs ready showing global warming, but he could not supply such evidence for AGW. His non-reply is further confirmation that there is no such evidence.
Anybody like to try helping out?