Some of you that follow my twitter account will have already seen this, but there was a particularly amusing episode of Q&A on Australian TV that pitted Prof. Brian Cox against a newly-elected politician who is known for his somewhat fringe climate ‘contrarian’ views. The resulting exchanges were fun:
We've had a pause in warming & NASA corrupted data, says Malcolm Roberts. @ProfBrianCox examines the graphs #QandA https://t.co/HTNk4Bzrk1
— QandA (@QandA) August 15, 2016
The insinuation that NASA data was corrupting the data, lead to the following series of tweets:
Some thoughts on climate deniers (no other word suffices in this case), who accuse my team of fraud. 1/nhttps://t.co/CcCJnlPd3b
— Gavin Schmidt (@ClimateOfGavin) August 15, 2016
The analysis has only ever used publicly available data, analysis code has been public since ~2007 & has been independently verified 3/n
— Gavin Schmidt (@ClimateOfGavin) August 15, 2016
Link here: https://t.co/5rGGCxVXBp 5/n
— Gavin Schmidt (@ClimateOfGavin) August 15, 2016
These changes are small compared to overall trends. Interactive plotter available here: https://t.co/t7wFU3ofev 7/n pic.twitter.com/9gFMzktEzO
— Gavin Schmidt (@ClimateOfGavin) August 15, 2016
So I'm flummoxed. Where do these ppl feel data manipulation is happening? It's not in inputs or the code or presentation. So where??? 9/n
— Gavin Schmidt (@ClimateOfGavin) August 15, 2016
Refusal to see this, cries of 'show me the data' when all data is accessible at a click, can only be described as denial (sorry) 11/n
— Gavin Schmidt (@ClimateOfGavin) August 15, 2016
Oops. Just added to the conspiracy theories by linking to an internal server(!) Here is the public version: https://t.co/nALWMlNDcP 13/12
— Gavin Schmidt (@ClimateOfGavin) August 15, 2016
By coincidence, yesterday was also the scheduled update for the GISTEMP July temperature release, and because July is usually the warmest month of the year on an absolute basis, a record in July usually means a record of absolute temperature too. A record February (as we had earlier this year) is generally with respect only to previous Februaries, summer temperatures are still warmer even if the anomaly is smaller. And so it proved…
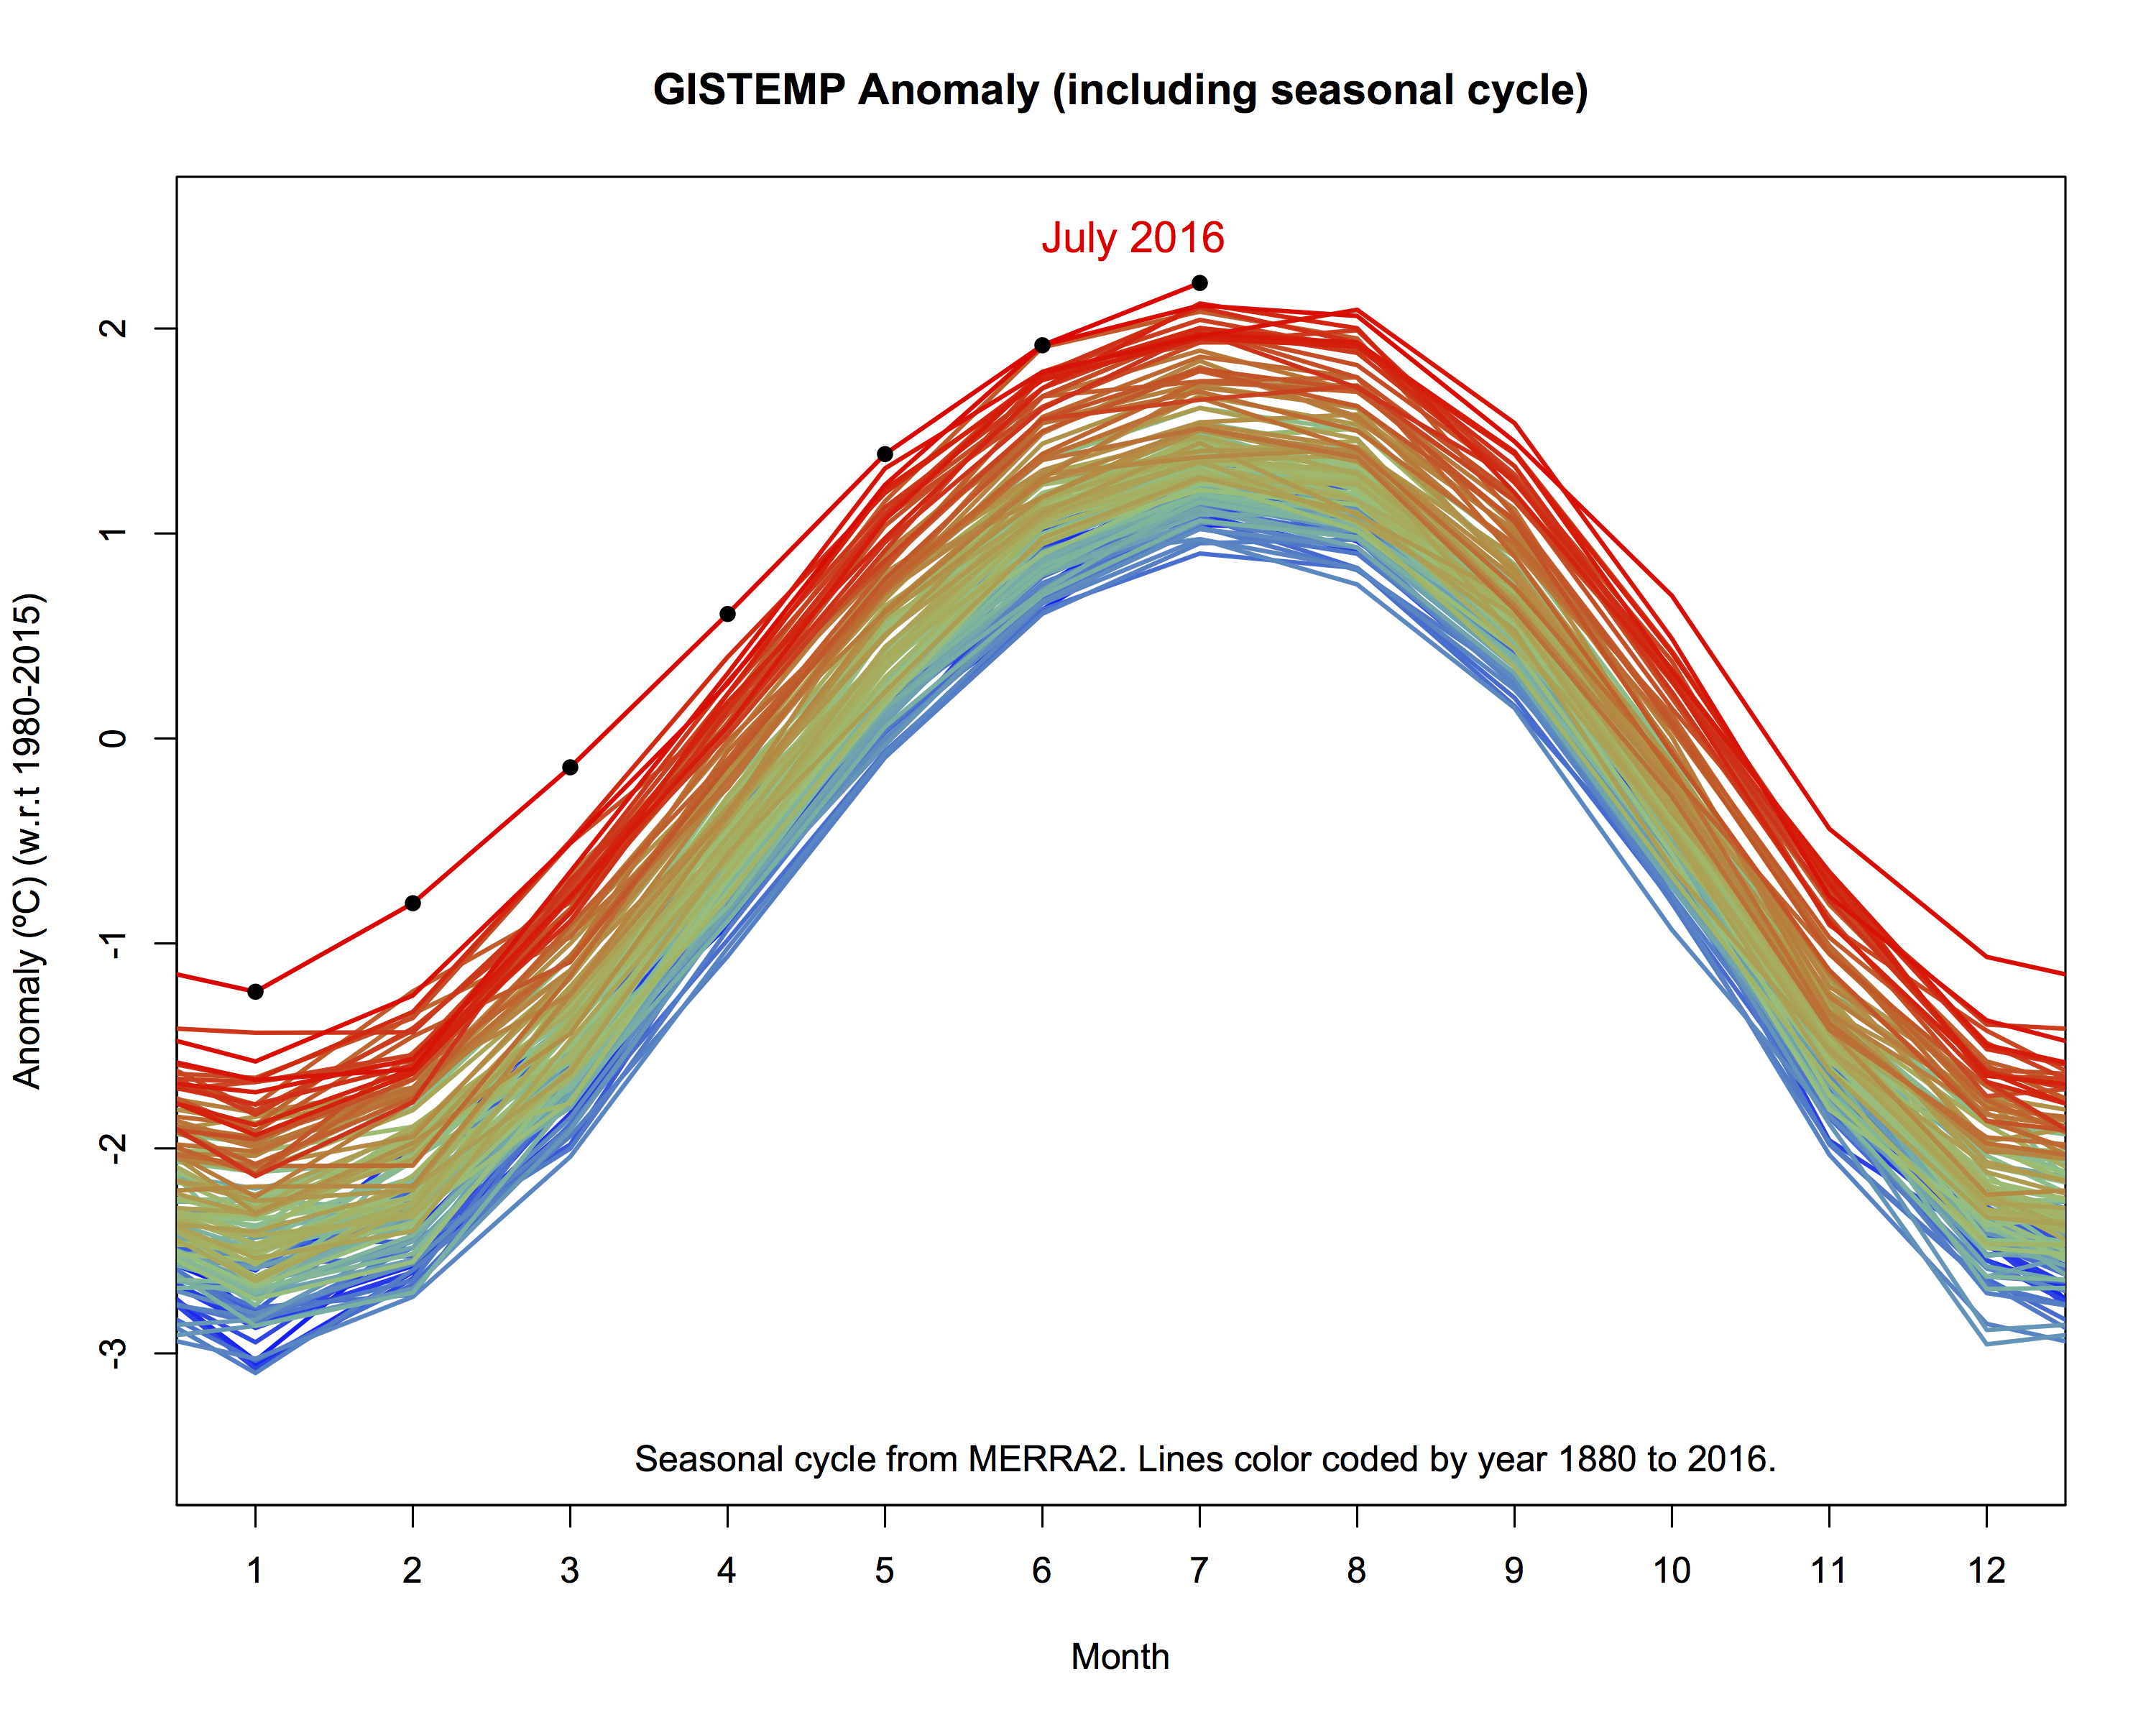
Normally we just plot the monthly anomalies (with respect to each month), but here I used the estimates of the seasonal cycle in temperature from MERRA2 to enhance the analysis so that months can be compared in an absolute sense.
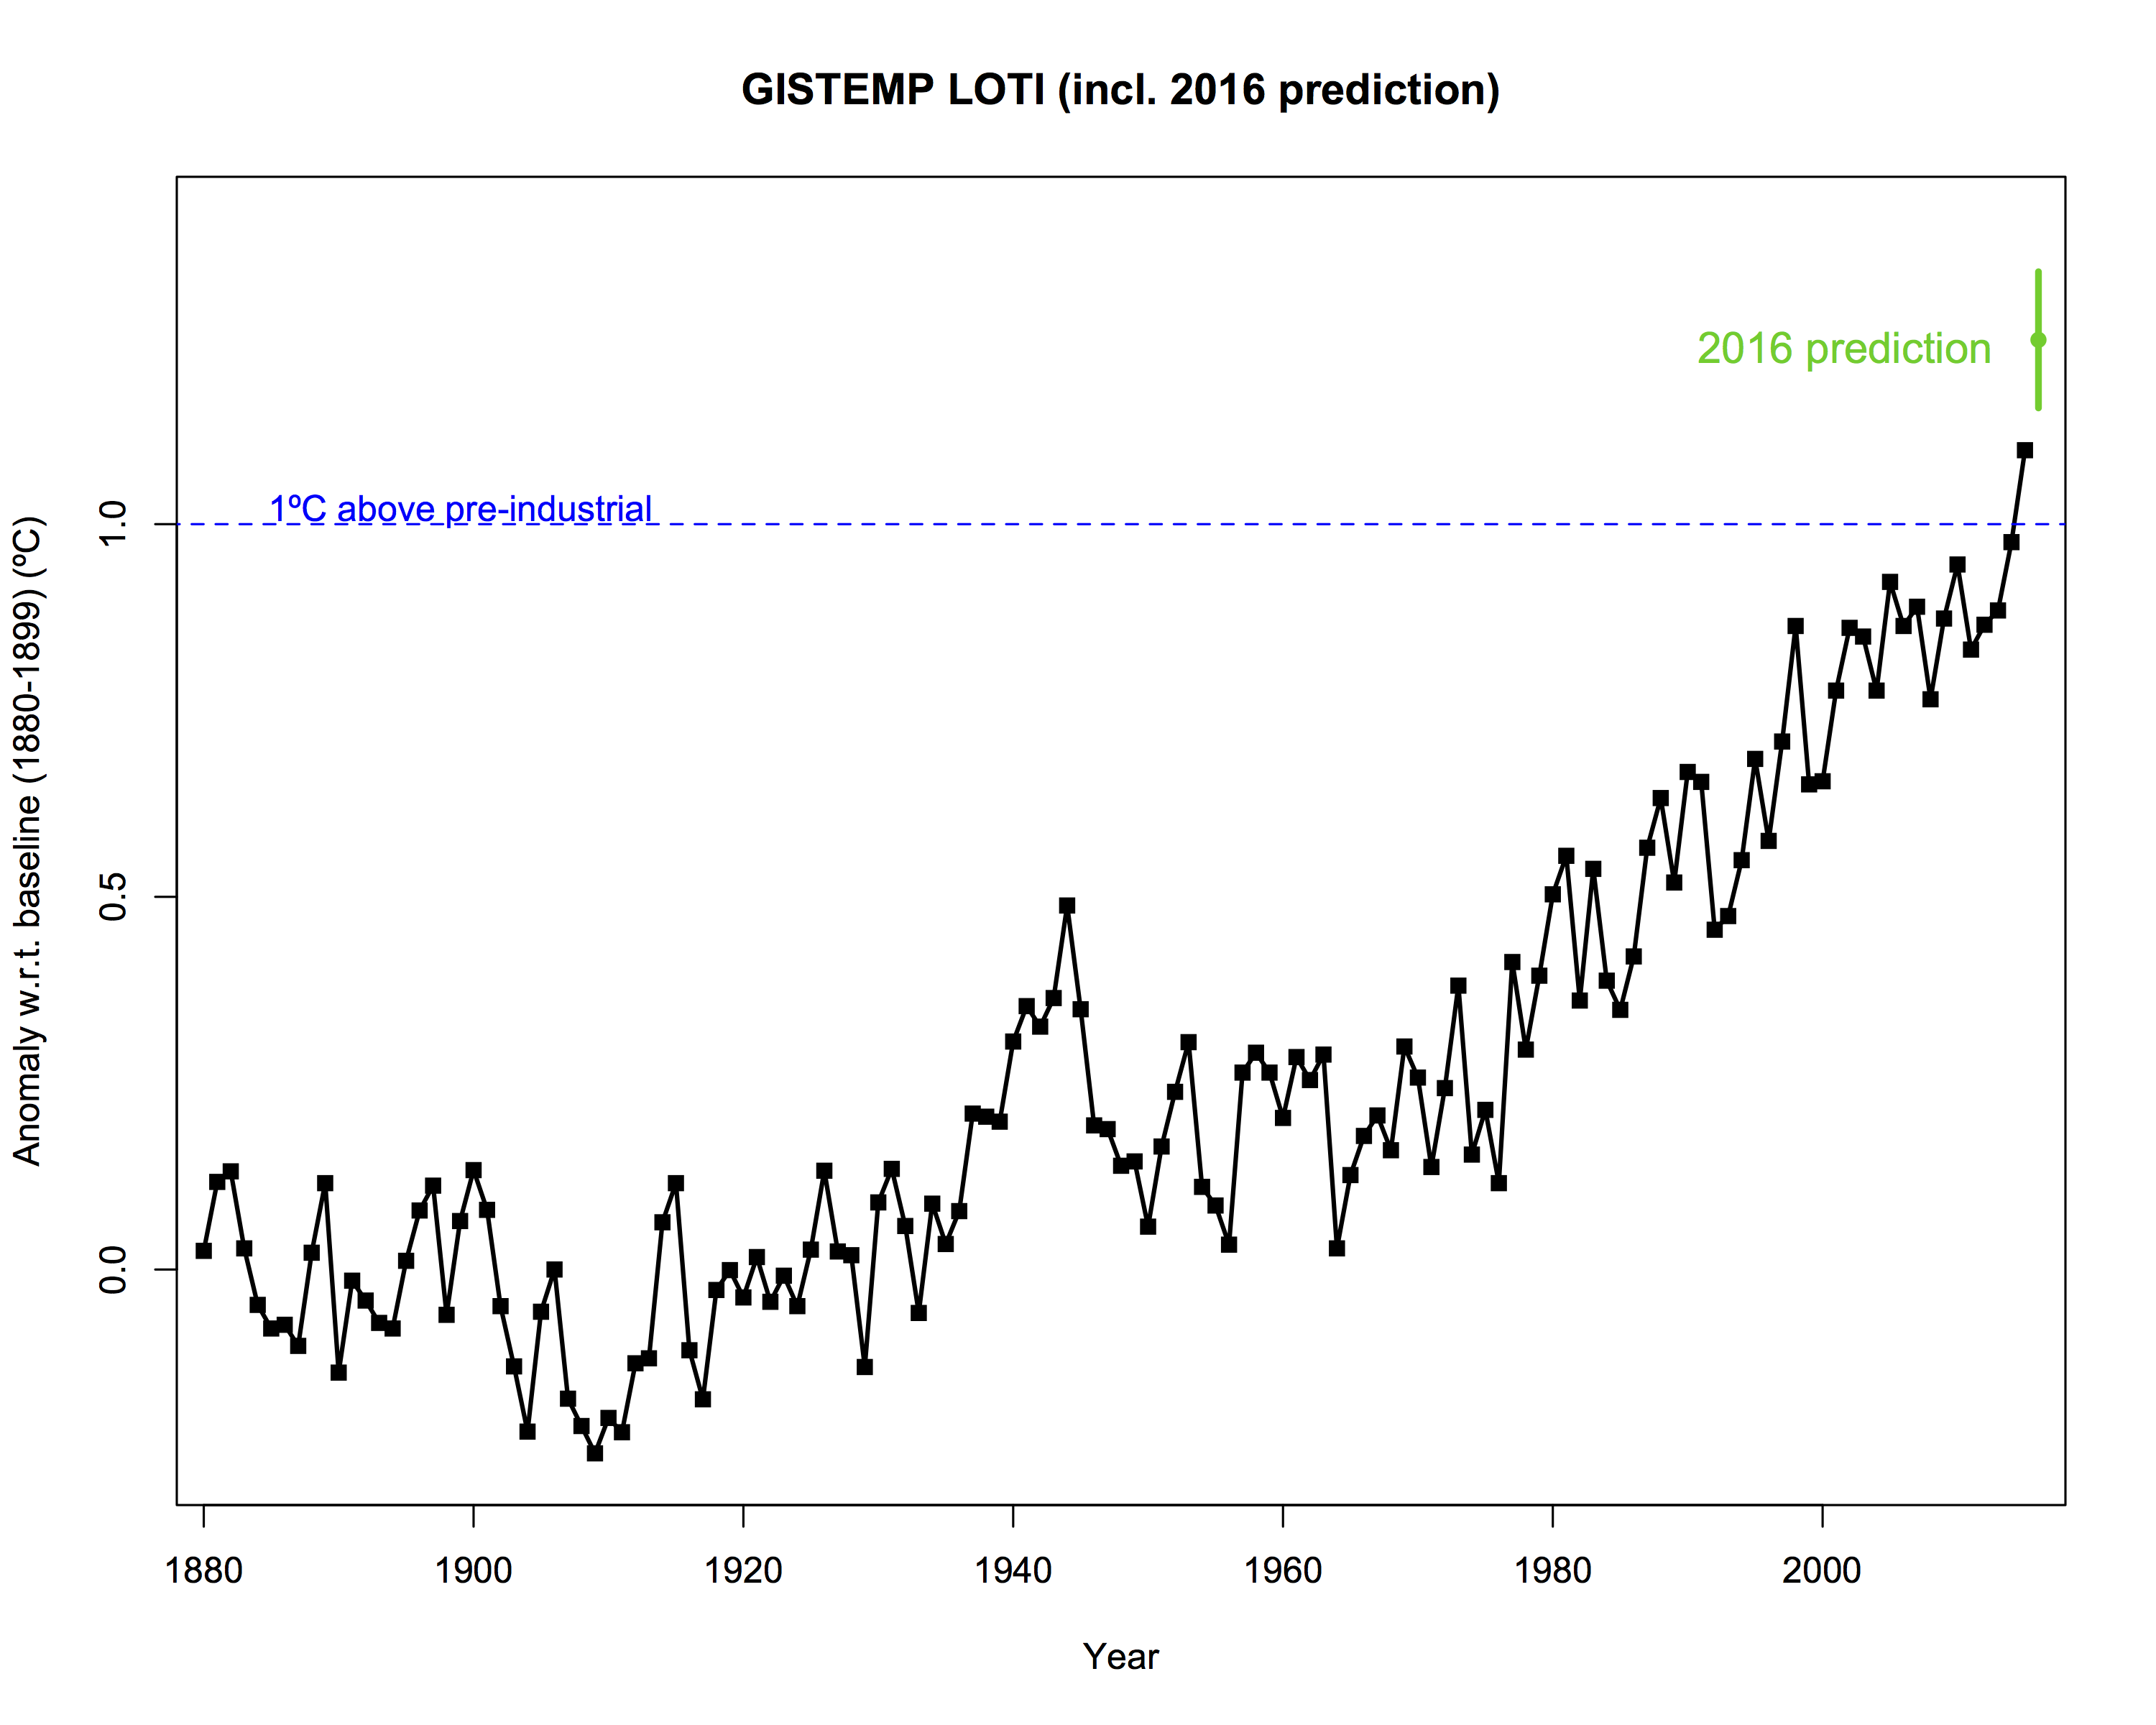
This string of record-breaking months is coming to a close now that El Niño has faded, but it is sufficient to give a very high likelihood that 2016 will be a record warm year in the surface records.
Gavin, thanks for all your work.
140 – “stretching like a finger more or less towards the north pole.”
That finger won’t be there by the end of the melt season and since the melt rate is largely a function of perimeter, the melt rate will be relatively rapid for this time of year.
Eyeballing things, I expect a minimum of slightly less than 4 million square kilometers.
130 – “Therefore CO2 at 0.04% has only a tiny effect”
Your reasoning is tiny = nothing?
Is 1/300 tiny? Is it nothing?
Isn’t it the warming we have already experienced?
Oh dear, another Galileo wannabe:
Peter Carson wrote: “It can be shown that AGW via CO2 is not possible.”
Then show it. In the peer-reviewed literature. Your Nobel awaits.
Piotr: why, when Hank asked about your previous identities,
AJ: I don’t remember that. He asked the moderators to invade my privacy by seeking out my current? past? IP addresses, but I don’t recall him asking me to divulge past handles. Maybe he did. You can look if it concerns you.
But since you asked, my longstanding handle here was “ManyAndVaried”. There have been a couple others, but ManyAndVaried, Alfred Jones, and OnlyKindnessMatt encompass the vast majority of my internet discussions.
Th: Thanks again for the endless confirmations. The Church is THAT WAY ——>
BPL: What the cake said to Alice.
Al/Many/Only — your IP address is not private to anyone who manages any blog where you post.
It’s one of the basic tools used by the Internet. You should understand this before using a networked computer.
https://www.google.com/#q=is+IP+address+private%3F
Hosts may want to identify sock puppets or a discredited former poster using a new name to soak up more of the attention given the new and uneducated poster, because gaming the hosts to waste time is a familiar tactic.
You say you don’t resemble any of those remarks, aren’t pretending to be more than one individual, and not here to waste the hosts’ time?
Then you have no worries.
PS for Al/Many…Varied/Alfred/Only…Matt:
https://news.slashdot.org/story/16/09/02/226226/feds-spend-nearly-500k-to-combat-online-trolling
Er, Al, you’re having us on, or confused about something fundamental.
> my longstanding handle here ….
It’s easy to find out what’s been posted using either “ManyAndVaried” or “OnlyKindnessMatt”
This isn’t invasion of privacy.
Put it in your search — like this, to limit the search to this site:
https://www.google.com/search?q=site%3Arealclimate.org+%E2%80%9CManyAndVaried%E2%80%9D
https://www.google.com/search?q=site%3Arealclimate.org+%22OnlyKindnessMatt%22
#153 Vendicar.
It’s a pity you didn’t read to the end of my sentence you quoted, ie
“Therefore CO2 at 0.04% has only a tiny effect, and GE is constant (global average).”
#154. Jim Eager.
Try thinking for yourself. I’ve presented the evidence in my site for anybody to read and comment upon. Apparently you are unable to do so.
(Getting non-AGW material published is difficult; I gave evidence of this in my site. Even several of my comments here have not been shown.)
I had actually replied to your comment – but which wasn’t published. I’m sorry I didn’t look earlier at your Foote reference. (I’m impressed; how did you get such a reference?) There are a number of problems with the experiment. For example, in her experiment, it was noted “carbonic acid gas” reached a higher temperature – rather in line with the specific heats of the respective gases. . How could one do experiments properly if the gas contents were at different temperatures? I’ve never seen such a result; one would think such a result would be well-known.
My own PhD involved monitoring the mixing (ie diffusion) of various gases within stainless steel columns. We used thermistors to measure the rate, but could also measure the temperature within. (Easily monitor +/- 0.005C.) Loading each gas from a pressure into a vacuum causes a temperature change, but this eventually disappears. All gases reach the same temperature – even if they are not IR gases.
Moderators
Surely Chris O’Neill’s #143 needs to be tossed in the borehole with an apology for letting it through
Answering all these bogus arguments may seem pointless – feeding trolls etc. – but remember, there are people other than the interlocutors who find these pages. This stuff is out there – bizarre and ludicrous though it may seem to those who read the literature.
Rebutting it has a purpose, even if it times it feels like bashing your head against a wall.
There is a vast amount of literature out there for those who really want to learn including links on this site. And a lot of the published science is accessible and easy to find via Google Scholar. Roberts claims that the warming cycle ending the 17th going into the 18th century was faster and bigger than the modern one he picks out. The data actually shows cooling over the time period he picked out. But never mind, even if there is a CET period with faster and bigger warming than any today, that’s not warming of the whole planet. There are other people out there who make similar points about local warming; even if true, those can only be about local trends that can be influenced by many factors that change the local but not global distribution of energy around the planet. Unless you have evidence that these local records align with others with a similar trend, you have no information about the planet as a whole.
Also Cox, points out that it is not just about the trend line and correlation between temperature and CO_2 – but also understanding the physical mechanisms, which we’ve understood since the 19th century. And he did offer to give a lecture on those. Of course the deniers hear what they want to hear.
A few other details missed: the Central England temperature record does not go back to the mid-1600s in full detail. The daily record goes back to 1772; monthly to 1659. I don’t know who claims the 17th century had the hottest period; WikiPedia has the full range and reports the highest temperature as being in 2014.
All pretty embarrassing really. In defence of us Australians, Roberts got 77 first-preference votes. 77 -that is all. But he got there on preferences, that’s the way our system works. There’s a good chance he’ll get the flick at the next election and then go back to howling at the moon and chasing his vestigial tail.
Thanks for your efforts Gavin Schmidt.
Peter Carson,
400 ppmv equates to about a gauntlet of nearly 2 billion CO2 molecules an IR photon must pass within a wavelength of on its way out of the atmosphere. It only takes one to stop it. Maybe you should crack a book.
Peter,
I would also note that >10% of those CO2 molecules are above the cloudtops where CO2 is the dominant greenhouse gas.
Blog science doesn’t count, Peter Carson. Neither do protests that it’s too difficult to get your evidence published in the peer-reviewed literature. Time to put up or shut up, as they say.
160 – “Therefore CO2 at 0.04% has only a tiny effect”
Your reasoning is tiny = nothing?
Is 1/300 tiny? Is it nothing?
Isn’t 1/300 of the distance from absolute zero the warming we have already experienced?
Isn’t the CO2 induced portion of that warming only a fraction of that 1’C
Unless there is another Double Dissolution, which itself is extremely unlikely, then it is almost certain that Roberts will get the flick at the next election. But if he does some damage then the damage will be permanent, like a previous Senator (Fielding) who was elected with a dodgy preference deal. The circumstances leading to Roberts’ election aren’t quite as dodgy, but they’re still unusual.
#163 Keith Woollard
Perhaps the moderators believe that the intellectually dishonest, like Victor, don’t deserve to be treated with kid gloves.
By the way, how are you going with learning about people who deny there is as much global warming as, for example, GISTemp says there is, Keith?
This proves what? it’s dark inside stainless steel columns?
Peter Carson:
It always comes back to the Great Conspiracy.
From a member of the Great Conspiracy.
Thanks for the clarification Chris
I didn’t realise the policy didn’t apply when you disagreed with the other person
“Therefore CO2 at 0.04% has only a tiny effect”
Try adding .04% of carbon black to a swimming pool, say 1000 liters to a 2.5 million liter Olympic size pool, and you’ll see just how much effect .04% can have. CO2 is akin to carbon black for 15 micron wavelength IR photons. Butt then someone with a phd in physical chemistry should know this.
Looking at the annual data points in the graph and noticing that 2016 appears to be the first time that we will have posted 5 consecutive years with temp average increasing each year. Looks like there are several 4 year timeframes: one starting around 1950, another starting around 1964, another 1985, then another around 1992. I think the probabilities and intervals between the 4 year continuous heat rise will crunch out to be significant and indicative of increasing temps and the shortening interval between 4 year increases, and the high probability of the first 5 year continuous increase time frame (beginning 2011) are describing a heat increase level rate that is increasing. Not just the absolute heat rising, but the rate of increase also rising. The data points are right there on the graph. Crunch the numbers if you want to confirm or deny my sense of increasing rate of increase. The big question is what do we see in 2017, but we have to wait on data to materialize unless someone can do the time warp and go get some for us right now. I will be kind of exciting if we jump right over the 5 consecutive year record in 2017 and jump into a sixth year of consecutive higher temp! That should be hard because 2015/2016 have the EN heat bump. If I was betting man, I would bet on 2017 ending the run and posting lower than 2016.
I think some of the Aussies are doing a good job of denying the data, but we Yanks are pretty darn good at it, too. I would put Imhofe up against Roberts. Is there anyway Roberts is sillier than Imhofe? Is it illegal to waterboard elected officials under extraordinary circumstances? Maybe the slope is just too slippery to go there. Above my paygrade to figure that stuff out.
Warm regards
Mike
For amusement, I’m computing Peter Carson’s Crackpot index, with additional scoring by Crackpot index redux. He’s at well over 200 by now, but many items in those lists are specific to theoretical physics. Is anyone developing the climate-science equivalent of Baez’s seminal work? Skeptical Science’s list, with points assigned to individual AGW-denialist arguments, could be a place to start. Anybody else?
Keith Woollard:
was intellectually dishonest.
Fixed it for you Keith.
175. “Butt then someone with a phd in physical chemistry should know this.”
So many denialists with only a grade school education have imaginary PHD’s.
@48 Mal Adapted says:
“The increase in the atmosphere is about half the amount that has been released by burning fossil fuels in that time. The rest has been absorbed by the oceans, the biosphere and the crust of the Earth. Net absorption means that the oceans, biosphere and crust are sinks, not sources, of CO2.”
By coincidence I have been debating a denier on another forum and have suggested he read this recent IUNC report on ocean warming.
https://portals.iucn.org/library/node/46254
Warning full PDF is almost 20 Mb.
In any case the take home message from the report is that the converging empirical evidence from multiple diverse fields of scientific inquiry are telling us two things. 1) That Houston, we have a problem, and 2) we are the the cause of the problem mostly due to our burning of fossil fuels and CO2 emissions.
Cheers!
> Crackpot index
It’s interesting to look at the response from the climate deniers who’ve been checked on it.
Baez is giving climate a great deal of attention at his Azimuth blog.
https://www.google.com/search?q=climate-science+equivalent+of+Baez%E2%80%99s+crackpot+index%3F
P.S.: https://greenfyre.wordpress.com/2008/10/16/climate-denier-crackpot-index/
Hank, thanks, once again it is demonstrated that your google-fu is superior to mine 8^). And once again, it is demonstrated that AGW-deniers lack self-awareness 8^(. But if they didn’t they wouldn’t be deniers, would they.
Unsettled Malcolm Roberts queries United Nation’s science : Comments
By John Nicol and Jennifer Marohasy, published 16/9/2016
At high altitudes, the greenhouse gases provide the only mechanism for the radiation of heat from the atmosphere to space.
http://forum.onlineopinion.com.au/thread.asp?article=18525&page=1
Quoting Roberts in the Senate:
“It is basic. The sun warms the earth’s surface. The surface, by contact, warms the moving, circulating atmosphere. That means the atmosphere cools the surface. How then can the atmosphere warm it? It cannot. That is why their computer models are wrong.”
http://www.smh.com.au/federal-politics/political-news/one-nation-senator-malcolm-roberts-calls-for-ausexit-from-monster-united-nations-in-first-speech-20160913-grfojm.html
And you may have thought Australian Silliness couldn’t get any worse?
Think again. :-)
Have at it.
Sept 15–DeSmogBlog on Malcolm Roberts maiden speech to Parliament:
http://www.desmogblog.com/2016/09/15/australia-s-climate-denialists-senator-malcolm-roberts-fails-high-school-science-maiden-speech
“Where do you start?”–Prof. Matthew England
“There is so much wrong in these few sentences that it is almost beyond parody…”–Prof. Roger Jones
Unfortunately, you do have to unpack it, take it apart, and straighten it out–as these professors do, along with David Karoly and Sarah Perkins-Kirkpatrick–although the fantasy is so broad and so bare that you’d rather just walk away.
It’s important to see that Roberts is coming from the culture of coal. Like it or not, it’s going to be harder and harder to keep the subject of energy out of public reactions to climate science. There are lots more ready deceptions about climate at fossil fuel promoters like the Heartland Institute, IMO.
InsideClimate News reported Sept 9 that a climate denialist was the speaker at the only session on climate change at the Northeast Public Power Association’s annual conference:
https://insideclimatenews.org/news/08092016/climate-change-denial-northeast-public-power-association-neppa-solar-and-wind-steve-goreham-global-warming
“Nobody said the third industrial revolution would be easy.”–Courtney St. John and Steve Hargreaves, on Nexus Media:
https://nexusmedianews.com/the-battle-over-energy-progress-3b61398c8875#.vfzgnji8c
I read this article on CleanTechnica. My sentiments exactly. The denialist speaker at the utility conference:
http://www.stevegoreham.com/