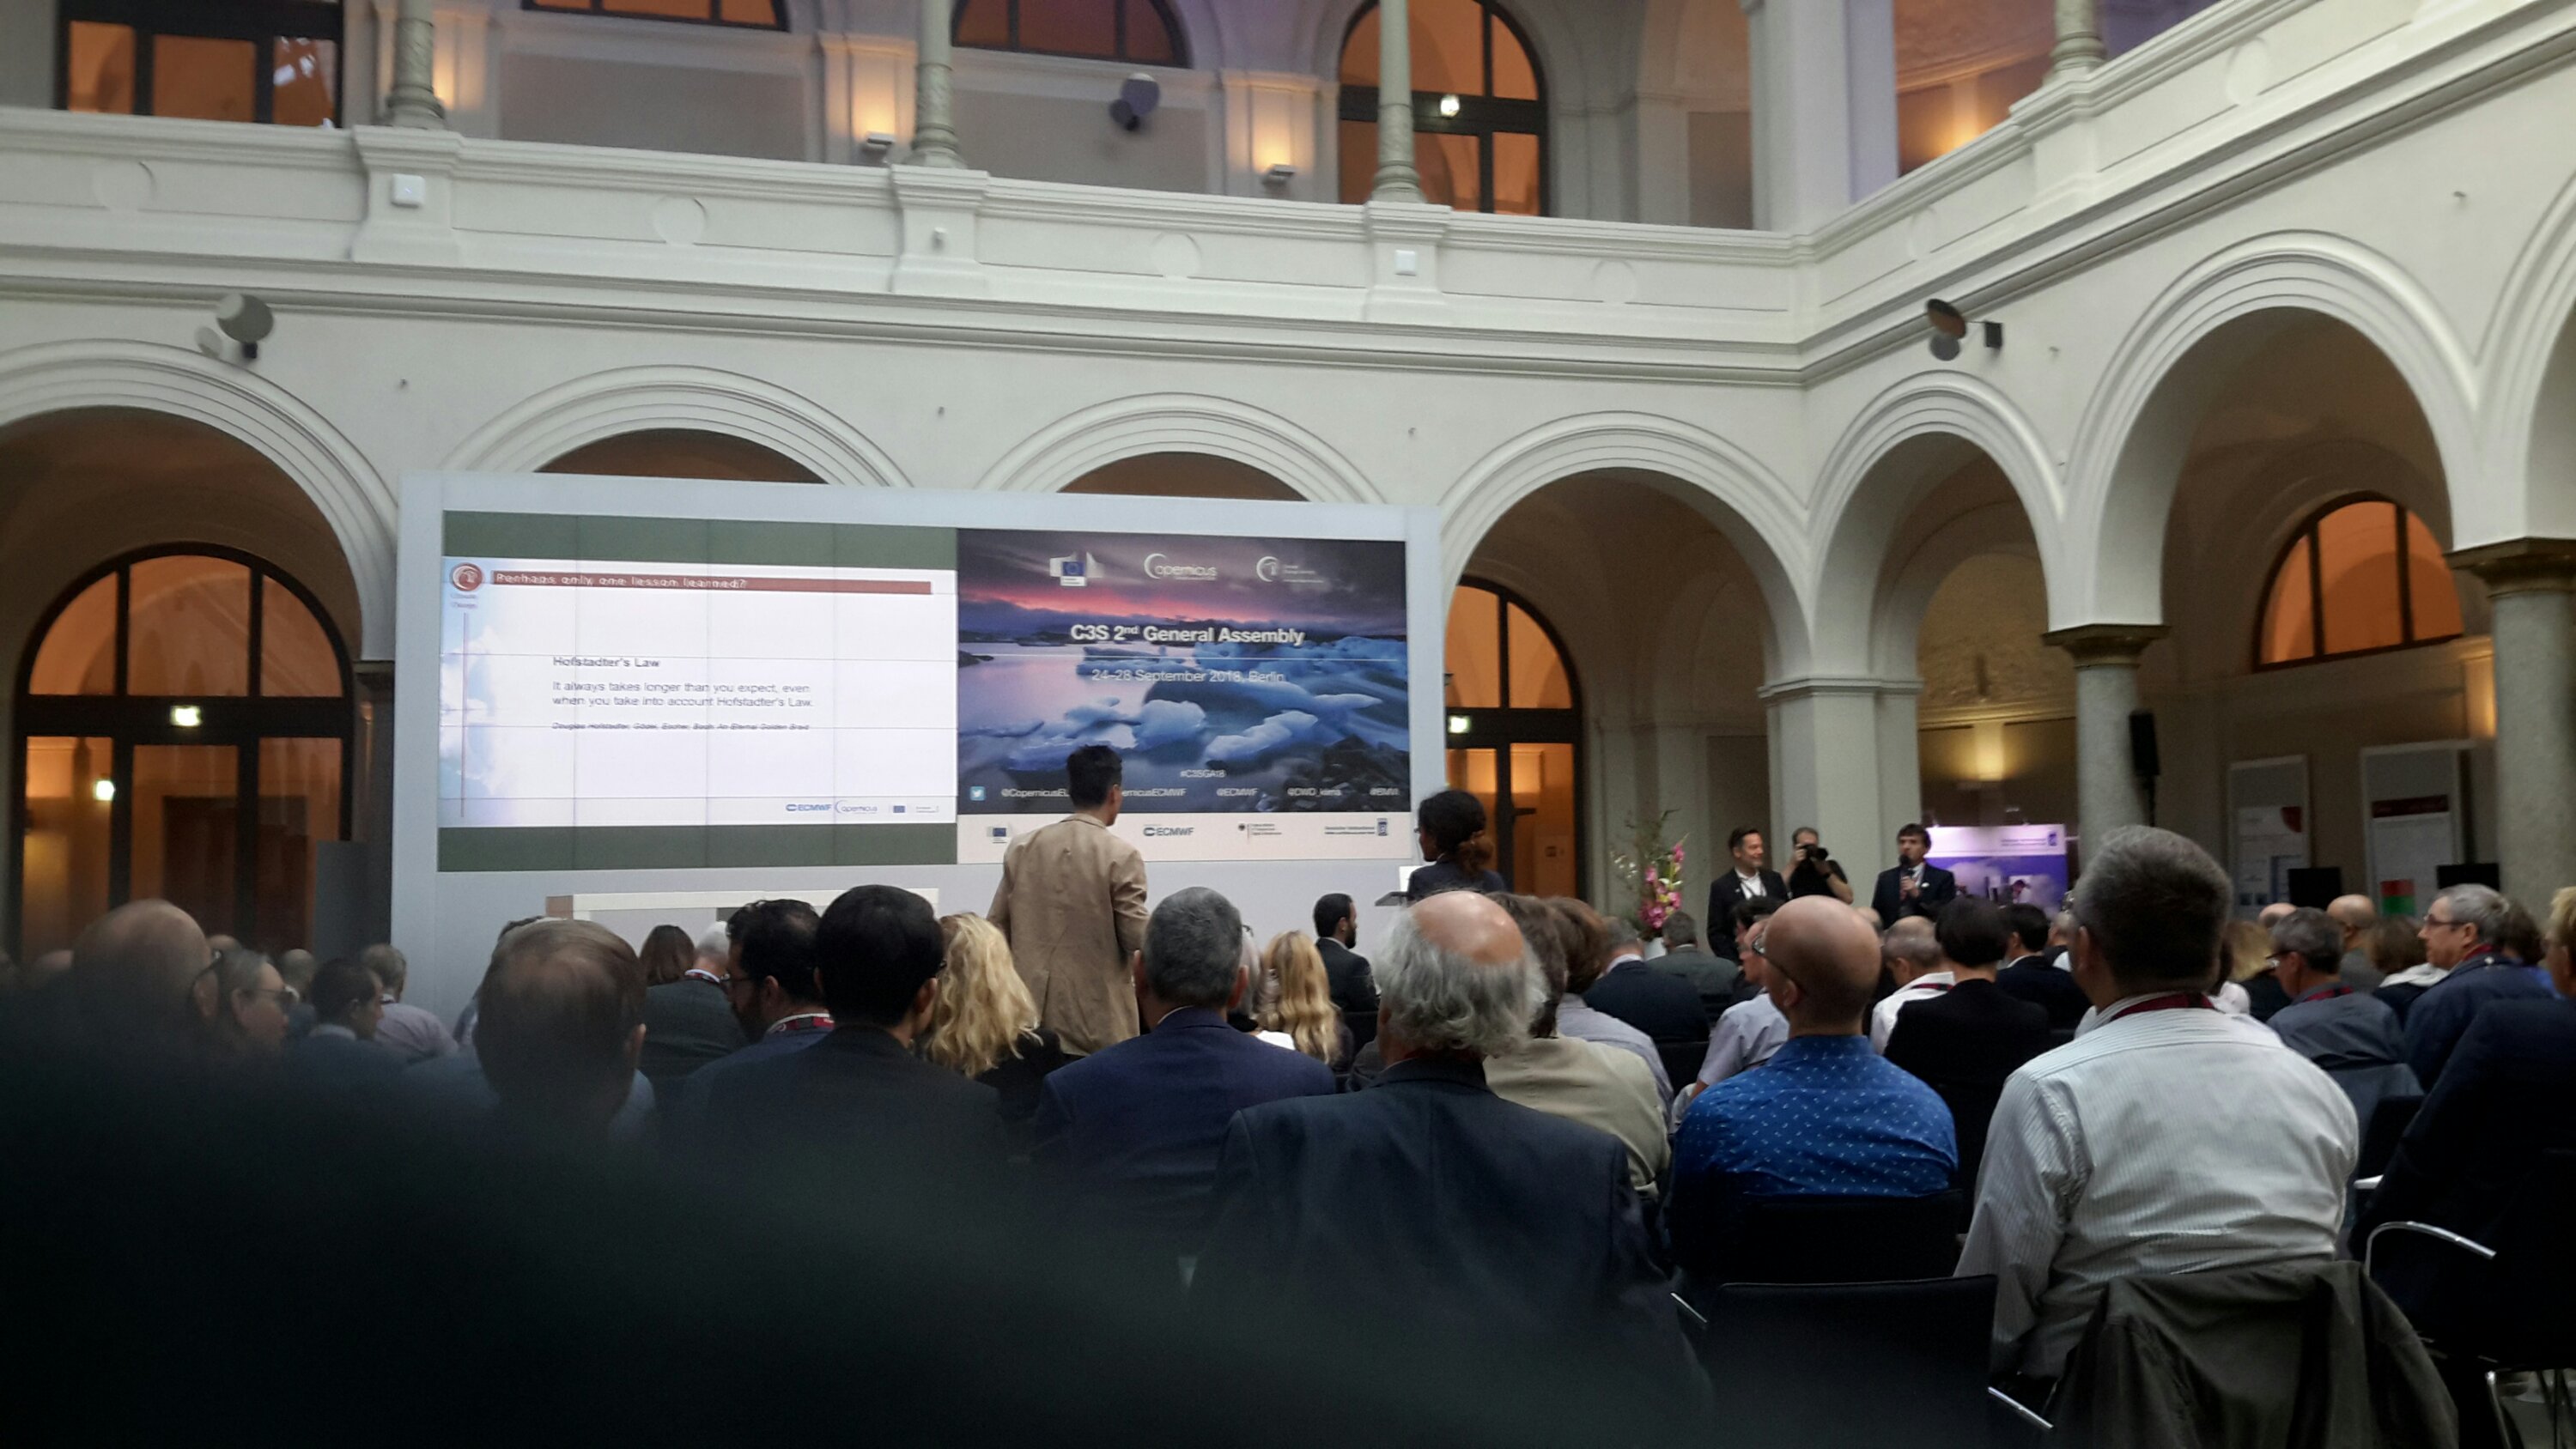
An important milestone was passed during the second general assembly of the Copernicus Climate Change Service, which took place in Berlin on Sept 24-28 (twitter hashtag '#C3SGA18'). The European climate service has become operational, hosted by the European Centre for Medium-Range Forecasts (ECMWF).
This means a growing volume of open and free climate data will become available to everyone. Copernicus will also provide regular assessments of the state of climate, which will include monthly bulletins and annual state of the climate reports.
One goal is to make Europe and the rest of the world better able to adapt to climate change.
The range and volume of activities connected to building up Copernicus Climate Change Services is almost breathtaking and has involved a large number of European research institutions. We are talking about huge volumes of data, and the pan-European engagement also bolsters the quality and trust in the products that Copernicus can offer.
Typical types of data that will be provided include observations, climate indicators, reanalyses, seasonal forecasts, decadal climate forecast, and climate change projections. A great deal of effort has been made to assure good quality and good practices in order to establish trusted products. It is also important that the service is user-friendly and easy to use.
People will see a webportal which gives them access to the climate data store and a toolbox which lets them perform their analysis on the data without having to download it. They would have to register, and there are already thousands of registered users, many who also come from non-European countries.
To make the data more widely useful, Copernicus is also developing sector information systems to assist decision-makers and impact studies.
Copernicus puts a great deal of efforts into outreach and user-friendliness. However, it is also acknowledged that there is no such thing as as a “typical user”. Therefore, there will be a Copernicus user service and online training facilities that is open for anyone, anywhere (with a decent Internet connection) and anytime. There will also be initiatives to train the trainers.
The visibility of the services is also important and there is already some material for TV-meteorologists, such as maps and curves. Some nice examples were presented at the general assembly on how information from Copernicus is being used by German TV weather forecasters and on Euronews. I expect this type of materials will develop further in the future.
Overall, I think the Copernicus Climate Change Services is a great start, but I also believe that there is room for further developments and improvements. For instance, as in my previous blog on climate indicators, I still think the set of commonly used climate indicators is incomplete.
The set of climate indicators should include updated estimates of the global daily precipitation area and global tropospheric overturning. Other useful products include storm tracks for both tropical as well as mid-latitude cyclones. These types of indicators could be based on the new high-resolution ERA5 reanalysis data.
Another potentially useful aspect would be to host a catalog of past events, such as storms, flooding, extreme rainfall, droughts, and heatwaves, and provide a tool to show when and where they took place on a time-space axis.
Additional relevant information, together with a comprehensive search engine, could also enrich such a database and make it more widely useful. For instance geographical information, consequences, damages, and photographs.
Also, more emphasis should also be placed on metadata and additional information, which will make data exploration and search more powerful.
An optimal use of the metadata can also strengthen data analysis and improve efforts to distill information from the data. Making use of all relevant and available information can also provide a better guidance on which data products to use.
Another thing is that the toolbox so far only accommodates for python scripts, and there is a large community that uses R for data analysis who will not have the same support. I guess this will improve in the near future.
My comment on the general assembly, and conferences in general, is that I found some of the presentations challenging to follow because of the proliferation of acronyms and abbreviations.
Presentations with acronyms that are not widely used are bound to lose their punch, as people start to wonder what they mean and hence miss subsequent messages. The extensive use of acronyms is a bad habit and creates an obstacle to understanding the message.
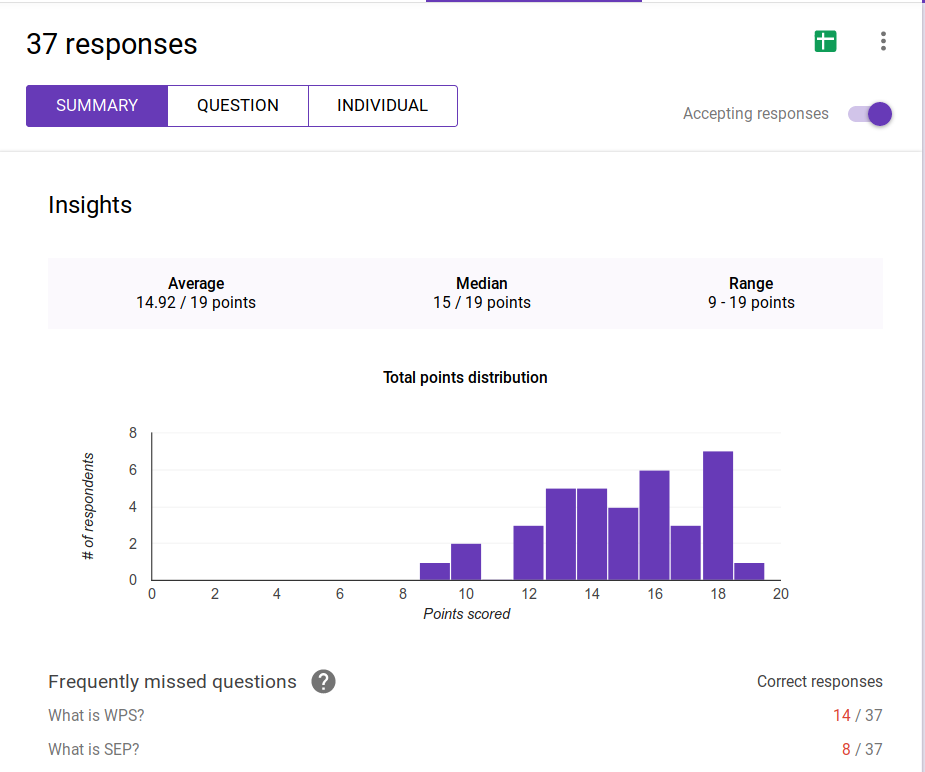
I decided to carry out an ad hoc and informal quiz to see how well my peers know 19 different abbreviations used in the European climate services community (you can try this quiz yourself if you are curious).
The graphics below shows a summary of 37 anonymous responses, and the results seem to support my impression about how futile it is to use non-standard abbreviations.
I have also made a collection of the abbreviations that I caught during the general assembly in the table below. It’s good to have an overview.
| Code | Plaintext | |
| API | Application program interface | |
| C3S | Copernicus climate change services | |
| CCI | Climate change initiative | |
| CDM | Common data model | |
| CDR | Climate data records | |
| CDS | Climate data store | |
| CMIP | Coupled climate model intercomparison project | |
| CRPS | Continuous ranked probability score | |
| CUS | Copernicus user support | |
| DECM | Data evaluation for climate models | |
| ECV | Essential climate variables | |
| EQC | Evaluation and quality control | |
| EQCO | Evaluation of quality control for observations | |
| ERA5 | The fifth European reanalysis | |
| ERAINT | The interim European reanalysis | |
| ESGF | Earth system grid federation | |
| EUMETSAT |
The European Organisation for the Exploitation of Meteorological Satellites
|
|
| GCOS | Global climate observing system | |
| GFCS | Global framework for climate services | |
| GPCC | Global precipitation Climatology centre | |
| GPCP | Global precipitation Climatology project | |
| ICDR | Interim climate data records | |
| KB | Knowledge base | |
| P2P | Peer-to-Peer | |
| PoC | Proofs of concept | |
| QA4ECV | Quality assurance for essential climate variables | |
| QAR | Quality assurance report | |
| QAT | Quality assurance template | |
| SaaS | Software as a servic | |
| SIS | Sector information services | |
| URDB | User requirement database | |
| WPS | web-based processing system |
Alright, let’s get right down to the nitty gritty:
How much CO2 have they removed from the atmosphere?
There has been a tendency for more and more abbreviations over the last couple of decades, as bad in papers as on expert websites. The best thing to do is to require a table of standard abbreviations that can be easily accessed.
Yeah, depending on the audience, spell it out. Also thoroughly label your graphs and charts.
ESL (Elliptical Science Lacunae)
AI (Acronym Index)
V! (Voila!):
https://www.realclimate.org/index.php/acronym-index/
Wonderful, thanks for the report.
[please don’t feed the troll.]
Wrong question, KIA, and you damn well know it.
Right question is how much carbon have they kept out of the atmosphere.
You expect climate scientists to remove CO2 and opposed to be doing science? Reducing CO2 emissions depends on people getting out of denial and voting for policies that will be effective.
#1, KIA–
That would be a SEP, except that carbon in the atmosphere is EP.
I took the acronym quiz – got 11 out of 19. Not bad for a dumb azz, eh?
:)
5 – Jim
You are correct. WHAT is the answer?
Yes, acronyms are a real problem. Please see my recent two blogs on how to write journal articles and make plots, which include a section on acronyms:
Robock, Alan, 2018: Getting your paper published, Part 1: Don’t annoy the reviewers. Editor’s Vox. Eos, 99, doi:10.1029/2018EO105561. https://eos.org/editors-vox/getting-your-paper-published-part-1-dont-annoy-the-reviewers
Robock, Alan, 2018: Getting your paper published, Part 2: Good grammar, clear figures. Editor’s Vox. Eos, 99, doi:10.1029/2018EO105573. https://eos.org/editors-vox/getting-your-paper-published-part-2-good-grammar-clear-figures
AR,
Sound advice, IMO.
Choosing colors for keys can be tricky business. If you’re doing maps, might as well spend the time to thoroughly read up or take a class on using color. At the very least, for both ramps and discrete steps, a black and white proof will help you to evaluate the effectiveness of your product (and to test accessibility for viewers who might be color blind).