• Skip to primary navigation
  • Skip to main content
  • Skip to primary sidebar
  • Skip to footer

RealClimate

Climate science from climate scientists...

  • Home
  • Start here
  • Contributors
  • Archives
You are here: Home / 2021 / Archives for April 2021

Archives for April 2021

Nenana Ice Classic 2021

30 Apr 2021 by Gavin

And…. it’s that time again. The clock stopped on the Nenana ice classic this afternoon (April 30, 12:50pm AT). This is pretty much on trend and unsurprising given the relatively slightly cool winter in Alaska. The jackpot on offer this year was $233,591 but will likely be shared among several winners. This year’s ‘break up’ is a little odd, since the ice moved sufficiently to trigger the clock, but not enough to actually topple the tripod (which is still visible as this is being written (9pm ET) – Update 10:30pm ET: gone now though!). But, the rules are the rules…

Nenana Ice Classic break-up dates since 1917.

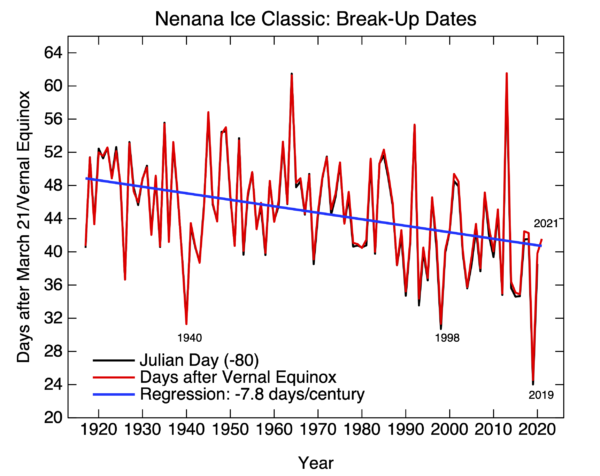
The trends in the break up date is about 8 days earlier per century (±4), estimated over the whole record, but substantially faster over the last 50 years (16 ± 12 days/century, 95% CI).

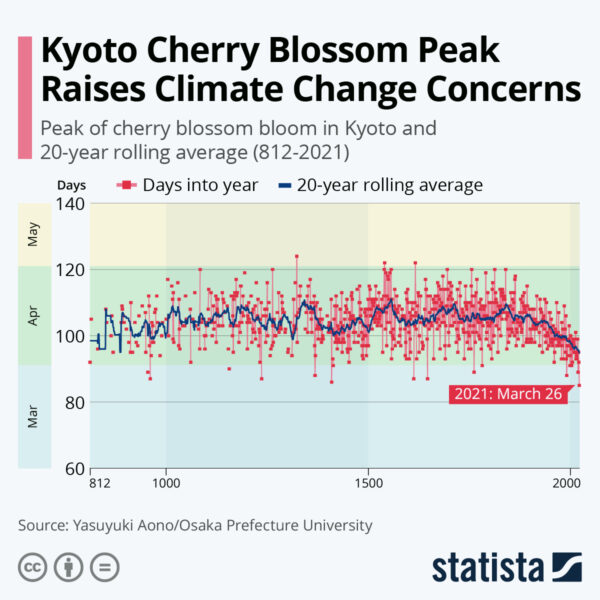
Other phenological records show similar trends, notably the longest cherry blossom record from Kyoto which dates back to 9th Century, and which had a record earliest peak bloom this year and a clear trend over the last few decades:

Kyoto Cherry Blossom trends (graph from Statista)

Feel free to link to your favorite such record in the comments…

Filed Under: Climate Science, Instrumental Record

Two graphs show the path to 1.5 degrees

21 Apr 2021 by Stefan

In the Paris Agreement, just about all of the world’s nations pledged to “pursue efforts to limit the temperature increase to 1.5 degrees Celsius above pre-industrial levels”. On Saturday, the top climate diplomats from the U.S. and China, John Kerry and Xie Zhenhua, reiterated in a joint statement that they want to step up their climate mitigation efforts to keep that goal “within reach”.

But is that still possible? Here are two graphs.

Global temperature trend (relative to mean 1880-1910, NASA data). The colored curve shows the moving average over 12 months, the black line the linear trend over the last 50 years. Transient warmth following two strong El Niño events in the tropical Pacific is indicated by arrows. If everything continued like this, the 1.5 degree limit would be exceeded around 2040.

The first graph shows the global temperature trend. Warming has progressed essentially linearly for fifty years in response to increasing CO2 emissions. Although the latter accelerate the rise of CO2 in the atmosphere, on the other hand, radiative forcing (which causes warming) increases only with the logarithm of CO2 concentration, and therefore roughly linearly since the 1970s. Any acceleration of warming over the last decade is not a significant trend change. It is linked to two El Niño events in recent years, but that is part of natural variability. Does anyone remember the discussion about the supposed “warming pause” in the early 2000s? It also never was statistically significant, nor did it signify a trend change.

Therefore, if emissions continue to grow, we expect a further roughly linear increase in temperature, which would then exceed 1.5 degrees around 2040. If we lower emissions, the trend will flatten out and become roughly horizontal as we reach zero emissions. Therefore, these observational data do not argue against the possibility to still keep warming below 1.5°C.

Exemplary emission trajectories with CO2 emission budgets that, according to the IPCC, correspond to limiting warming to 1.5 °C with 50% probability (solid) or limiting it to 1.75 °C with 67% probability. The same emissions as in 2019 were assumed as the starting point in 2021, assuming the “corona spike” in 2020 is likely to be temporary.

The second graph shows global CO2 emission trajectories with which we can still limit warming to 1.5 °C, at least with 50:50 probability. This means: given the uncertainties, this could also land us at 1.6 degrees, but with a bit of luck, it could land us a bit below 1.5 degrees. The core conclusions:

  •     It is not yet impossible to keep warming below 1.5 °C.
  •     This requires roughly a halving of global CO2 emissions by 2030 (as already stated in the IPCC 1.5 degree report).
  •     If the world dithers for another ten years before emissions fall, it will no longer be possible (red curve).

It should be noted that I have not assumed net-negative emissions here. Many scenarios assume that we first emit too much and that our children then have to pull CO2 out of the atmosphere after mid-century – I think this is not very realistic and also ethically questionable. I think we will probably not be able to achieve more than reducing global emissions to net zero. Even that would require CO2 sinks to compensate for unavoidable residual emissions, e.g. from agriculture.

Conclusion: The limitation to 1.5 degrees is still possible and from my point of view also urgently advised to avert catastrophic risks, but it requires immediate decisive measures. I am curious to see what the climate summit scheduled by US President Joe Biden will bring in the coming days!

Link

Fact check by Climate Analytics to the claim that we can no longer limit warming to 1.5°C.

This article originally appeared in German at KlimaLounge.

Filed Under: Climate Science

Should the official Atlantic hurricane season be lengthened?

2 Apr 2021 by Jim Kossin

By Jim Kossin, Tim Hall, Mike Mann, and Stefan Rahmstorf

The 2020 Atlantic hurricane season broke a number of records, with the formation of an unprecedented 30 “named storms” (storms that reach wind-speed intensity of at least 18 m/s and are then given an official name). The season also started earlier than normal. In fact, when ranked by their order in the season, the date of formation of every named storm, from Tropical Storm Arthur to Hurricane Iota was substantially earlier than normal (Fig. 1).

Fig. 1 Average number of named storms by day of the year in the historical record from 1851–2019 (dark blue line). The light blue shading denotes the range between the minimum and maximum number of storms observed by each day. The days of formation for the 2020 named storms are shown by the red squares.
[Read more…] about Should the official Atlantic hurricane season be lengthened?

Filed Under: Climate Science, Hurricanes, Instrumental Record

Unforced Variations: Apr 2021

1 Apr 2021 by group

This month’s open thread for climate science discussions. Be nice, it’s Earth month.

Filed Under: Climate Science, Open thread

Primary Sidebar

Email Notification

get new posts sent to you automatically (free)
Loading

Recent Posts

  • Some new CMIP6 MSU comparisons
  • How not to science
  • Unforced variations: March 2023
  • The established ground and new ideas
  • 2022 updates to model-observation comparisons
  • Unforced variations: Feb 2023

Our Books

Book covers
This list of books since 2005 (in reverse chronological order) that we have been involved in, accompanied by the publisher’s official description, and some comments of independent reviewers of the work.
All Books >>

Recent Comments

  • Adam Lea on Unforced variations: March 2023
  • Carbomontanus on Unforced variations: March 2023
  • Carbomontanus on Unforced variations: March 2023
  • Ray Ladbury on Unforced variations: March 2023
  • MA Rodger on Unforced variations: March 2023
  • Carbomontanus on Unforced variations: March 2023
  • nigelj on Unforced variations: March 2023
  • Barton Paul Levenson on Unforced variations: March 2023
  • Piotr on Unforced variations: March 2023
  • Barton Paul Levenson on Unforced variations: March 2023
  • Carbomontanus on Unforced variations: March 2023
  • JCM on Unforced variations: March 2023

Footer

ABOUT

  • About
  • Translations
  • Privacy Policy
  • Contact Page
  • Login

DATA

  • Data Sources
  • Climate model projections compared to observations

INDEX

  • Acronym index
  • Index

Realclimate Stats

1,296 posts

8 pages

230,107 comments

Copyright © 2023 · RealClimate is a commentary site on climate science by working climate scientists for the interested public and journalists.