A lot of what gets discussed here in relation to the greenhouse effect is relatively simple, and yet can be confusing to the lay reader. A useful way of demonstrating that simplicity is to use a stripped down mathematical model that is complex enough to include some interesting physics, but simple enough so that you can just write down the answer. This is the staple of most textbooks on the subject, but there are questions that arise in discussions here that don’t ever get addressed in most textbooks. Yet simple models can be useful there too.
I’ll try and cover a few ‘greenhouse’ issues that come up in multiple contexts in the climate debate. Why does ‘radiative forcing’ work as method for comparing different physical impacts on the climate, and why you can’t calculate climate sensitivity just by looking at the surface energy budget. There will be mathematics, but hopefully it won’t be too painful.
So how simple can you make a model that contains the basic greenhouse physics? Pretty simple actually. You need to account for the solar radiation coming in (including the impact of albedo), the longwave radiation coming from the surface (which depends on the temperature) and some absorption/radiation (the ’emissivity’) of longwave radiation in the atmosphere (the basic greenhouse effect). Optionally, you can increase the realism by adding feedbacks (allowing the absorption or albedo to depend on temperature), and other processes – like convection – that link the surface and atmosphere more closely than radiation does. You can skip directly to the bottom-line points if you don’t want to see the gory details.
The Greenhouse Effect
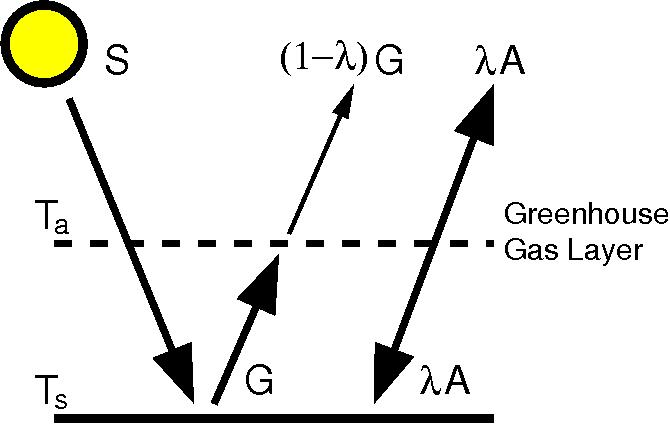 The basic case is set up like so: Solar radiation coming in is
  , where
  is the albedo, TSI the solar ‘constant’ and the factor 4 deals with the geometry (the ratio of the area of the disk to the area of the sphere). The surface emission is
  where
where  is the Stefan-Boltzmann constant, and
  is the surface temperature and the atmospheric radiative flux is written
  , where
  is the emissivity – effectively the strength of the greenhouse effect. Note that this is just going to be a qualitative description and can’t be used to quantitatively estimate the real world values.
There are three equations that define this system – the energy balance at the surface, in the atmosphere and for the planet as a whole (only two of which are independent). We can write the equations in terms of the energy fluxes (instead of the temperatures) since it makes the algebra a little clearer.

Atmosphere:

Planet:

The factor of two for A (the radiation emitted from the atmosphere) comes in because the atmosphere radiates both up and down. From those equations you can derive the surface temperature as a function of the incoming solar and the atmospheric emissivity as:

If you want to put some vaguely realistic numbers to it, then with S=240 W/m2 and  =0.769, you get a ground temperature of 288 K – roughly corresponding to Earth. So far, so good.
Point 1: It’s easy to see that the G (and hence  ) increases from S to 2S as the emissivity goes from 0 (no greenhouse effect) to 1 (maximum greenhouse effect) i.e. increasing the greenhouse effect warms the surface.
This is an extremely robust result, and indeed has been known for over a century. One little subtlety, note that the atmospheric temperature is cooler than the surface – this is fundamental to there being a greenhouse effect at all. In this example it’s cooler because of the radiative balance, while in the real world it’s cooler because of adiabatic expansion (air cools as it expands under lower pressure) modified by convection.
Radiative Forcing
Now what happens if something changes – say the solar input increases, or the emissivity changes? It’s easy enough to put in the new values and see what happens – and this will define the sensitivity of system. We can also calculate the instantaneous change in the energy balance at the top of the atmosphere as or  changes while keeping the temperatures the same. This is the famed ‘radiative forcing’ you’ve heard so much about. That change (+ve going down) is:

where  are the small changes in solar and change in emissivity respectively. The subscripts indicate the previous equilibrium values We can calculate the resulting change in G as:

so there is a direct linear connection between the radiative forcing and the resulting temperature change. In more complex systems the radiative forcing is a more tightly defined concept (the stratosphere or presence of convection make it a little more complex), but the principle remains the same:
Point 2: Radiative forcing – whether from the sun or from greenhouse gases – has pretty much the same effect regardless of how it comes about.
Climate Sensitivity
The ratio of  is the sensitivity of
  to the forcing for this (simplified) system. To get the sensitivity of the temperature (which is the more usual definition of climate sensitivity,
  ), you need to multiply by
  i.e.
i.e.  . For the numbers given above, it would be about 0.3 C/(W/m2). Again, I should stress that this is not an estimate for the real Earth!
As an aside, there have been a few claims (notably from Steve Milloy or Sherwood Idso) that you can estimate climate sensitivity by dividing the change in temperature due to the greenhouse effect by the downwelling longwave radiation. This is not even close, as you can see by working it through here. The effect on due to the greenhouse effect (i.e. the difference between having  and its actual value) is
  , and the downward longwave radiation is just
  , and dividing one by the other simply gives – which is not the same as the correct expression above – in this case implying around 0.2 C/(W/m2) – and indeed is always smaller. That might explain it’s appeal of course (and we haven’t even thought about feedbacks yet…).
Point 3: Climate sensitivity is a precisely defined quantity – you can’t get it just by dividing an energy flux by any old temperature.
Feedbacks
Now we can make the model a little more realistic by adding in ‘feedbacks’ or amplifying factors. In this simple system, there are two possible mechanism – a feedback on the emissivity or on the albedo. For instance, making the emissivity a function of temperature is analogous to the water vapour feedback in the real world and making the albedo a function of temperature could be analogous to the ice-albedo or cloud-cover feedbacks. We can incorporate the first kind of physics by making  dependent on the temperature (or for arithmetical convenience). Indeed, if we take a special linear form for the temperature dependence and write:

then the result we had before is still a solution (i.e.  ). However, the sensitivity to changes (whether in the greenhouse effect or solar input) will be different and will depend on
  . The new sensitivity will be given by

So if is positive, there will be an amplification of any particular change, if it’s negative, a dampening i.e. if water vapour increases with temperature that that will increase the greenhouse effect and cause additional warming. For instance,  , then the sensitivity increases to 0.33 C/(W/m2). We could do a similar analysis with a feedback on albedo and get larger sensitivities if we wanted. However, regardless of the value of the feedbacks, the fluxes before any change will be the same and that leads to another important point:
Point 4: Climate sensitivity can only be determined from changes to the system, not from the climatological fluxes.
Summary
While this is just a simple model that is not really very Earth-like (no convection, no clouds, only a single layer etc.), it does illustrate some relevant points which are just as qualitatively true for GCMs and the real world. You should think of these kinds of exercises as simple flim-flam detectors – if someone tries to convince you that they can do a simple calculation and prove everyone else wrong, think about what the same calculation would be in this more straightforward system and see whether the idea holds up. If it does, it might work in the real world (no guarantee though) – but if it doesn’t, then it’s most probably garbage.
N.B. This is a more pedagogical and math-heavy article than most of the ones we post, and we aren’t likely to switch over exclusively to this sort of thing. But let us know if you like it (or not) and we’ll think about doing similar pieces on other key topics.
We have to be careful here. One problem in the debate is people (engineers for example) who understand just enough math to get into trouble. Models that leave out convection, for example, can give weird, runaway results, which at one early point even cast some doubt on the whole theory. See my historical essay on simple models, in particular this incident.
Case in point: the statement “Point 2: Radiative forcing – whether from the sun or from greenhouse gases – has pretty much the same effect regardless of how it comes about.” Maybe true for a globally average temperature, but solar forcing causes warming at all levels, whereas greenhouse gases cause warming at the surface and lower atmosphere but cooling in the stratosphere, above where the radiation is blocked. In fact that is what is happening, and this “signature” has been cited by review groups as important evidence that the current warming is due to gases and not solar activity.
Simple models are valuable “educational toys” (as one scientist called them) for experts who understand what the models can and can’t tell, but they are toys with sharp edges.
[Response: Your points are very well taken…. Thanks. -gavin]
I must protest! You said simple!
I’d like to see more of these posts. It’s illuminating to see how things work in a concrete model that one can plug numbers into and play with.
EdGCM is another very simple model that people can learn with. It is a bit more complex than the few equations in this post, but based on them, and simpler than most other GCMs. We’ve taken the time to move what are normally hard-coded or binary inputs to simplex external text files, so people can plug and play with different numbers and examine results.
Thanks for the math. Because of the multitude of simple explanations I can find at your site, I’m now ready for more technical explanations like this one. (There’s no need to post my comment; I’m just responding to the question.)
There is nothing to be scared about equations. This type of simple and fundamental atmospheric physics is exactly what the general public needs to know in order to counteract the non-sense put out by so many climate skeptics. Bravo.
I actually prefer to see some more math from you guys. It will give me more elements to “fight” those skeptics ;)
Would have been interesting to see the saturation point of the carbon radiation in the equations, as they don’t re-emit to infinity – as might be suggested here. A doubling in PPM from 200 to 400 may double temperature increase(for instance), but an increase from 400 to 800 will be less than double due to this saturation limitation.
[Response: That is an issue at a significantly higher level than you can properly deal with this model. You could just think about the emissivity being a logarithmic function of CO2, but actually there is a limit here of 1 for lambda – in the real world there is no such limit (which is related to the vertical structure of the atmosphere, the spectral nature of the absorption and things like pressure broadening effects). Look at Venus for an example of extreme CO2 forcing…. The effect doesn’t saturate, it just slows. – gavin]
Personally, I’m glad for the math. But then, I’m a mathematician.
I suggest against doing this all the time; you’ll alienate much of your readership. But the occasional indulgence for those of us who want a quantitative rather than qualitative exposition, is a “breath of fresh air.”
And by the way, I find the exposition very clear.
psuedo code so people could try it out for themselves…or some sensible range for numbers. nice to see variations in the articles.
Although I love math (and already said so), I’ve had a lot of experience discussing scientific topics with non-scientists, and it’s most assuredly true that as soon as you mention numbers, a lot of their eyes “glaze over,” and if you dare actually to write an equation, most of their stomachs turn.
So I suggest against using math in public discussions and personal debates, unless you know that the parties involved are OK with it. Nothing will turn people off faster than equations.
That aside, I’d love to see more posts with equations from RealClimate (but for the sake of the lay readership, not too many).
Just one complaint: while I appreciate the math, and would like to see more, I’d appreciate it even more if I could actually see the equations, instead of a sprinkling of random dots. Not really your fault, since HTML is majorly defective when it comes to displaying math, but would it be possible to add links to a pdf and/or LaTeX file?
[Response: Which browser/platform are you using? the equations are based on Latex derived images. I can see them clearly in Firefox, but if this doesn’t work on other browsers we won’t use it again… – gavin]
It just occurred to me, rereading this, that you’ve got 0 emissivity for no greenhouse effect and 1 for maximum greenhouse effect. Shouldn’t it be the other way around? If nothing is emitted the greenhouse effect should be infinite. On the other hand, if it’s one, you’ve just got the Stefan-Boltzmann equation.
Are you using emissivity in a different sense from the epsilon in the SB relation? I’m probably misunderstanding something here, so please set me straight.
[Response: I’m talking about the atmospheric emissivity (which equals absorption). No absorption = no greenhouse effect. – gavin]
From an anthropological standpoint, I am concerned that we humans are repeating the errors of our predecessors. As I understand it, at least eight civilizations have perished because they diverted too much of their resources to attempting to control the climate. Although primitive by modern standards, these resources included even human sacrifice to try to make it rain. They perished from not only crop failures, but also reduction of their populations below a critical mass.
The issue that I have not seen explained fully enough with respect to global climate change is the effect of the heat of the core of the earth. I can’t help but notice the recent reports of increases of tsunami, earthquakes, el nino events, and volcanic eruption. If memory serves, these are products of the cooling and shrinking processes of the earth. As the inner core of the earth is hotter than the surface of the sun and heat rises, it stands to reason that the rise in ocean temperatures and chemical content of the sea and air, as well as contributions from the outer core and the earth’s mantel may be attributable to these. I would expect that these different contributions would manifest themselves differently on the earth’s surface due to tectonic plate overlap, differing depths of these contributions and depth and size of the various fissures in the earth.
Does anyone know of scientific studies that address these potential aspects of global climate change?
I just don’t want our civilization to mis-allocate it’s resources and go belly-up as a result.
Thank you in advance for any and all information provided.
>equations
Wait, check the _other_ browsers first.
This page shows only a few errors in the validator
http://validator.w3.org/
Those aren’t, I don’t think, related to the equations.
Problems viewing may not be browser/HTML either.
Check your browser menu for something like /View/Character Encoding settings at the home end, see what fonts your computer/browser settings show it’s currently using; try Unicode (UTF-8) and Reload.
Some people may need ASCII (is this still true for vision-impaired, using text-to-speech? Used to be true for text browsers, like Lynx).
You could offer a picture of the equations in a JPEG file and a link, so those who can’t see them onscreen can download and print them.
Please, please do keep this up. I always need help thinking about things mathematically.
I like the post, allthough I had to read it several times to follow the arguments.
By defining a model, I guess you can say we will get to the point where we get to control the model and change it. This has infinite advantages, but I am afraid the model is so complex that it will be very hard to define it accurately. And this is because there are so many factors that influence the terms of the equations.
Still, defining models is a must. And if it were that easy, we would have been able to determine weather trends.
I think your site is a great benefit to clarifying issues around cc and maintains a high degree of objectivity and scientific clarity,so thanks for that.Over the last couple of years I have followed the development of the cc issue but have become suspicious about a possible ingredient within the observations that may have some bearing and does not really get considered.I suspect the reason for excluding this phenomenon may be to do with a general view of the physics as they stand ,I dont know but here goes.I believe it is the case that the core of the earth itself is getting warmer.If this is the case then the consequences will be feeding into and magnifying other anthropogenic changes as well as increasing the influence of positive feedbacks in the climate system.I would appreciate your views on this, regards matt fairs
Thanks for a really good site and informative debate.
I have a query which is taxing an engineering mind.
RC appears to be satisfied that CO2 resides in the atmosphere for about 200 years, and that CO2 concentration has not exceeded 300 ppm in the last 400 kyear. I also see references to the absence of CO2 spikes in the ice core records as evidence that large volcanoes have not been a significant source of CO2 in the past.
I read elsewhere that samples of air in the ice cores might have been smeared by physical processes in the ice. This could be local mixing during compression, and possibly upward migration of the less dense air bubbles, a phenomenon which must result in some local mixing. Without getting too far into these details, the net effect would be akin to time-averaging . Detail will have been lost as a result.
Let’s say the atmospheric response to a large influx of CO2 is roughly the same as the response of a first order differential equation. The 200 year CO2 residence time would then equate to a time constant of about 66 years (i.e. only 5% of CO2 will remain longer than 200 years).
I have read that the ice core records of T and CO2 look like a 500 to 1000 year moving average. If this is reasonable, the ice core would hide actual CO2 perturbations following an event such as a large volcano. Only a small percentage of the amplitude of sudden perturbations would be evident.
If there is a significant averaging effect in the ice core, we would need to look again at those peaks. Whenever the peaks are close to the 300 ppm level, averaging could be hiding shorter periods when the CO2 concentration exceeds 300 ppm.
Do you have any references to literature which addresses these issues?
My guess is that there should be no averaging effect greater than 33 years (i.e. about 20% attenuation of sudden perturbations).
[Response: The 200 year number is already a great simplification and you can’t model it as a simple diffusion process – there are too many different physical processes and they all have different time scales. See this comment for more details: https://www.realclimate.org/index.php/archives/2007/02/aerosols-the-last-frontier/#comment-26374 and post https://www.realclimate.org/index.php/archives/2006/11/how-much-co2-emission-is-too-much/ – gavin]
Re seeing equations: I’m using Opera on Linux, FWIW, but the problem isn’t browser-related. It’s down to the fact that because HTML doesn’t know about math symbols, equations are commonly rendered into images. Your images are black text on a transparent background, no?
That’s fine if the reader is using a colored background, but since more than a few minutes of looking at a colored background gives me a nasty headache, I have my browsers (and everything else I use) set to display colored text on a nice, restful black background. Which unfortunately means that the equation images show nothing more than vague outlines where grey pixels were used for antialiasing. This isn’t something an HTML validator is going to catch, since the HTML is perfectly valid but produces an unviewable result.
One partial solution is to render the images with a colored rather than transparent background (as some sites do), in which case I’ll see a white block containing the equation. A link to pdf or LaTeX source, though, would guarantee readability – plus the latter makes it possible to copy equations at need :-)
[Response: Hmm. We are just using a standard plugin for the LaTeX rendering (latexrender). If you know of a fix or tweak to adjust the rendered images to have a white background instead of transparent, let me know. – gavin]
[[The issue that I have not seen explained fully enough with respect to global climate change is the effect of the heat of the core of the earth.]]
That’s because it’s trivial. The Earth system absorbs an average of 240 watts per square meter of sunlight. The geothermal flux averages 0.090 watts per square meter. Divide A by B.
[[ I can’t help but notice the recent reports of increases of tsunami, earthquakes, el nino events, and volcanic eruption. If memory serves, these are products of the cooling and shrinking processes of the earth.]]
Earthquakes are due to plate tectonics, which are driven by convection in the mantle, so to that extent you’re right. El Nino events are climate rather than geology.
[[ As the inner core of the earth is hotter than the surface of the sun ]]
It isn’t. The Earth’s core is at something like 3000 K, whereas the sun’s surface is 5779 K (and its core is at about 16 million K).
[[and heat rises, it stands to reason that the rise in ocean temperatures and chemical content of the sea and air, as well as contributions from the outer core and the earth’s mantel may be attributable to these.]]
No, the effect on temperature is trivial.
Re #1: What’s with the attitude towards engineers? This is the second such comment I’ve seen on this blog in the last few weeks. Is this a bitter attitude over past encounters, or professional snobbery? With an MSEE degree, I’ve had more than just enough math to be dangerous. And having spent significant time developing and using electromagnetic simulation programs, I’m plenty sympathetic towards the plight of the climate modeler. Feedbacks are a rather pedestrian concept in my field, and in any case, I didn’t find the post terribly difficult to follow.
Apart from the moderately contemptuous comments, I find your site fascinating and informative. For now, I’ll ignore those comments and just assume it must have been a result of unpleasant encounters with engineers from the lesser disciplines ;-)
Can anyone here explain why average July temperatures at low-elevation, extremely dry areas in the Desert Southwest are 3-4 degrees C higher than temperatures at the same latitudes east of the Rocky Mountains, which have extremely high absolute humidity? Both areas have the same top-of-atmosphere solar radiation, virtually same elevation. There appears to be some type of negative feedback in the east. Is it the influence of the Gulf of Mexico? Is it a negative water vapor feedback?
Great to see this math – what I’d really like to see is a clear explanation of what it is about the real Earth that makes the sensitivity number several times as large as this simple model gives you. Aside from the factors you mention, there’s also the issue of pole-to-equator and summer/winter temperature variations that this simple zero-dimensional model misses (and I guess this is related to convection issues), but from the simple analysis I’ve tried that only adds a fraction to the sensitivity number. I’ve read a lot of the history on Dr. Weart’s site, excellent history by the way, but I find it very hard to track down a good physical explanation for what bumps up the sensitivity so much in the real climate system.
I recently prepared a short set of high level slides on global warming for my Rotary Club.
One of the concepts I drew upon was radiative forcing, using info on NOAA’s web page, http://www.esrl.noaa.gov/gmd/aggi/.
I did two calculations that were pretty interesting. Total solar energy reaching the earth on a daily basis. Total radiative forcing on a daily basis. The results were interesting, but also unsettling.
For the first calculation, net solar energy, I used the following. Energy per square meter – 235 watts. Diameter – 7914 miles (averaging polar and equatorial diameters). Result? Solar energy at 2,875,000 million terawatt-hours/day. An impressively big number.
For the second calculation, CO2 radiative forcing, I began with a value of about 1.66 watts/meter squared. I extrapolated to the planet as a whole. Result? 20,300 terawatt-hours/day.
I found the comparison unsettling. 20,300 terawatt-hours/day, sustained over a year, is a pretty big number, well over two full days worth of solar energy. Intuitively it feels like the sort of energy stream that’d heat the planet pretty darn fast, much faster than anyone is now seeing.
This leaves me wondering if I should have taken a different approach.
Should I have used a delta? Let’s say the Year 2007 begins at 382 PPM for CO2 and ends at 384 PPM. Using NOAA’s calculation approach, that’d give a Year 2007 delta of 0.028 watts/meter squared, or, planet-wide, a Year 2007 delta of 341 terawatt-hours/day.
Hansen and others have said that new increments of CO2 take 20 to 30 years to get fully absorbed by the oceans, the land, the air. 341 terawatt-hours day – if absorbed over 20 years at a linear amount – would translate into 1,250,000 terawatt-hours added to the heat of the planet. Equivalent to a shade less than half a day’s solar energy.
Intuitively, this approach feels much more reasonable. Is this how I should think about radiative forcing? As a year-by-year delta? This year’s new CO2 becomes this year’s new radiative increment, an addition to the heat of the planet that may take 20 to 30 years to be fully absorbed? Thanks for any insight you can give.
On #22 – isn’t this a simple consequence of the high heat capacity of water relative to typical surface materials (i.e. rocks)? If there’s a lot of water around, it takes a lot more energy to raise the temperature than if it’s very dry. The low heat capacity of dry regions means they also lose heat a lot more easily, so their temperatures will tend to be lower at night and in winter. Anybody who’s lived near a coastline knows of the moderating influence on local climate.
The water vapor feedback discussed here is more of a net effect and much smaller than local daily or annual temperature variations: averaged over the year, does more water in the air tend to make things slightly warmer or not. Water is a known greenhouse gas, and night clouds retain heat, so it seems pretty clear the feedback is positive. There are many previous discussions of this effect on realclimate.
Gavin — This is well done! I encourage more similar snippets, maybe once each six weeks or so…
>deserts, hotter
Speculating: less water vapor in the air by which actual incoming infrared from sunlight is being intercepted, so more direct heating of the ground by that band. And as noted, no significant water or water-containing organic material on the surface.
“Stay in the shade during the day. Sit on something 12 or more inches off the ground, if possible. DO NOT SIT ON THE GROUND as it can be 30 degrees
hotter than a foot above the ground…..” — common desert emergency info
Re #14: [I can’t help but notice the recent reports of increases of tsunami, earthquakes, el nino events, and volcanic eruption.]
I think this one is easily explained: just rearrange “reports of increases” to “increased reports of”. These events aren’t (AFAIK, anyway) any more common than before; it’s just that, as with so much else, an omnipresent media reports on every isolated incident, and often enough inflates the reports to justify the coverage.
25: Yes, the increased water vapor in the east holds more heat and lessens diurnal variability, but this extra heat is not being registered as higher temperatures. Therefore, is the water vapor exerting a negative impact on surface temperature?
My math is getting a little rusty, along with my old brain. Can someone show how the three equations under the “Greenhouse Effect” section can be used to derive the equation for “surface temperature as a function of the incoming solar (radiation) and the atmospheric emissivity?”
On #22 There are several effects that make desert environments hotter than an equivalent environment laden with moisture: 1.soil moisture slows the warming of the soil and therefore the subsequent conduction of thermal energy to the atmosphere in contact with it as the soil moisture evaporates, 2. Moist areas usually have more vegetation, vegetation transpires moisture, which takes energy and absorbs solar radiation, some of which is used for photosynthesis and therefore also not available to heat the atmosphere, 3. A humid atmosphere is usually more turbid than a dry atmosphere. In this case I am referring to relative humidity, not absolute humidity, with less thermal energy available in the humid environment to do the work of evaporation (or alternately to keep the vapor in the gasseous phase)other materials in the air readily absorb moisture. These materials are called hygroscopic (sea salt, nitrate fetilizer dust, etc.)and are partly responsible for the formation of the haze in the “lazy, hazy days of summer”. The haze is the subject of “global dimming” of the sun, which by the way may be responsible for an underestimate of the amount of global warming, 4. Humid atmospheres may have more cumulus cloud cover.
This is not comprehensive but gives an idea of the many factors involved.
As far as mathematics, explanations and the public are concerned, generally forget it, I prefer to rely on concepts, analogies and simple explanations (i.e. very general or stripped of complications). It is amazing how the public misses the beauty and elegance of simple mathematics and has a panic attack at the very mention of an equation.
I like this post. It may be hard on some readers (although the above comments are encouraging), but it’s great for us sciency people who haven’t had the opportunity to take a college course in climatology.
Re: #30 (jae)
Divide equation 2 by (2*lambda), you get A = 0.5 * G
Substitute (0.5 * G) for A in equation 1, you get S + 0.5 * lambda * G = G
Rearrange that, you get S = (1 – 0.5 * lambda) * G
Divide by (1 – 0.5 * lambda), you get G = S / [1 – 0.5 * lambda]
Voila!
This would have saved me a lot of time and searching a few weeks ago. I’ve already managed to drag myself up to this level and need more. Could you expand this with hyperlinks to more detail/complexity?
#31 Isn’t it actually the other way around? Ground water should speed the transfer of heat from the surface to the atmosphere which keeps the surface temperature from rising. Look at track temperatures at car races for example (or parking lots or sandy beaches). When the sun is out the (dry) track temperature is always much higher than the air temperature.
33: Thanks!
Jae, think about nighttime in the desert. What happens then?
I liked this article. A few comments.
A few of the assumptions in this model should have been more clearly stated. Eg.
1. It was assumed that the atmopshere is transparent to incident solar radiation (why the S term did not appear in the Atmospheric radiative balence equation)
2. A single layer atmosphere with no lapse rate was used.
and the like. I thought the article was very well written, but I had to rely on my own knowledge of the subject to know what assumptions were begin made and how the model would deviate from reatlity.
I would love to see more articles of a similar nature however. Good work!
I second that motion, whats with the attitude for engineers? I also have a MSEE and can’t quite get the attitude as we don’t get a primer for math we get the full treatment!
I appreciate posts such as these as well and had no trouble following it. You did well using simple math so the details don’t bog down what you are trying to say. I use IE7 and the equations looked fine. Is more stuff like this going to be forthcoming? (Since this is your day job! :) )
Jim
I liked the post and the math is fine.
Can anyone point me to a quantitative explanation, at about the same level of detail as this post, of the relationship between emissions and atmospheric concentrations of greenhouse gases?
(in general, nice math, please do it some more, but consider suggestion at the end):
#31: re math & public … it could be worse, and maybe it’s getting better…
Amusement, then serious point.
Amusement:
During the late 1990s, I had occasion to visit the US Congress’s computer people, who were proud of their efforts to get Congress to use computers & Microsoft tools. I naively asked:
so, what do Senators really use? do they do email? use Word? Use Excel? PowerPoint?
They laughed: “Are you kidding, they’re mostly lawyers, they like words a lot, but numbers and graphs?? forget it.” They said there were a few who could use such tools. I suspect it should be better now.
Seriously: making math accessible to a broader audience:
I sometimes ask:
for numerical calculations, what “programming language” is used by the most people?
people answer: FORTRAN? C? C++? Visual Basic? Java? Mathematica?
but I claim the likeliest answer is: Excel (or equivalents)
After all, people who do not think of themselves as progrmmers routinely do calculations with sometimes-nontrivial equations, that years ago would have required BASIC or FORTRAN coding. These days, Excel is often taught in middle-schools.
Google: excel equations middle school spreadsheets : 242K hits
For better or worse, many people who will go blank at classical math equations with lambdas and sigmas and such … could be handed the equivalent equations in an Excel spreadsheet [especially with a few embedded graphs], and would feel quite comfortable, and could easily play with the data.
SUGGESTION: like it or not, a lot more people read/write Excel than feel good with classical mathematical and notation, and the following can be really valuable, if the goal is to communicate the math more broadly:
a) Show Excel formulae as well as standard math notation.
b) Better, have a repository for simple, well-commented spreadsheets that can be downloaded and played with.
In addition, it becomes much easier to build on what’s there, given the wealth of builtin functions that one would never expect a person to use by hand, especially if examples ever want to get into simple statistical analysis.
This is *not* to suggest that standard math notation should be abandoned, or that Excel is the end-all tool (shudder), just that if one wants to communicate math broadly, it may well be that optimal pedagogy is in a state of rapid change, and many more people now “speak” Excel fluently than standard math notation….
Re #39: Patrick Kennedy — I went web trawling on the search phrase carbon cycle to find many excellent sites. Is this what you wanted?
Personally I think the maths is extremely welcome; it gives a fresh restatement of what I’m attempting to learn formally. But I humbly submit that some well placed diagrams would be excellent aids to understanding as well. For example, a simple illustration showing that ‘the atmosphere radiates both up and down’.
[First ever comment, but I eagerly read everything posted here…]
Nice job. It’d be great to see more posts – and more of us science bloggers writing posts – like this. Though that may tempt “some” people to argue that we are not properly framing our information.
This is the Internets, home of “cheat sheets”
What we REALLY need are cheat sheets, not on the whole global warming climate change thing but on simple subdivision.
e.g. cheat sheet on C02. Would show net contribution of C02 by oceans, show various sinks and sources.
Or a cheat sheet on greenhouse gases. how water vapor responds to temperature change.
Thinking you take a FAQ of typical objections or questions and responses and a couple of stylized diagrams and just titles of objections and questions with 1 or 2 sentence summaries of the answers, mayhaps a couple of equations.
I’m not sure I picked up the distinction between atmospheric absorption and atmospheric emission (not an engineer). How do these two relate?
It’s nice to see some reasonably sophisticated discussion of climate modeling. I would just note that once the feedbacks are introduced the system becomes useless as a predictive tool. See for example http://www.neutralclimate.com/?page_id=28 for some examples of the sensitivity of a coupled, non-linear, dynamic system. Sorry, more math at that page.
[Response: Not really. Because there are systems that are unpredictable, it doesn’t follow that all systems are. Why does the climate cool systematically whenever there is a large volcanic eruption? Why are the ice age patterns so regular and related to orbital forcings? Why are the seasons so clear? If the whole thing was completely chaotic and unpredictable none of this would be observable. – gavin]
As another engineer with plenty of math background, I too appreciated this post and would like to see more along the same lines. (A few sketches indicating the direction of the various components of the energy balance might make it even clearer, though.)
One reference I’ve found to be accessible is Roland Stull’s “Meteorology for Scientists and Engineers”. His chapter on climate change has an analysis similar to Gavin’s, with more on water-vapor, cloud, and albedo feedbacks at a similar level of detail.
I apologize in advance — I haven’t figured out how to write equations in Latex. For those who know just a smidgeon about math, it might have been nice to mention that the factor comes from the derivative of the Stefan Boltzmann equation:
[Response: I edited your equations to work with latex. You simply enclose them in [ tex ] and [ / tex ] pairs (no spaces). – gavin]
I can read the equations OK, but they don’t copy. I could take snapshots [shift-control-3] or I could copy the article into Word5 for Mac and then re-create the equations with equation editor. But #33’s method:
Divide equation 2 by (2*lambda), you get A = 0.5 * G
Substitute (0.5 * G) for A in equation 1, you get S + 0.5 * lambda * G = G
Rearrange that, you get S = (1 – 0.5 * lambda) * G
Divide by (1 – 0.5 * lambda), you get G = S / [1 – 0.5 * lambda]
works really well. Why not do the math that way since we can all read and copy it? I am using a 16 year old Mac with OS 9.1 and ie5. The machine cannot be upgraded further. To read Adobe Acrobat [no higher than version 4] I have to sneakernet to another ancient machine. The max sneakernet file size is 1.3 meg. I cannot translate acrobat to word. LaTeX is out of the range of possibility. Please use Tamino’s method of writing math.
This is an excellent addition to Real Climate, even if the math totally eludes me thus far. I will figure it out.
For those of you old folks who grew up in Massachusetts, you probably remember Channel 4 meteorologist Don Kent often mentioning radiational cooling as being the cause of very low temps. on clear winter nights in places like Athol, Mass. and Keene, New Hampshire. Don Kent often took time to explain exactly what radiational cooling was, and how a clear dry winter night, without water vapor or clouds in the sky, allowed more heat to leak back into space, thus radiational cooling. I remember this from when I was 7 years old.
Also the history material provided by Spencer Weart in Comment #1 is outstanding.
This site is an enormously valuable resource, which is why I cite and post it as often as possible.