As we did roughly a year ago (and as we will probably do every year around this time), we can add another data point to a set of reasonably standard model-data comparisons that have proven interesting over the years.
First, here is the update of the graph showing the annual mean anomalies from the IPCC AR4 models plotted against the surface temperature records from the HadCRUT3v, NCDC and GISTEMP products (it really doesn’t matter which). Everything has been baselined to 1980-1999 (as in the 2007 IPCC report) and the envelope in grey encloses 95% of the model runs.
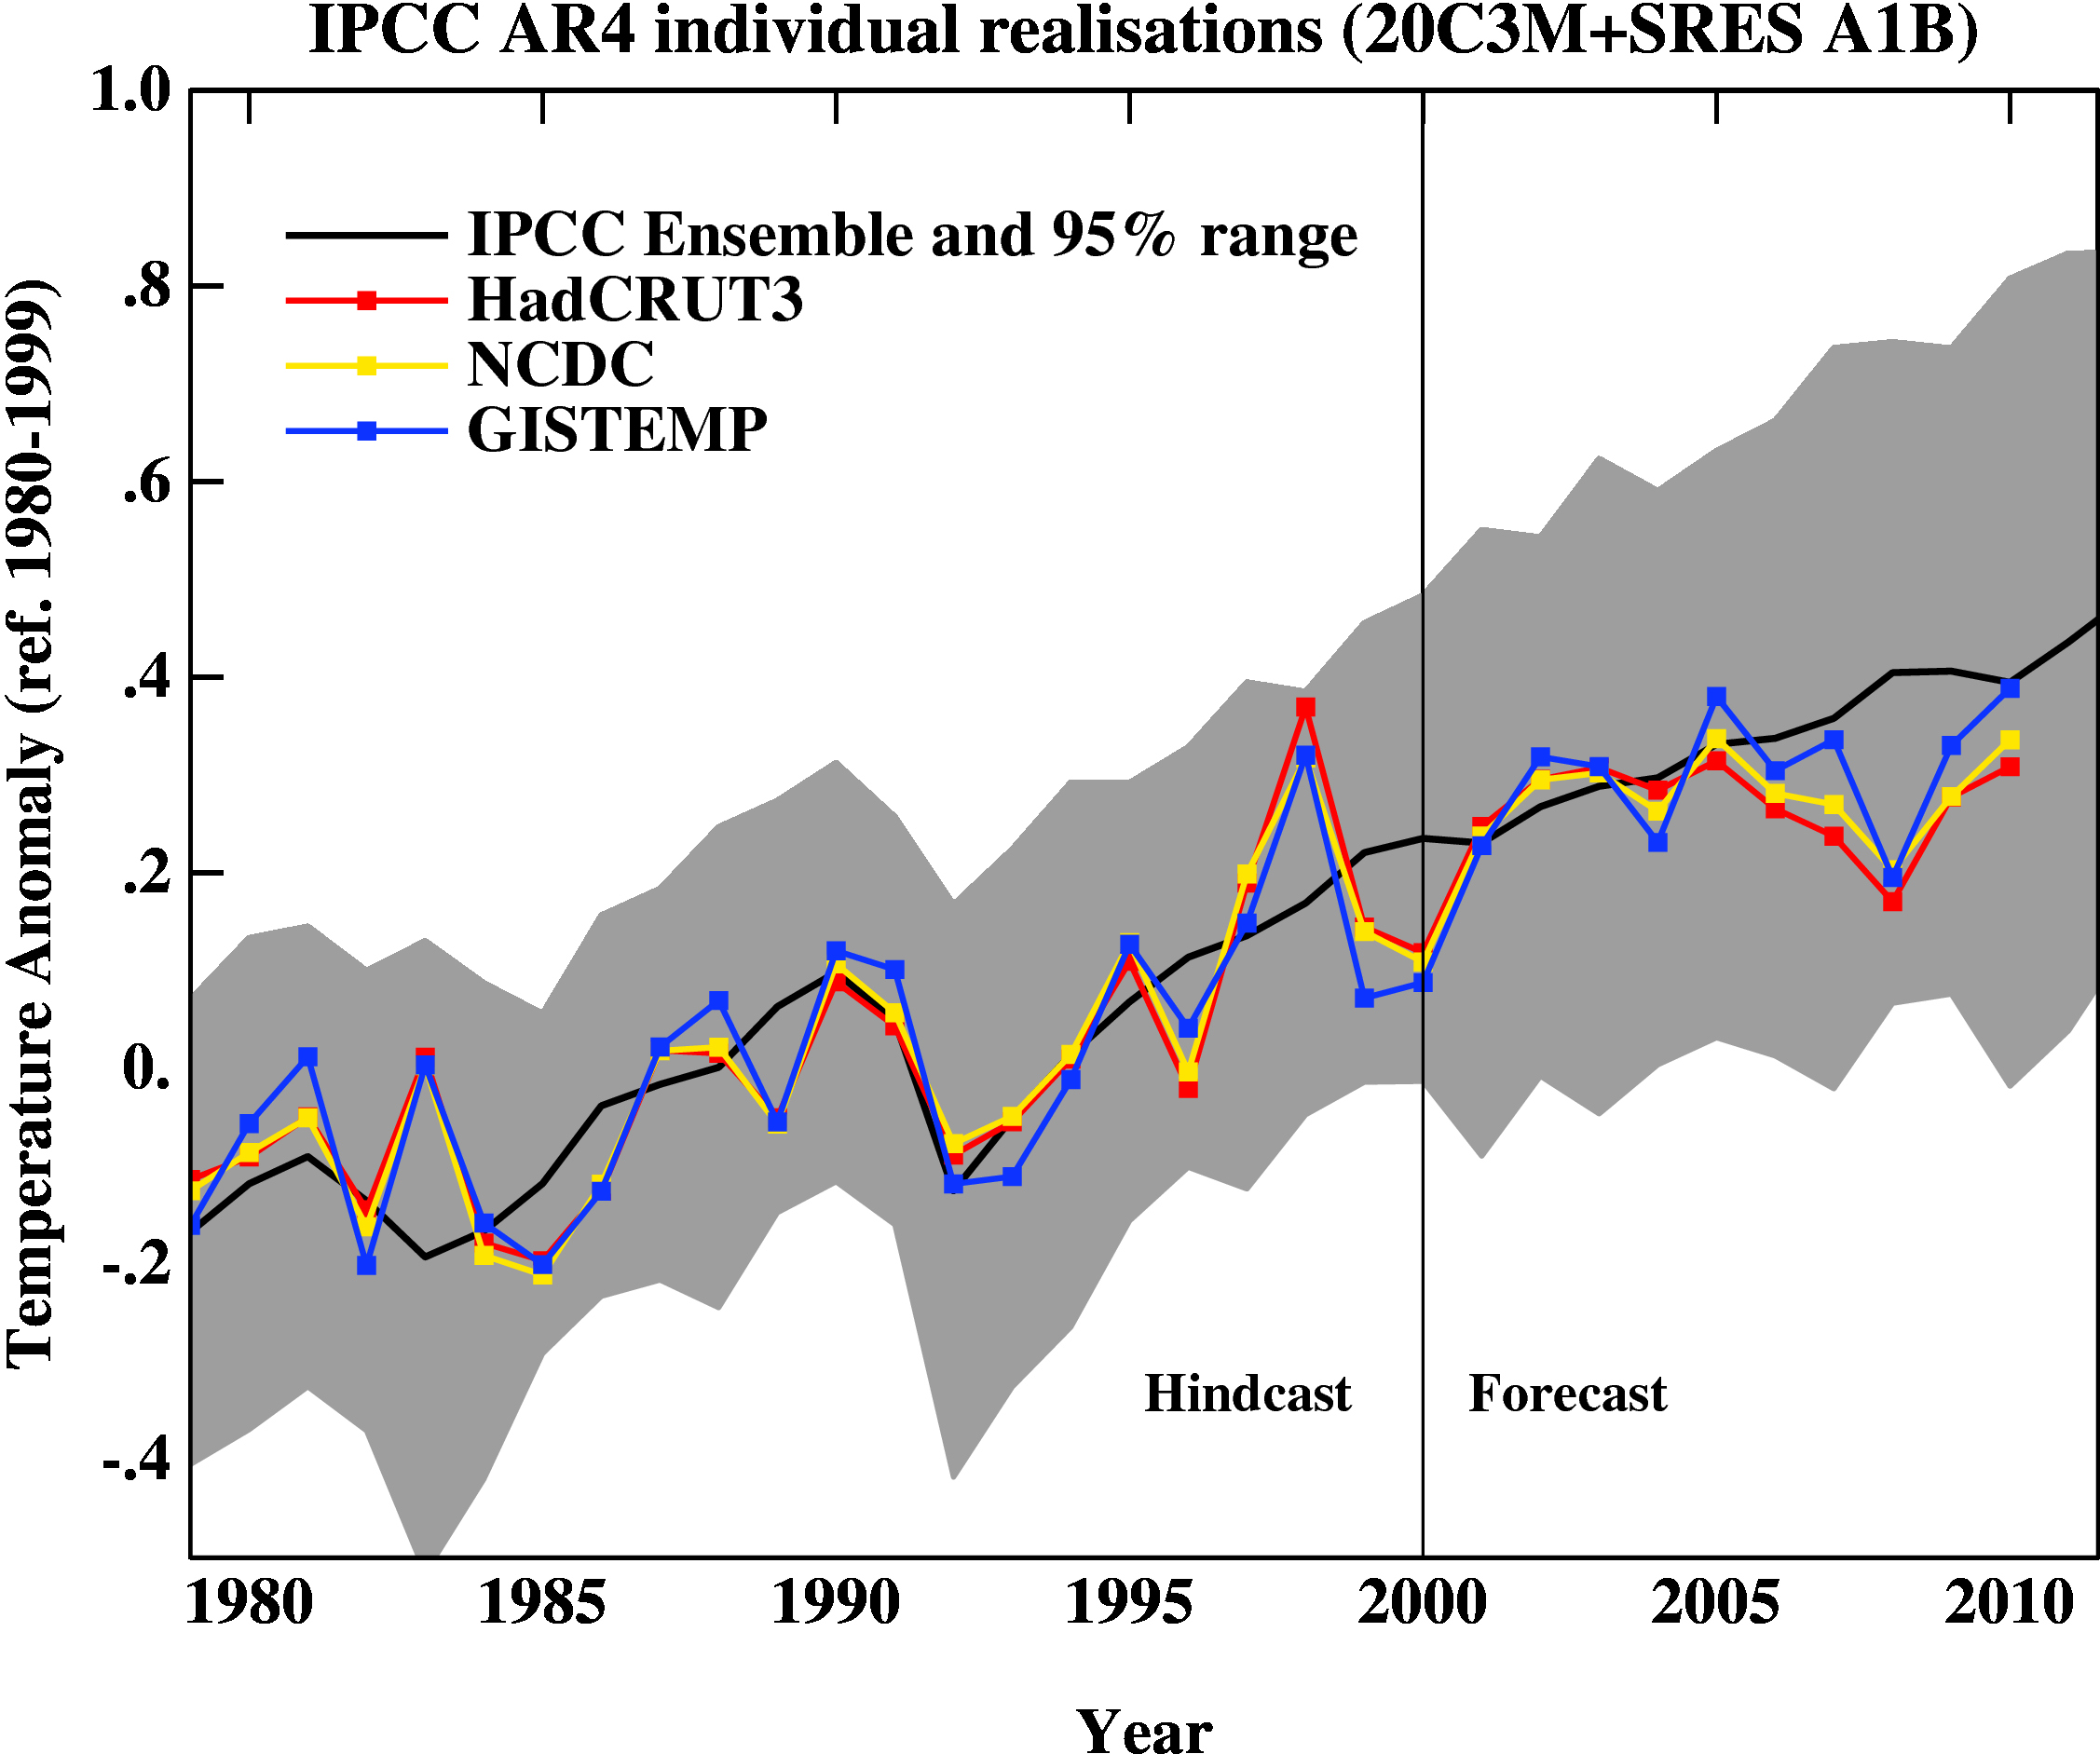
The El Niño event that started off 2010 definitely gave last year a boost, despite the emerging La Niña towards the end of the year. An almost-record summer melt in the Arctic was also important (and probably key in explaining the difference between GISTEMP and the others). Checking up on our predictions from last year, we forecast that 2010 would be warmer than 2009 (because of the ENSO phase last January). Consistent with that, I predict that 2011 will not be quite as warm as 2010, but it will still rank easily amongst the top ten warmest years of the historical record.
The comments on last year’s post (and responses) are worth reading before commenting on this post, and there are a number of points that shouldn’t need to be repeated again:
- Short term (15 years or less) trends in global temperature are not usefully predictable as a function of current forcings. This means you can’t use such short periods to ‘prove’ that global warming has or hasn’t stopped, or that we are really cooling despite this being the warmest decade in centuries.
- The AR4 model simulations are an ‘ensemble of opportunity’ and vary substantially among themselves with the forcings imposed, the magnitude of the internal variability and of course, the sensitivity. Thus while they do span a large range of possible situations, the average of these simulations is not ‘truth’.
- The model simulations use observed forcings up until 2000 (or 2003 in a couple of cases) and use a business-as-usual scenario subsequently (A1B). The models are not tuned to temperature trends pre-2000.
- Differences between the temperature anomaly products is related to: different selections of input data, different methods for assessing urban heating effects, and (most important) different methodologies for estimating temperatures in data-poor regions like the Arctic. GISTEMP assumes that the Arctic is warming as fast as the stations around the Arctic, while HadCRUT and NCDC assume the Arctic is warming as fast as the global mean. The former assumption is more in line with the sea ice results and independent measures from buoys and the reanalysis products.
There is one upcoming development that is worth flagging. Long in development, the new Hadley Centre analysis of sea surface temperatures (HadISST3) will soon become available. This will contain additional newly-digitised data, better corrections for artifacts in the record (such as highlighted by Thompson et al. 2007), and corrections to more recent parts of the record because of better calibrations of some SST measuring devices. Once it is published, the historical HadCRUT global temperature anomalies will also be updated. GISTEMP uses HadISST for the pre-satellite era, and so long-term trends may be affected there too (though not the more recent changes shown above).
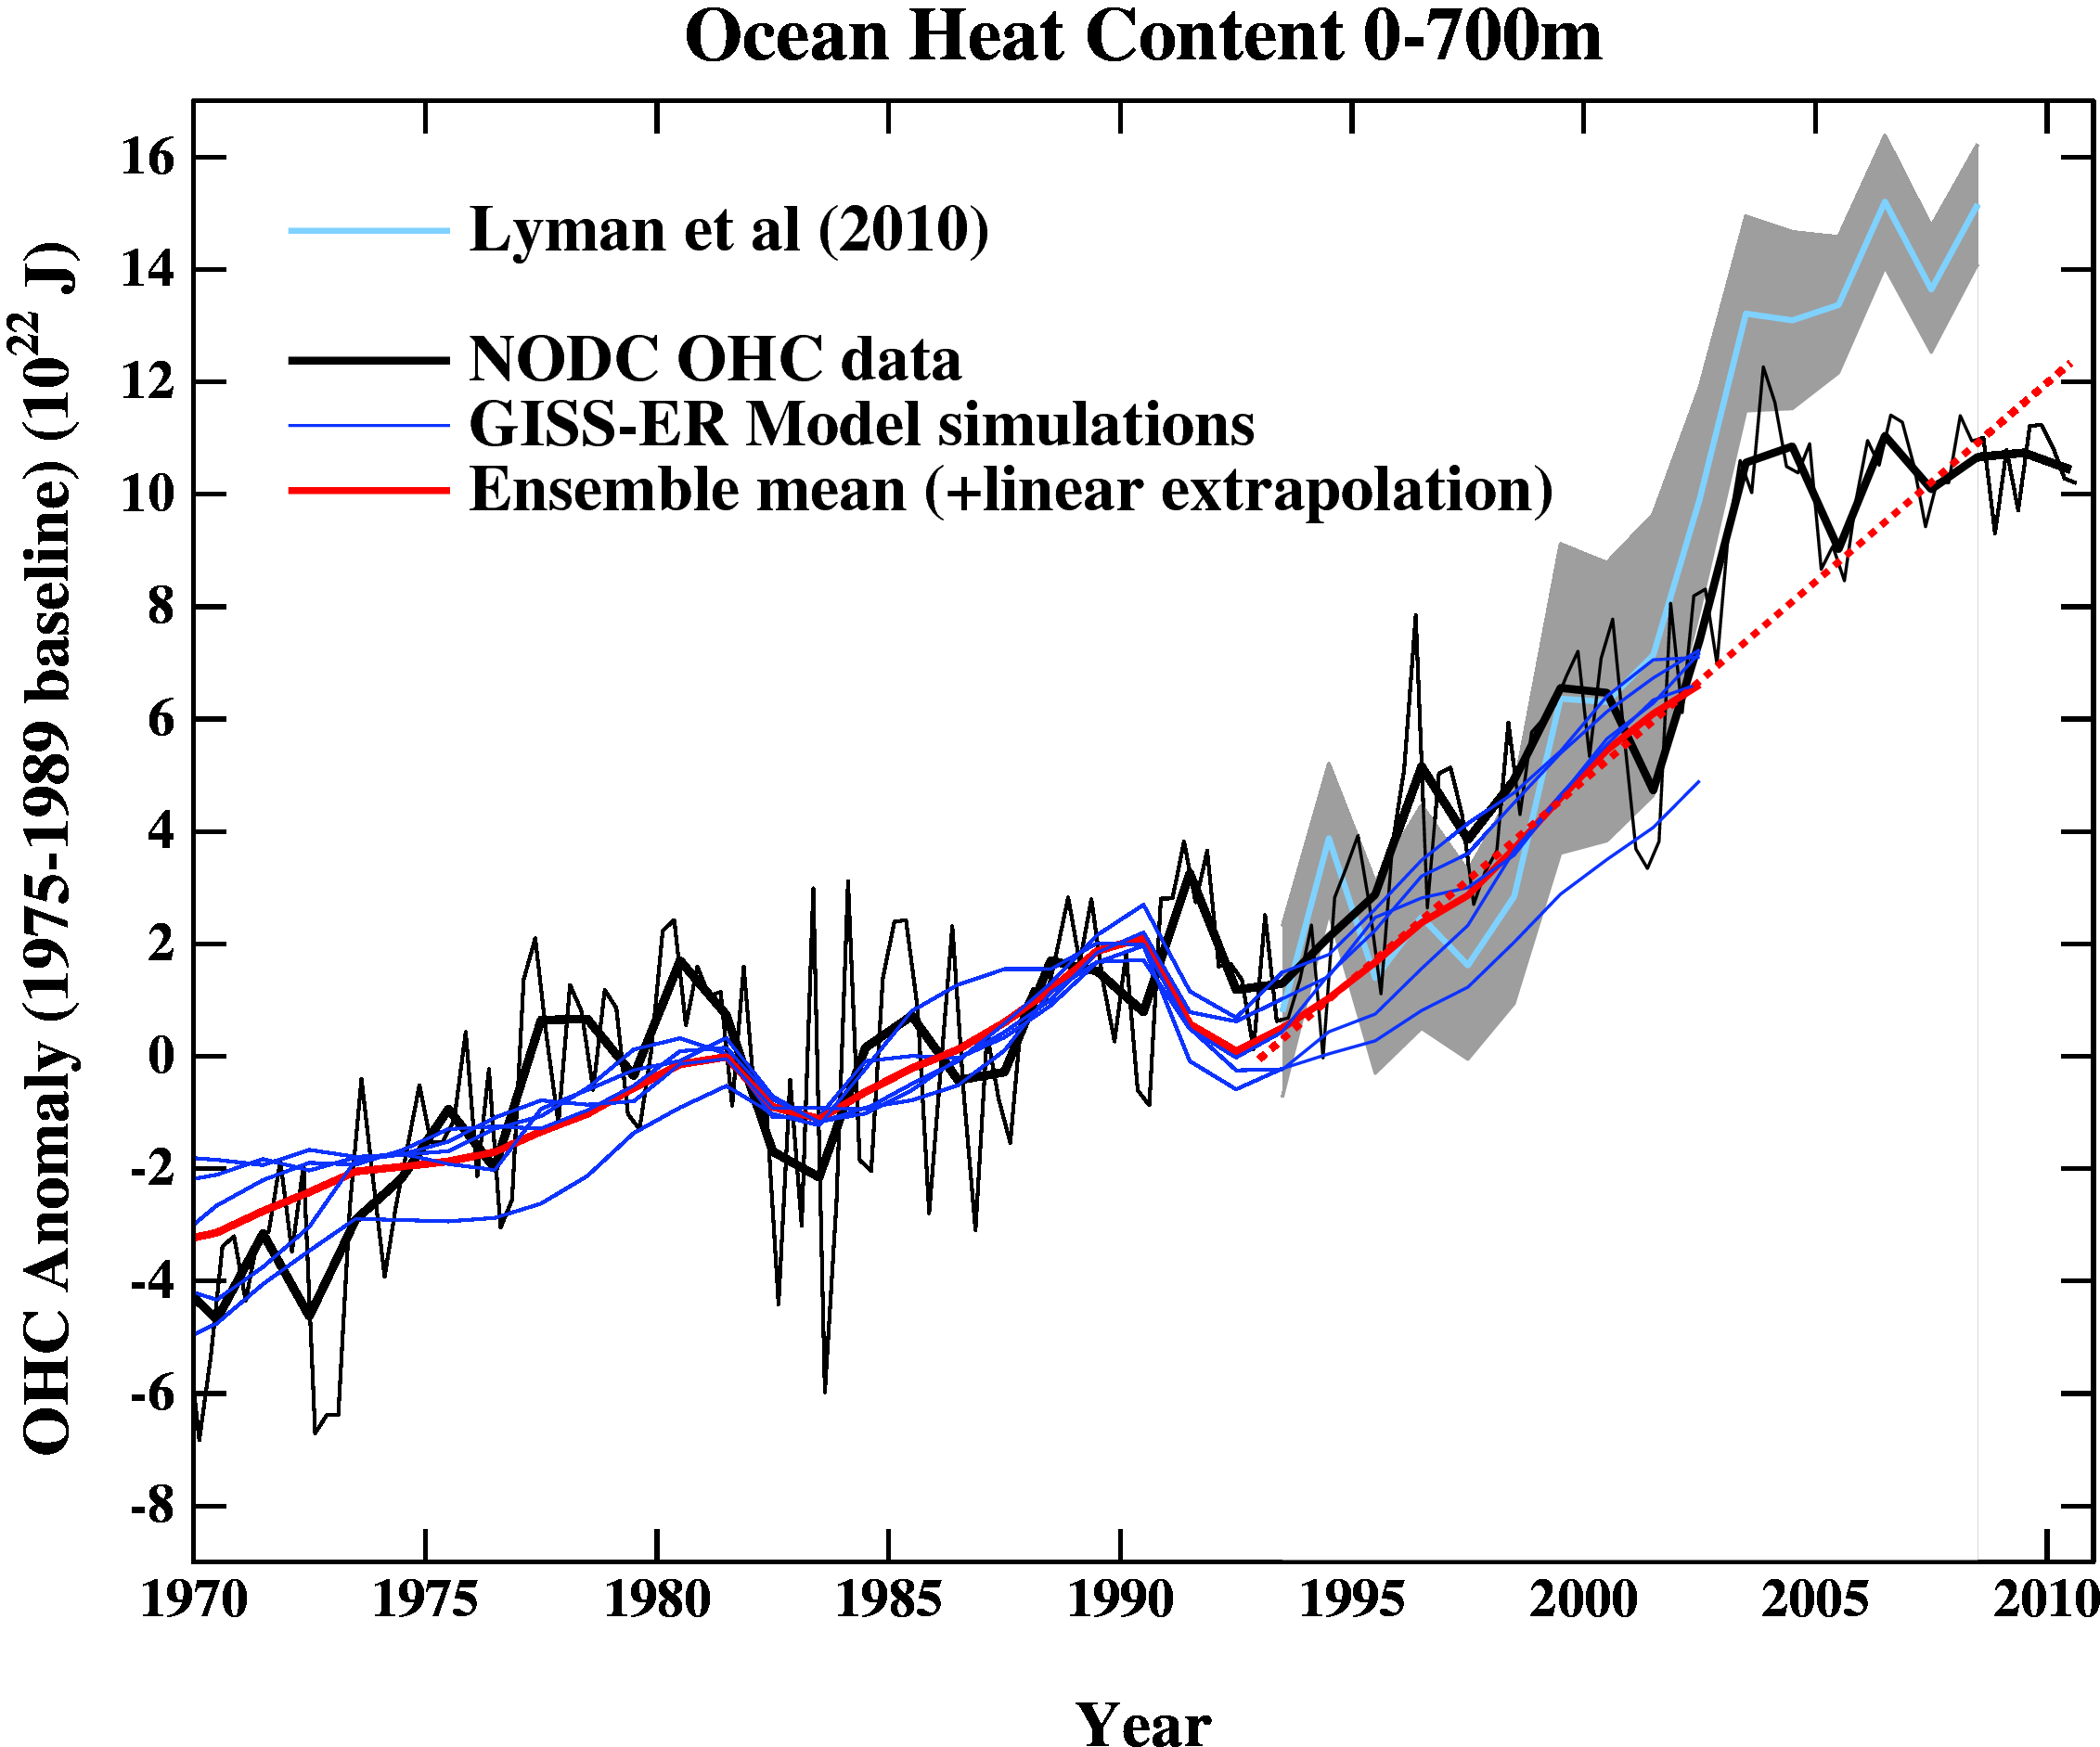
The next figure is the comparison of the ocean heat content (OHC) changes in the models compared to the latest data from NODC. As before, I don’t have the post-2003 model output, but the comparison between the 3-monthly data (to the end of Sep) and annual data versus the model output is still useful.
To include the data from the Lyman et al (2010) paper, I am baselining all curves to the period 1975-1989, and using the 1993-2003 period to match the observational data sources a little more consistently. I have linearly extended the ensemble mean model values for the post 2003 period (using a regression from 1993-2002) to get a rough sense of where those runs might have gone.
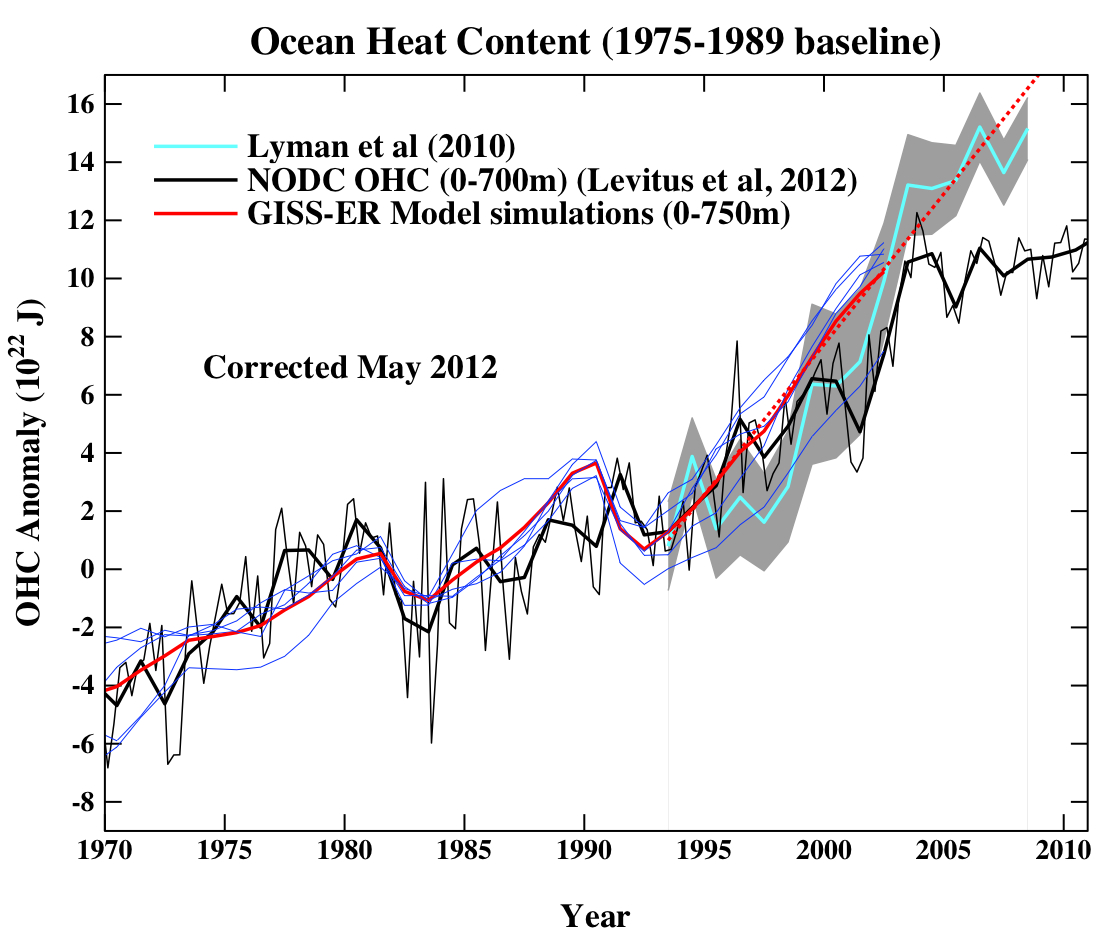
Update (May 2010): The figure has been corrected for an error in the model data scaling. The original image can still be seen here.
As can be seen the long term trends in the models match those in the data, but the short-term fluctuations are both noisy and imprecise.
Looking now to the Arctic, here’s a 2010 update (courtesy of Marika Holland) showing the ongoing decrease in September sea ice extent compared to a selection of the AR4 models, again using the A1B scenario (following Stroeve et al, 2007):
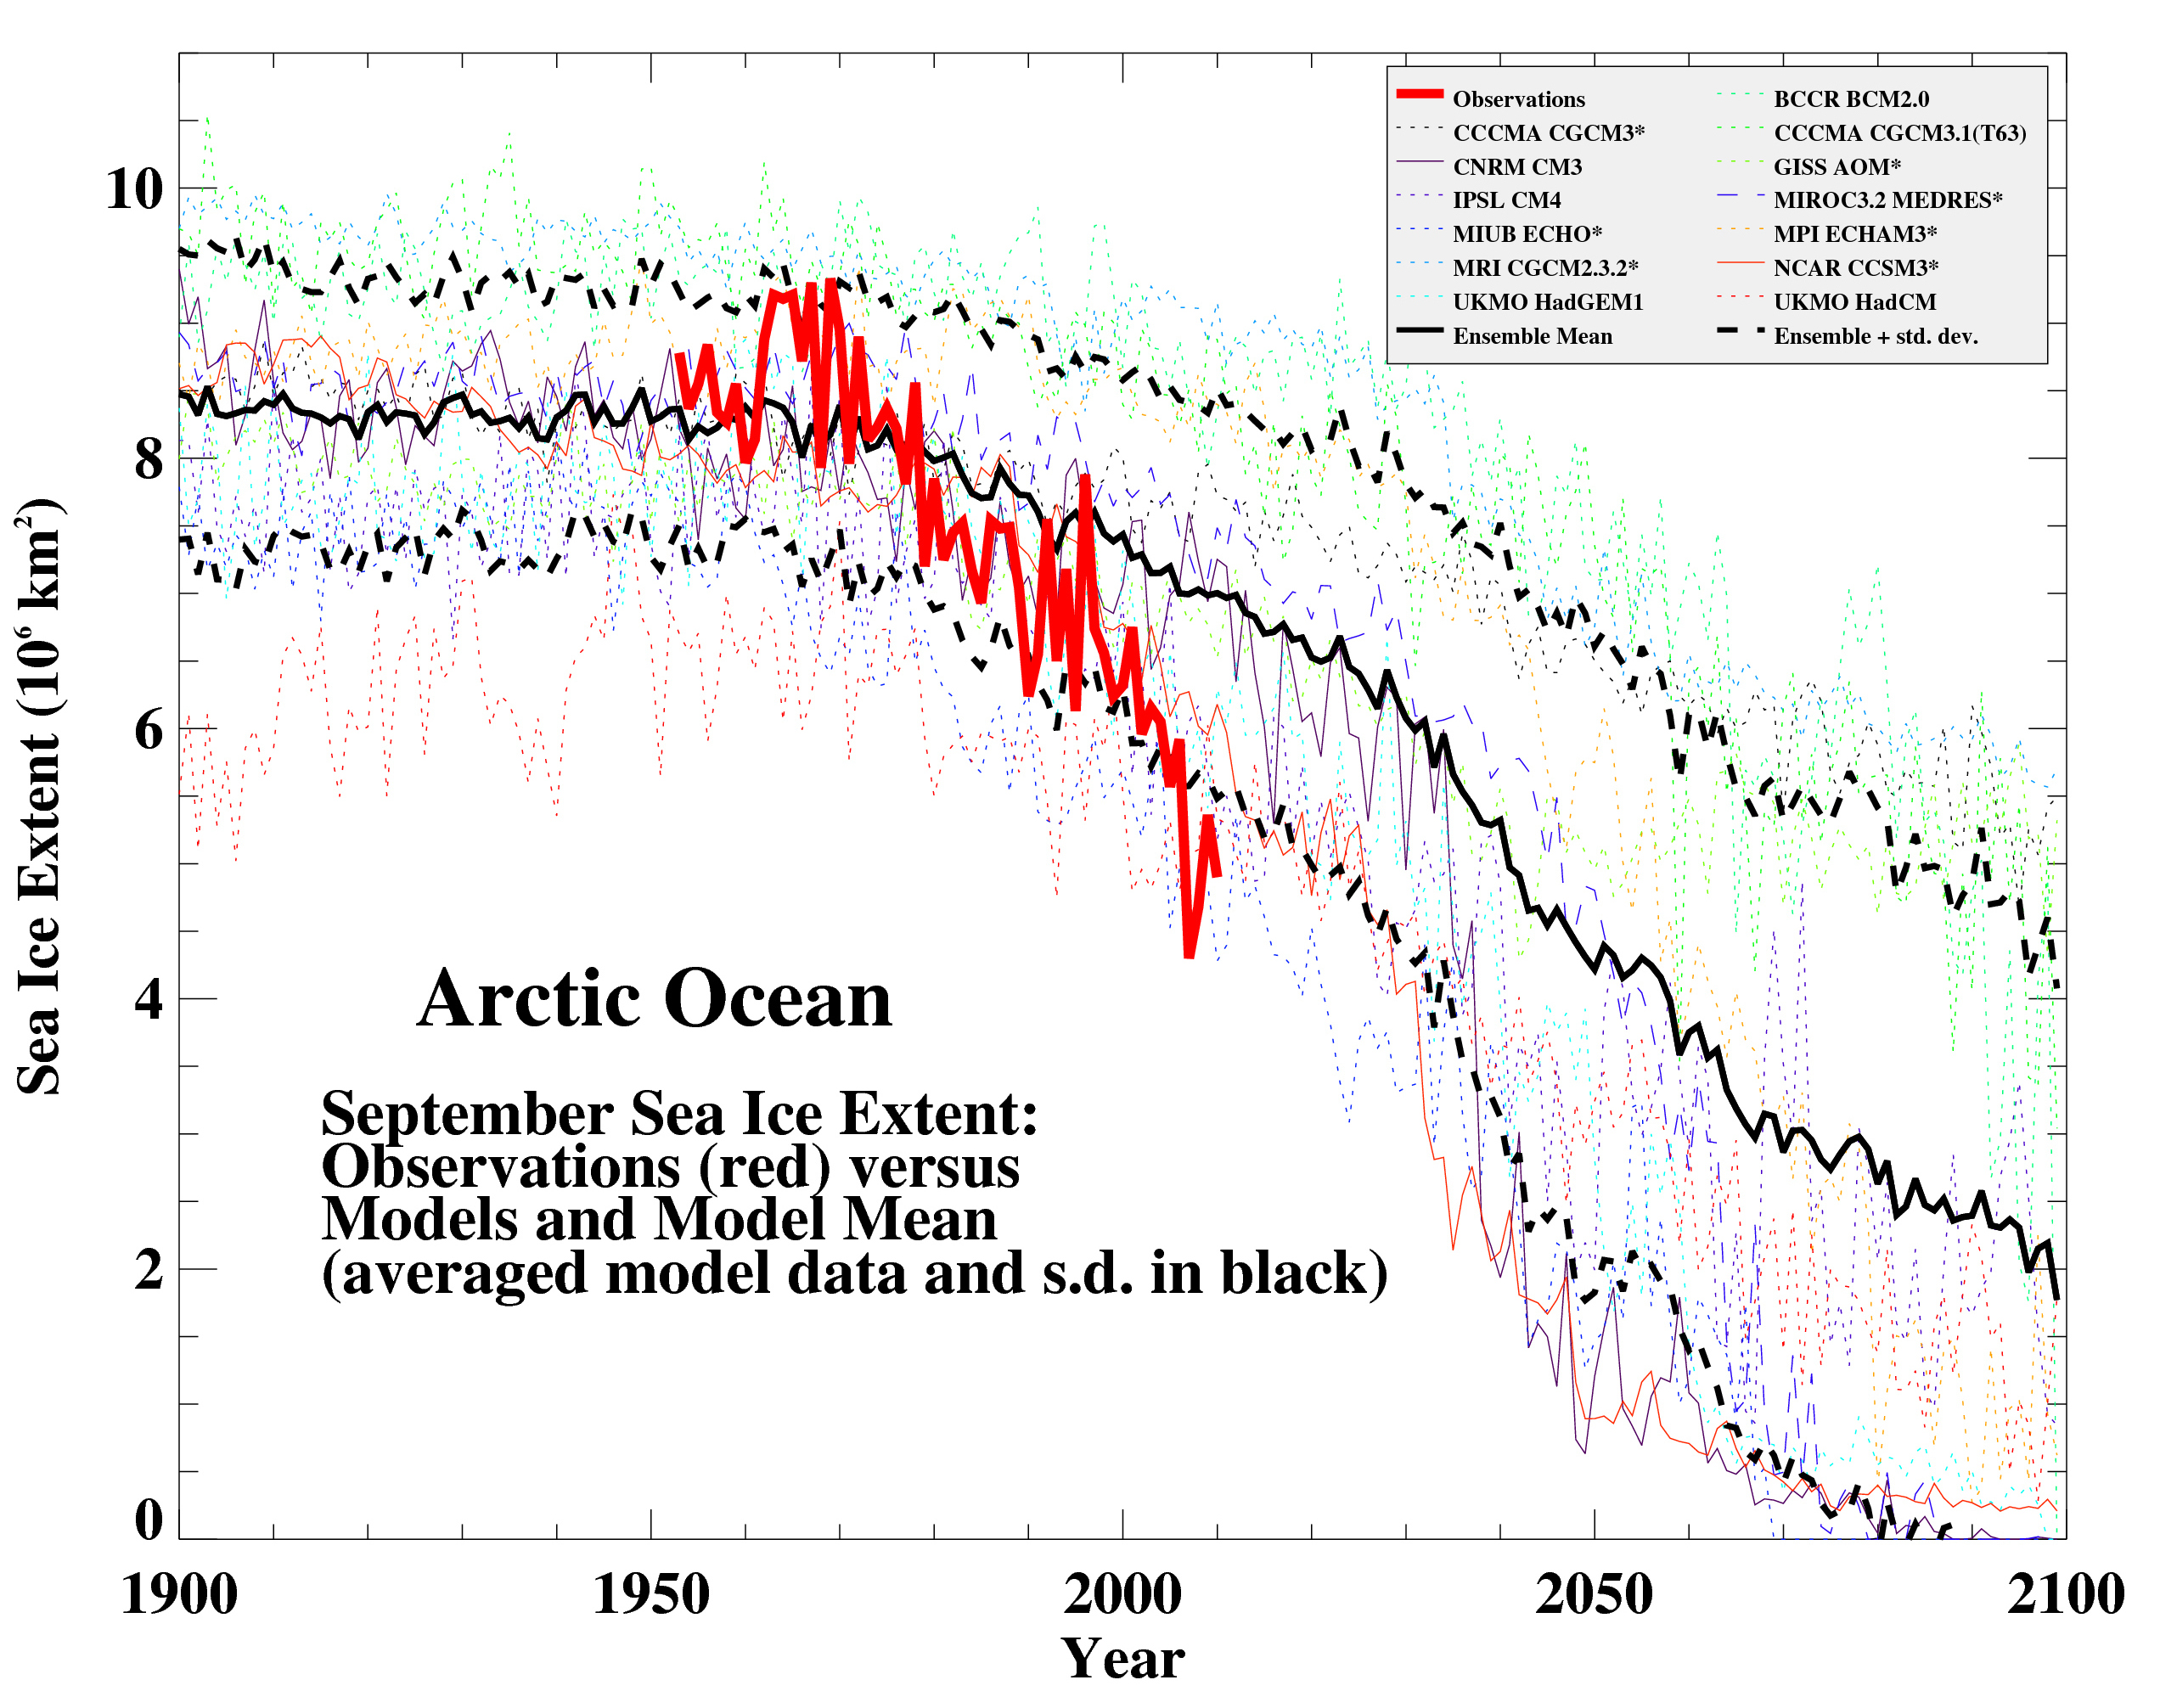
In this case, the match is not very good, and possibly getting worse, but unfortunately it appears that the models are not sensitive enough.
Finally, we update the Hansen et al (1988) comparisons. As stated last year, the Scenario B in that paper is running a little high compared with the actual forcings growth (by about 10%) (and high compared to A1B), and the old GISS model had a climate sensitivity that was a little higher (4.2ºC for a doubling of CO2) than the best estimate (~3ºC).
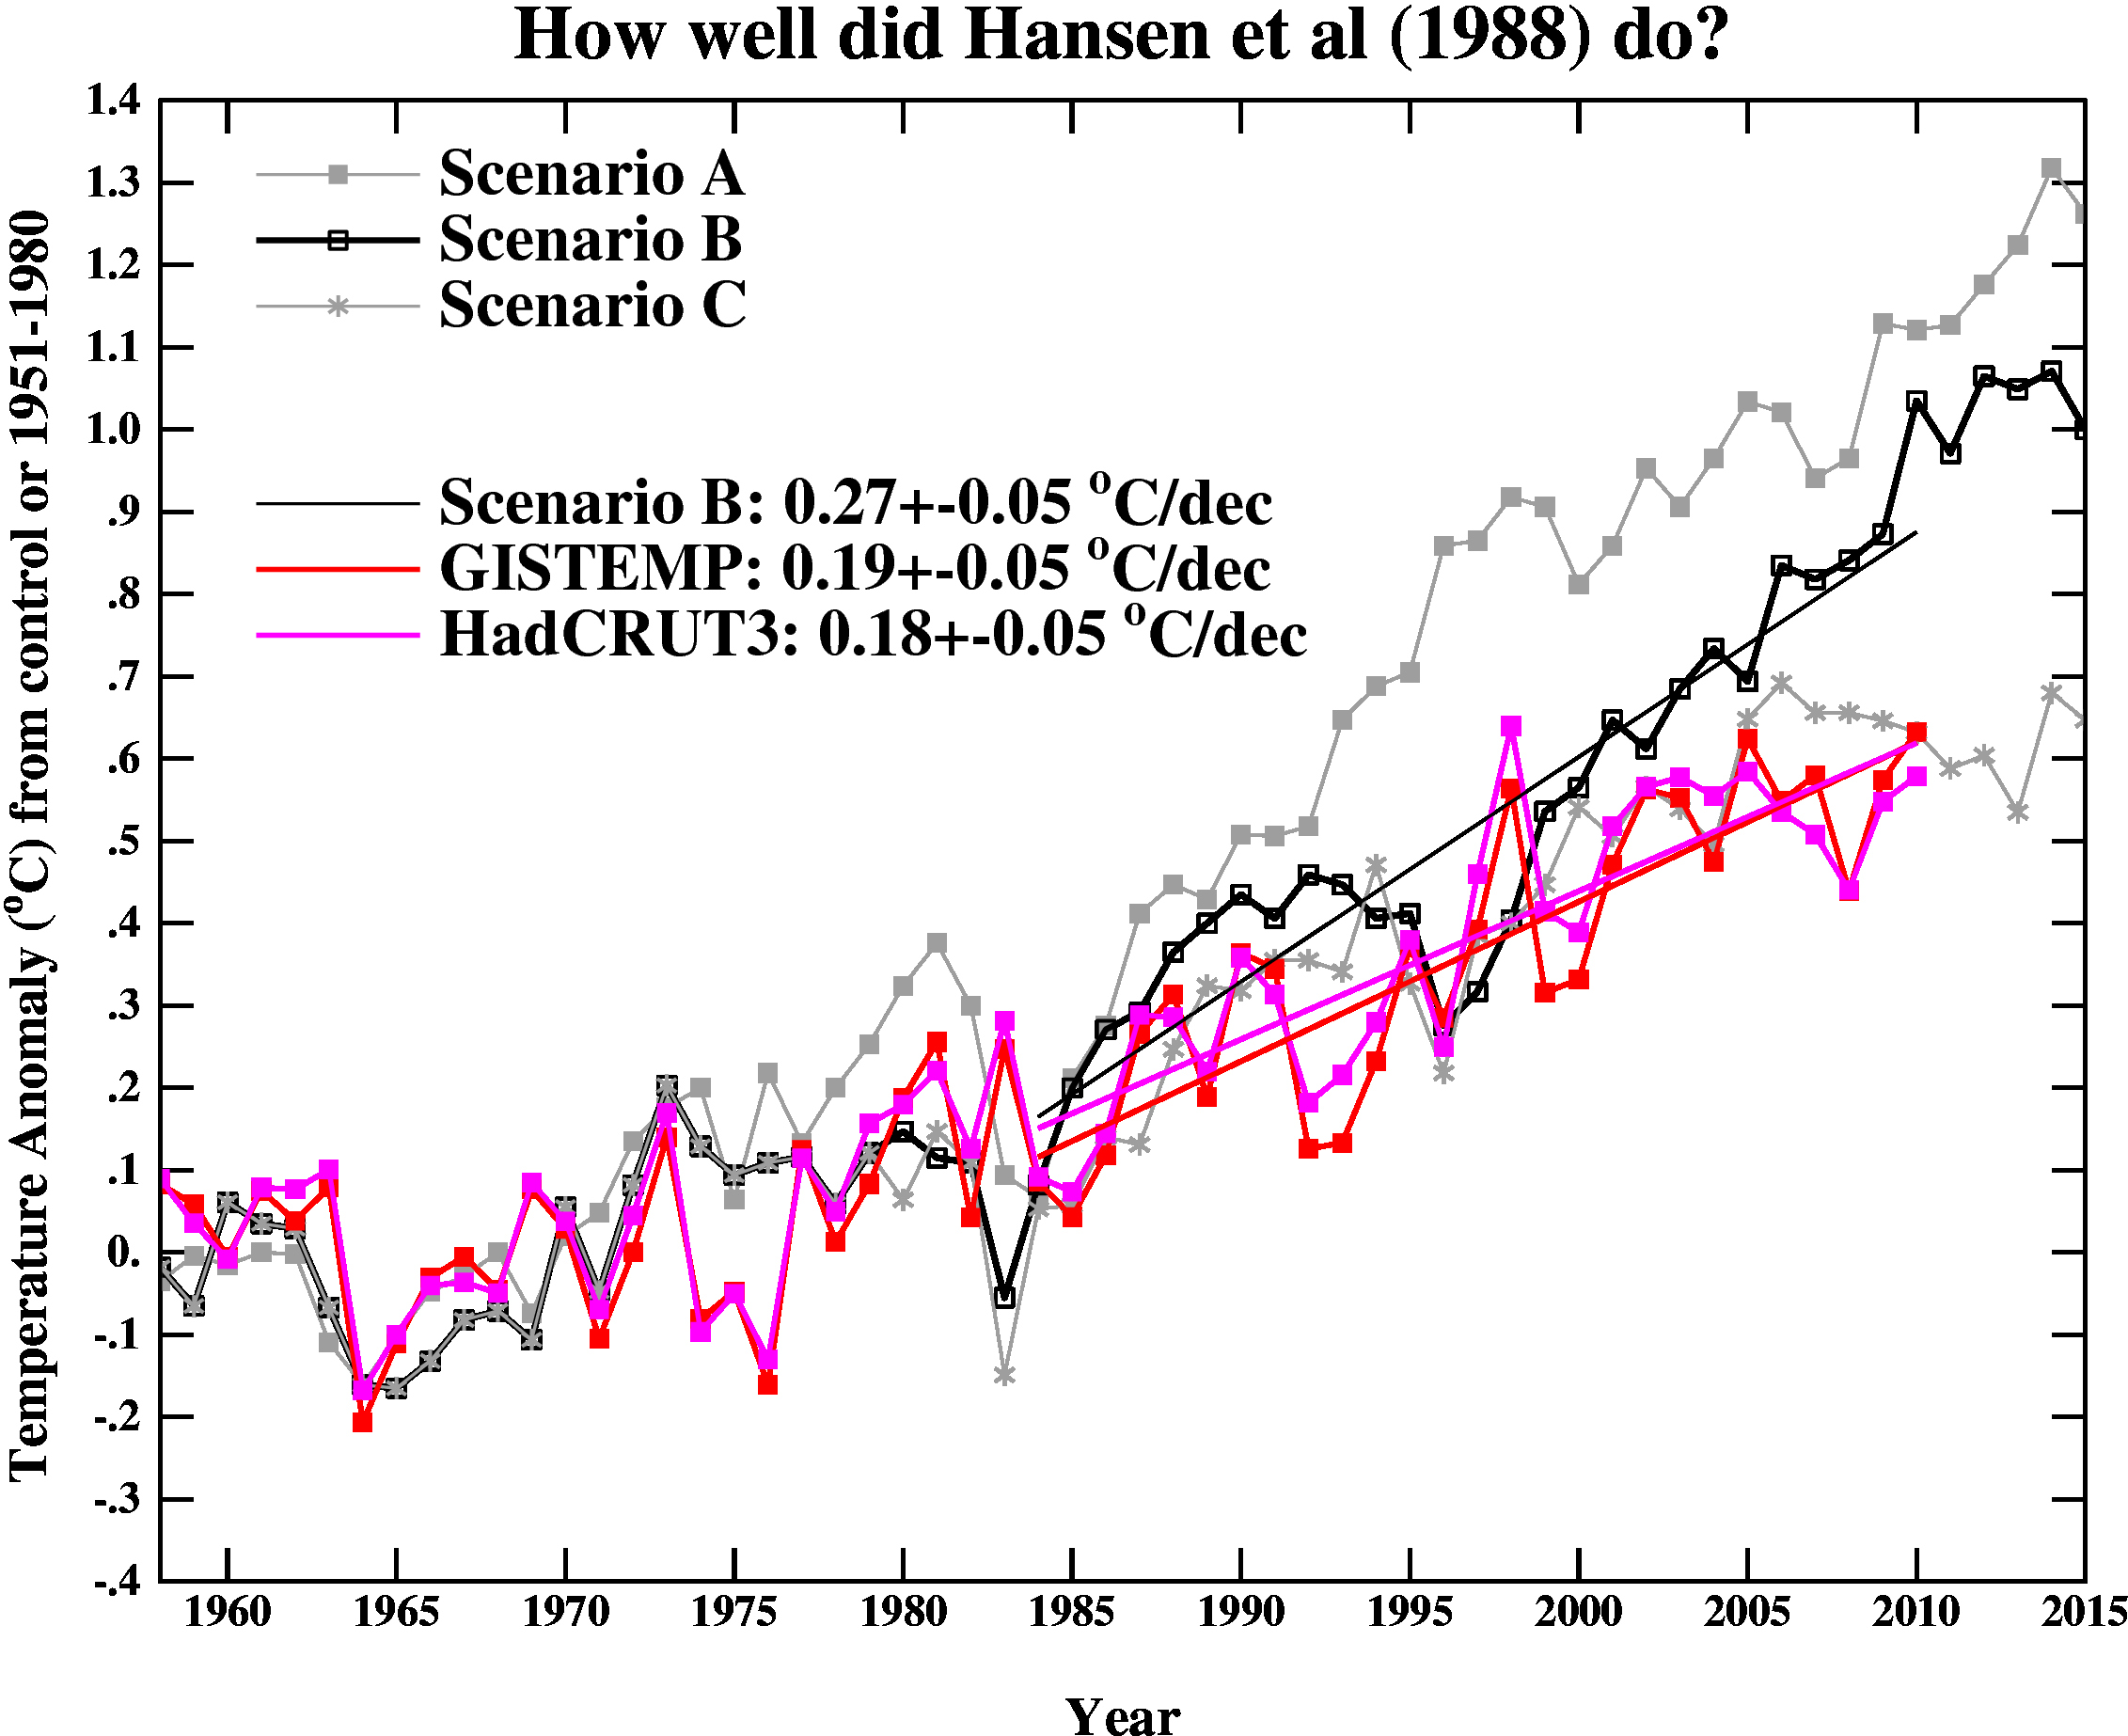
The trends for the period 1984 to 2010 (the 1984 date chosen because that is when these projections started), scenario B has a trend of 0.27+/-0.05ºC/dec (95% uncertainties, no correction for auto-correlation). For the GISTEMP and HadCRUT3, the trends are 0.19+/-0.05 and 0.18+/-0.04ºC/dec (note that the GISTEMP met-station index has 0.23+/-0.06ºC/dec and has 2010 as a clear record high).
As before, it seems that the Hansen et al ‘B’ projection is likely running a little warm compared to the real world. Repeating the calculation from last year, assuming (again, a little recklessly) that the 27 yr trend scales linearly with the sensitivity and the forcing, we could use this mismatch to estimate a sensitivity for the real world. That would give us 4.2/(0.27*0.9) * 0.19=~ 3.3 ºC. And again, it’s interesting to note that the best estimate sensitivity deduced from this projection, is very close to what we think in any case. For reference, the trends in the AR4 models for the same period have a range 0.21+/-0.16 ºC/dec (95%).
So to conclude, global warming continues. Did you really think it wouldn’t?
Elliot, see #109 this was the response
[Response: No it didn’t. The different scenarios have net radiative forcing in 2010 (with respect to 1984) of 1.6 W/m2, 1.2 W/m2 and 0.5 W/m2 – compared to ~1.1 W/m2 in the observed forcing since then. The test of the model is whether, given the observed changes in forcing, it produces a skillful prediction using the scenario most closely related to the observations – which is B (once you acknowledge the slight overestimate in the forcings). One could use the responses of all three scenarios relative to their specific forcings to make an estimate of what the model would have given using the exact observed forcings, but just using scenario C – which has diverged significantly from the actual forcings – is not going to be useful. This is mainly because of the time lag to the forcings – the differences between B and C temperature trends aren’t yet significant (though they will be in a few years), and in 2010 do not reflect the difference in scenario. If you are suggesting that scenario C will continue to be a better fit, I think this is highly unlikely. – gavin]
Try reading all comments,
Relevant to determining a prior for S in 1959 is
https://www.realclimate.org/index.php/archives/2010/01/the-carbon-dioxide-theory-of-gilbert-plass/
where he “lucked out” with 3.6 K in his Tellus paper
http://onlinelibrary.wiley.com/doi/10.1111/j.2153-3490.1956.tb01206.x/abstract
And we’re in this weird solar minimum … which of course denialists insist proves “it’s the sun” proving “CO2 means nothing” (stupidity left for the reader to judge). (hint, if it were just the sun we’d be seeing cooling…)
As an amateur “graph ‘eyeballer'”, I am disappointed in my fellow eyeballer’s performances here. T is obviously about to pierce scenario C and leave it in the dust. As quickly as T fell away from scenario B, it could also catch up.
I don’t know how it will do this. Us graph eyeballers are ethically restrained from guessin’ on things, but maybe China and India will install scrubbers on their smokestacks. Somethun’ like that could happen.
What setting of ocean was uesd for the 1988 runs, I used mixed-layered with deep difffusion
Year CO2-eq Temp 1958-2010
1958 309.2 0.05
1959 307 0
1960 301 -0.08
1961 291 -0.18
1962 287 -0.14
1963 249 -0.3
1964 223 -0.39
1965 255 -0.45
1966 281 -0.33
1967 294 -0.24
1968 280 -0.24
1969 274 -0.37
1970 298 -0.28
1971 310 -0.29
1972 316 -0.25
1973 311 -0.19
1974 305 -0.24
1975 283 -0.21
1976 307 -0.28
1977 323 -0.16
1978 326 -0.14
1979 329 -0.08
1980 338 0
1981 341 0.02
1982 275 -0.12
1983 251 -0.33
1984 305 -0.21
1985 330 -0.11
1986 332 -0.08
1987 341 0
1988 351 -0.01
1989 363 0.03
1990 364 0.11
1991 297 -0.08
1992 221 -0.36
1993 303 -0.25
1994 343 0.02
1995 361 0.05
1996 367 0.14
1997 372 0.13
1998 384 0.2
1999 392 0.36
2000 397 0.42
2001 397 0.37
2002 399 0.4
2003 401 0.45
2004 400 0.51
2005 399 0.48
2006 399 0.51
2007 400 0.55
2008 401 0.55
2009 405 0.52
2010 410 0.52