• Skip to primary navigation
  • Skip to main content
  • Skip to primary sidebar
  • Skip to footer

RealClimate

Climate science from climate scientists...

  • Start here
  • Model-Observation Comparisons
  • Miscellaneous Climate Graphics
  • Surface temperature graphics
You are here: Home / Archives for 2020

Archives for 2020

One more data point

15 Jan 2020 by Gavin

The climate summaries for 2019 are all now out. None of this will be a surprise to anyone who’s been paying attention, but the results are stark.

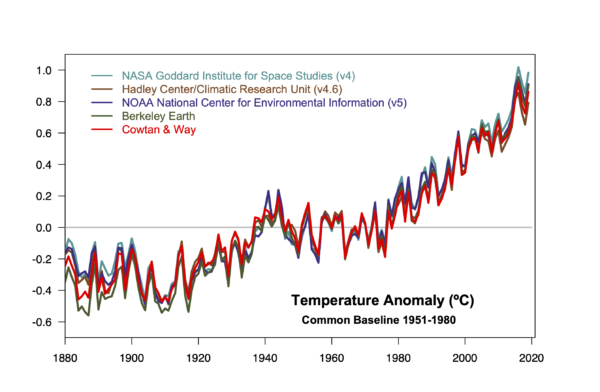
  • 2019 was the second warmest year (in analyses from GISTEMP, NOAA NCEI, ERA5, JRA55, Berkeley Earth and Cowtan & Way, RSS TLT), it was third warmest in the standard HadCRUT4 product and in the UAH TLT. It was the warmest year in the AIRS Ts product.
  • For ocean heat content, it was the warmest year, though in terms of just the sea surface temperature (HadSST3), it was the third warmest.
  • The top 5 years in all surface temperature series, are the last five years. [Update: this isn’t true for the MSU TLT data which have 2010 (RSS) and 1998 (UAH) still in the mix].
  • The decade was the first with temperatures more than 1ºC above the late 19th C in almost all products.

This year there are two new additions to the discussion, notably the ERA5 Reanalyses product (1979-2019) which is independent of the surface weather stations, and the AIRS Ts product (2003-2019) which again, is totally independent of the surface data. Remarkably, they line up almost exactly. [Update: the ERA5 system assimilates the SYNOP reports from weather stations, which is not independent of the source data for the surface temperature products. However, the interpolation is based on the model physics and many other sources of observed data.]

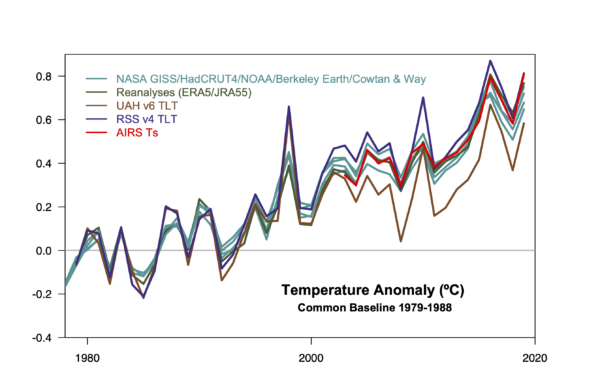
The two MSU lowermost troposphere products are distinct from the surface record (showing notably more warming in the 1998, 2010 El Niño years – though it wasn’t as clear in 2016), but with similar trends. The biggest outlier is (as usual) the UAH record, indicating that the structural uncertainty in the MSU TLT trends remains significant.

One of the most interesting comparisons this year has been the coherence of the AIRS results which come from an IR sensor on board EOS Aqua and which has been producing surface temperature estimates from 2003 onwards. The rate and patterns of warming of this and GISTEMP for the overlap period are remarkably close, and where they differ, suggest potential issues in the weather station network.

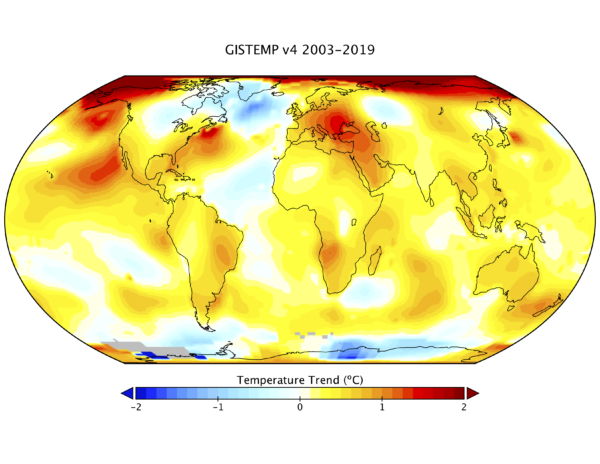
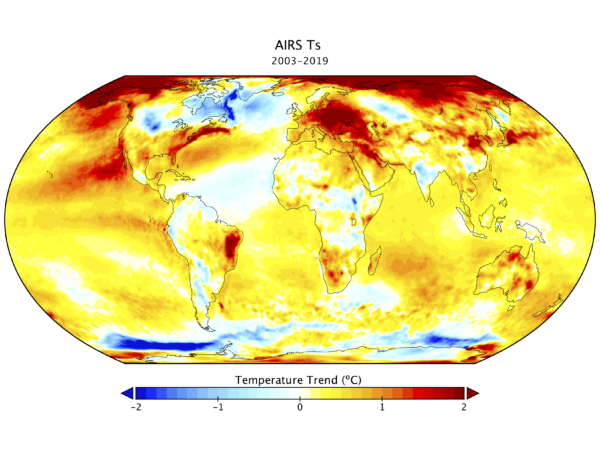
The trends over that period in the global mean are very close (0.24ºC/dec vs. 0.25ºC/dec), with AIRS showing slightly more warming in the Arctic. Interestingly, AIRS 2019 slightly beats 2016 in their ranking.

I will be updating the model/observation comparisons over the next few days.

Filed Under: Climate Science, In the News, Instrumental Record

Unforced variations: Jan 2020

1 Jan 2020 by group

The new open thread on climate science for a new year, and a new decade – perhaps the Soaring Twenties? What precisely will be soaring is yet to be decided though.

Two things will almost certainly go up – CO2 emissions and temperatures:

As 2019 wraps up, what can we look forward to in 2020?

More of the same, plus a little bit more… pic.twitter.com/nmMP6riIjZ

— Gavin Schmidt (@ClimateOfGavin) December 22, 2019

But maybe also ambition, determination, and changes that will lead to reduced emissions in future? Fingers crossed.

Filed Under: Climate Science, RC Forum

  • « Go to Previous Page
  • Page 1
  • Interim pages omitted …
  • Page 3
  • Page 4
  • Page 5

Primary Sidebar

Search

Search for:

Email Notification

get new posts sent to you automatically (free)
Loading

Recent Posts

  • Critiques of the ‘Critical Review’
  • Unforced Variations: Aug 2025
  • Are direct water vapor emissions endangering anyone?
  • The Endangerment of the Endangerment Finding?
  • National Climate Assessment links
  • Ocean circulation going South?

Our Books

Book covers
This list of books since 2005 (in reverse chronological order) that we have been involved in, accompanied by the publisher’s official description, and some comments of independent reviewers of the work.
All Books >>

Recent Comments

  • Tomáš Kalisz on Unforced Variations: Aug 2025
  • Ron R. on Critiques of the ‘Critical Review’
  • patrick o twentyseven on The Endangerment of the Endangerment Finding?
  • Ron R. on Critiques of the ‘Critical Review’
  • b fagan on Critiques of the ‘Critical Review’
  • David on Unforced Variations: Aug 2025
  • Piotr on The Endangerment of the Endangerment Finding?
  • Barry E Finch on Unforced Variations: Aug 2025
  • Piotr on The Endangerment of the Endangerment Finding?
  • Tomáš Kalisz on The Endangerment of the Endangerment Finding?
  • Ken Towe on Critiques of the ‘Critical Review’
  • Geoff Miell on Unforced Variations: Aug 2025
  • Barton Paul Levenson on Unforced Variations: Aug 2025
  • Barton Paul Levenson on Unforced Variations: Aug 2025
  • Barton Paul Levenson on Unforced Variations: Aug 2025
  • Barton Paul Levenson on Critiques of the ‘Critical Review’
  • Barton Paul Levenson on Critiques of the ‘Critical Review’
  • Barton Paul Levenson on Critiques of the ‘Critical Review’
  • Silvia Leahu-Aluas on Unforced Variations: Aug 2025
  • zebra on Critiques of the ‘Critical Review’
  • Ken Towe on Critiques of the ‘Critical Review’
  • Paul Pukite (@whut) on The Endangerment of the Endangerment Finding?
  • zebra on Unforced Variations: Aug 2025
  • Atomsk's Sanakan on The Endangerment of the Endangerment Finding?
  • Rory Allen on Critiques of the ‘Critical Review’
  • Rory Allen on Critiques of the ‘Critical Review’
  • Rory Allen on Critiques of the ‘Critical Review’
  • Silvia Leahu-Aluas on Critiques of the ‘Critical Review’
  • Rory Allen on Critiques of the ‘Critical Review’
  • Rory Allen on Critiques of the ‘Critical Review’

Footer

ABOUT

  • About
  • Translations
  • Privacy Policy
  • Contact Page
  • Login

DATA AND GRAPHICS

  • Data Sources
  • Model-Observation Comparisons
  • Surface temperature graphics
  • Miscellaneous Climate Graphics

INDEX

  • Acronym index
  • Index
  • Archives
  • Contributors

Realclimate Stats

1,375 posts

11 pages

245,799 comments

Copyright © 2025 · RealClimate is a commentary site on climate science by working climate scientists for the interested public and journalists.