Guest commentary from Nathan Lenssen (Colorado School of Mines)
A new analysis of historical temperatures suggests that things are getting warmer faster, but what does it mean for the future?
A study (Foster & Rahmstorf 2026) was published on Friday claiming evidence that “Global Warming Has Accelerated Significantly”. This study is an update by the authors of a similar study they published in 2011 where they found no statistical evidence for an acceleration in global warming. Both studies sought to determine if there is a detectable acceleration in warming, after statistically removing the effects of ENSO, volcanoes and changes in solar forcing from the observed global mean temperature (GMT) series (through to 2024).
As I’ll discuss further below, there was no detectable acceleration in the raw GMT series – this doesn’t mean there isn’t any, but that the noise (internal variability etc.) doesn’t allow us to see if there is clearly. Thus, the study has detected an acceleration in the rate of warming of inferred long-term trends – which we can pretty confidently attribute to anthropogenic effects. This study has understandably gotten substantial attention in the media. Here, I will outline what I think we have learned from this study, what this means for our understanding of the current state of the climate system, and what it means for projections of climate change (Hint: not much).
FR26 make three contributions in this recent work: (1) the production of an “adjusted” GMT series that removes statistically estimated impacts of a few short term changes in GMT, to hopefully leave just the warming associated with changes in anthropogenic forcings, (2) the detection of an acceleration in the rate of warming on this series using three different statistical methods, and (3) a forecast that 1.5ºC warming will be reached by ~2030. The methods used here are generally sound, particularly by engaging with the state of the art in changepoint detection methods as one of the methods for acceleration detection (Beaulieu et al. 2024). The figure below shows the three statistical methods for detecting changes in trend, all of which provide statistically significant evidence that the recent trend is faster than previous trends.
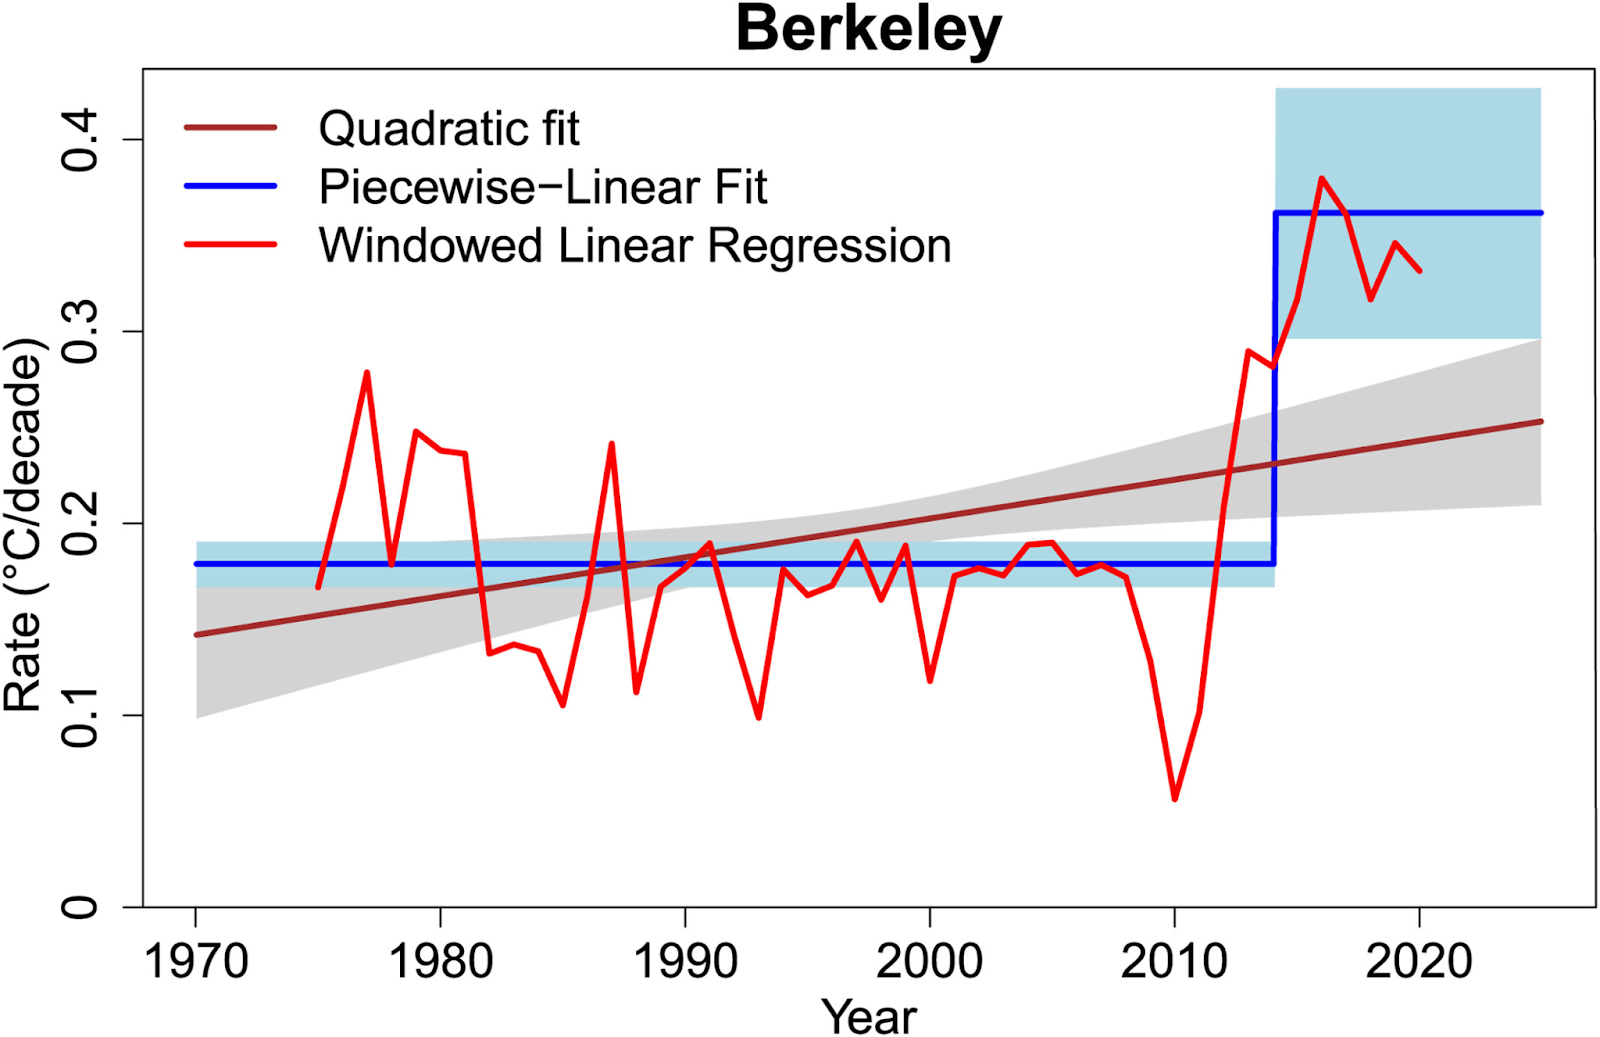
Given the assumptions made by the authors, this provides statistically robust evidence that acceleration has been detected. On first glance, this may be surprising or alarming as, to the zeroth order from our understanding of the Earth’s system’s response to CO2, we expect a roughly generally linear warming in GMT given the exponential rise in CO2 due to the log-scaling of GMT with CO2. Acceleration could be the result of the decrease of cooling anthropogenic forcings (as is hypothesized for some regional accelerations detected in Beaulieu et al. 2024) or substantial feedbacks/tipping points that are causing the Earth to warm faster than the simple CO2 forcing physics dictates. Note though that the climate models that are used to inform our future projections also expect an acceleration around now (of course, given the assumptions that went into them).
However, as the authors point out, their method of ‘removing’ ENSO could be improved (for instance, Compo and Sardeshmukh (2010)), and there is still some imprint of natural climate variability in their adjusted time series. Note that an estimate of the “true” natural variability of the climate system, and correspondingly the “true” forced response, is one of the white whale problems in climate science! FR26 does an credible, but necessarily imperfect, job of isolating the forced response, but don’t account for this uncertainty in their statistical tests.
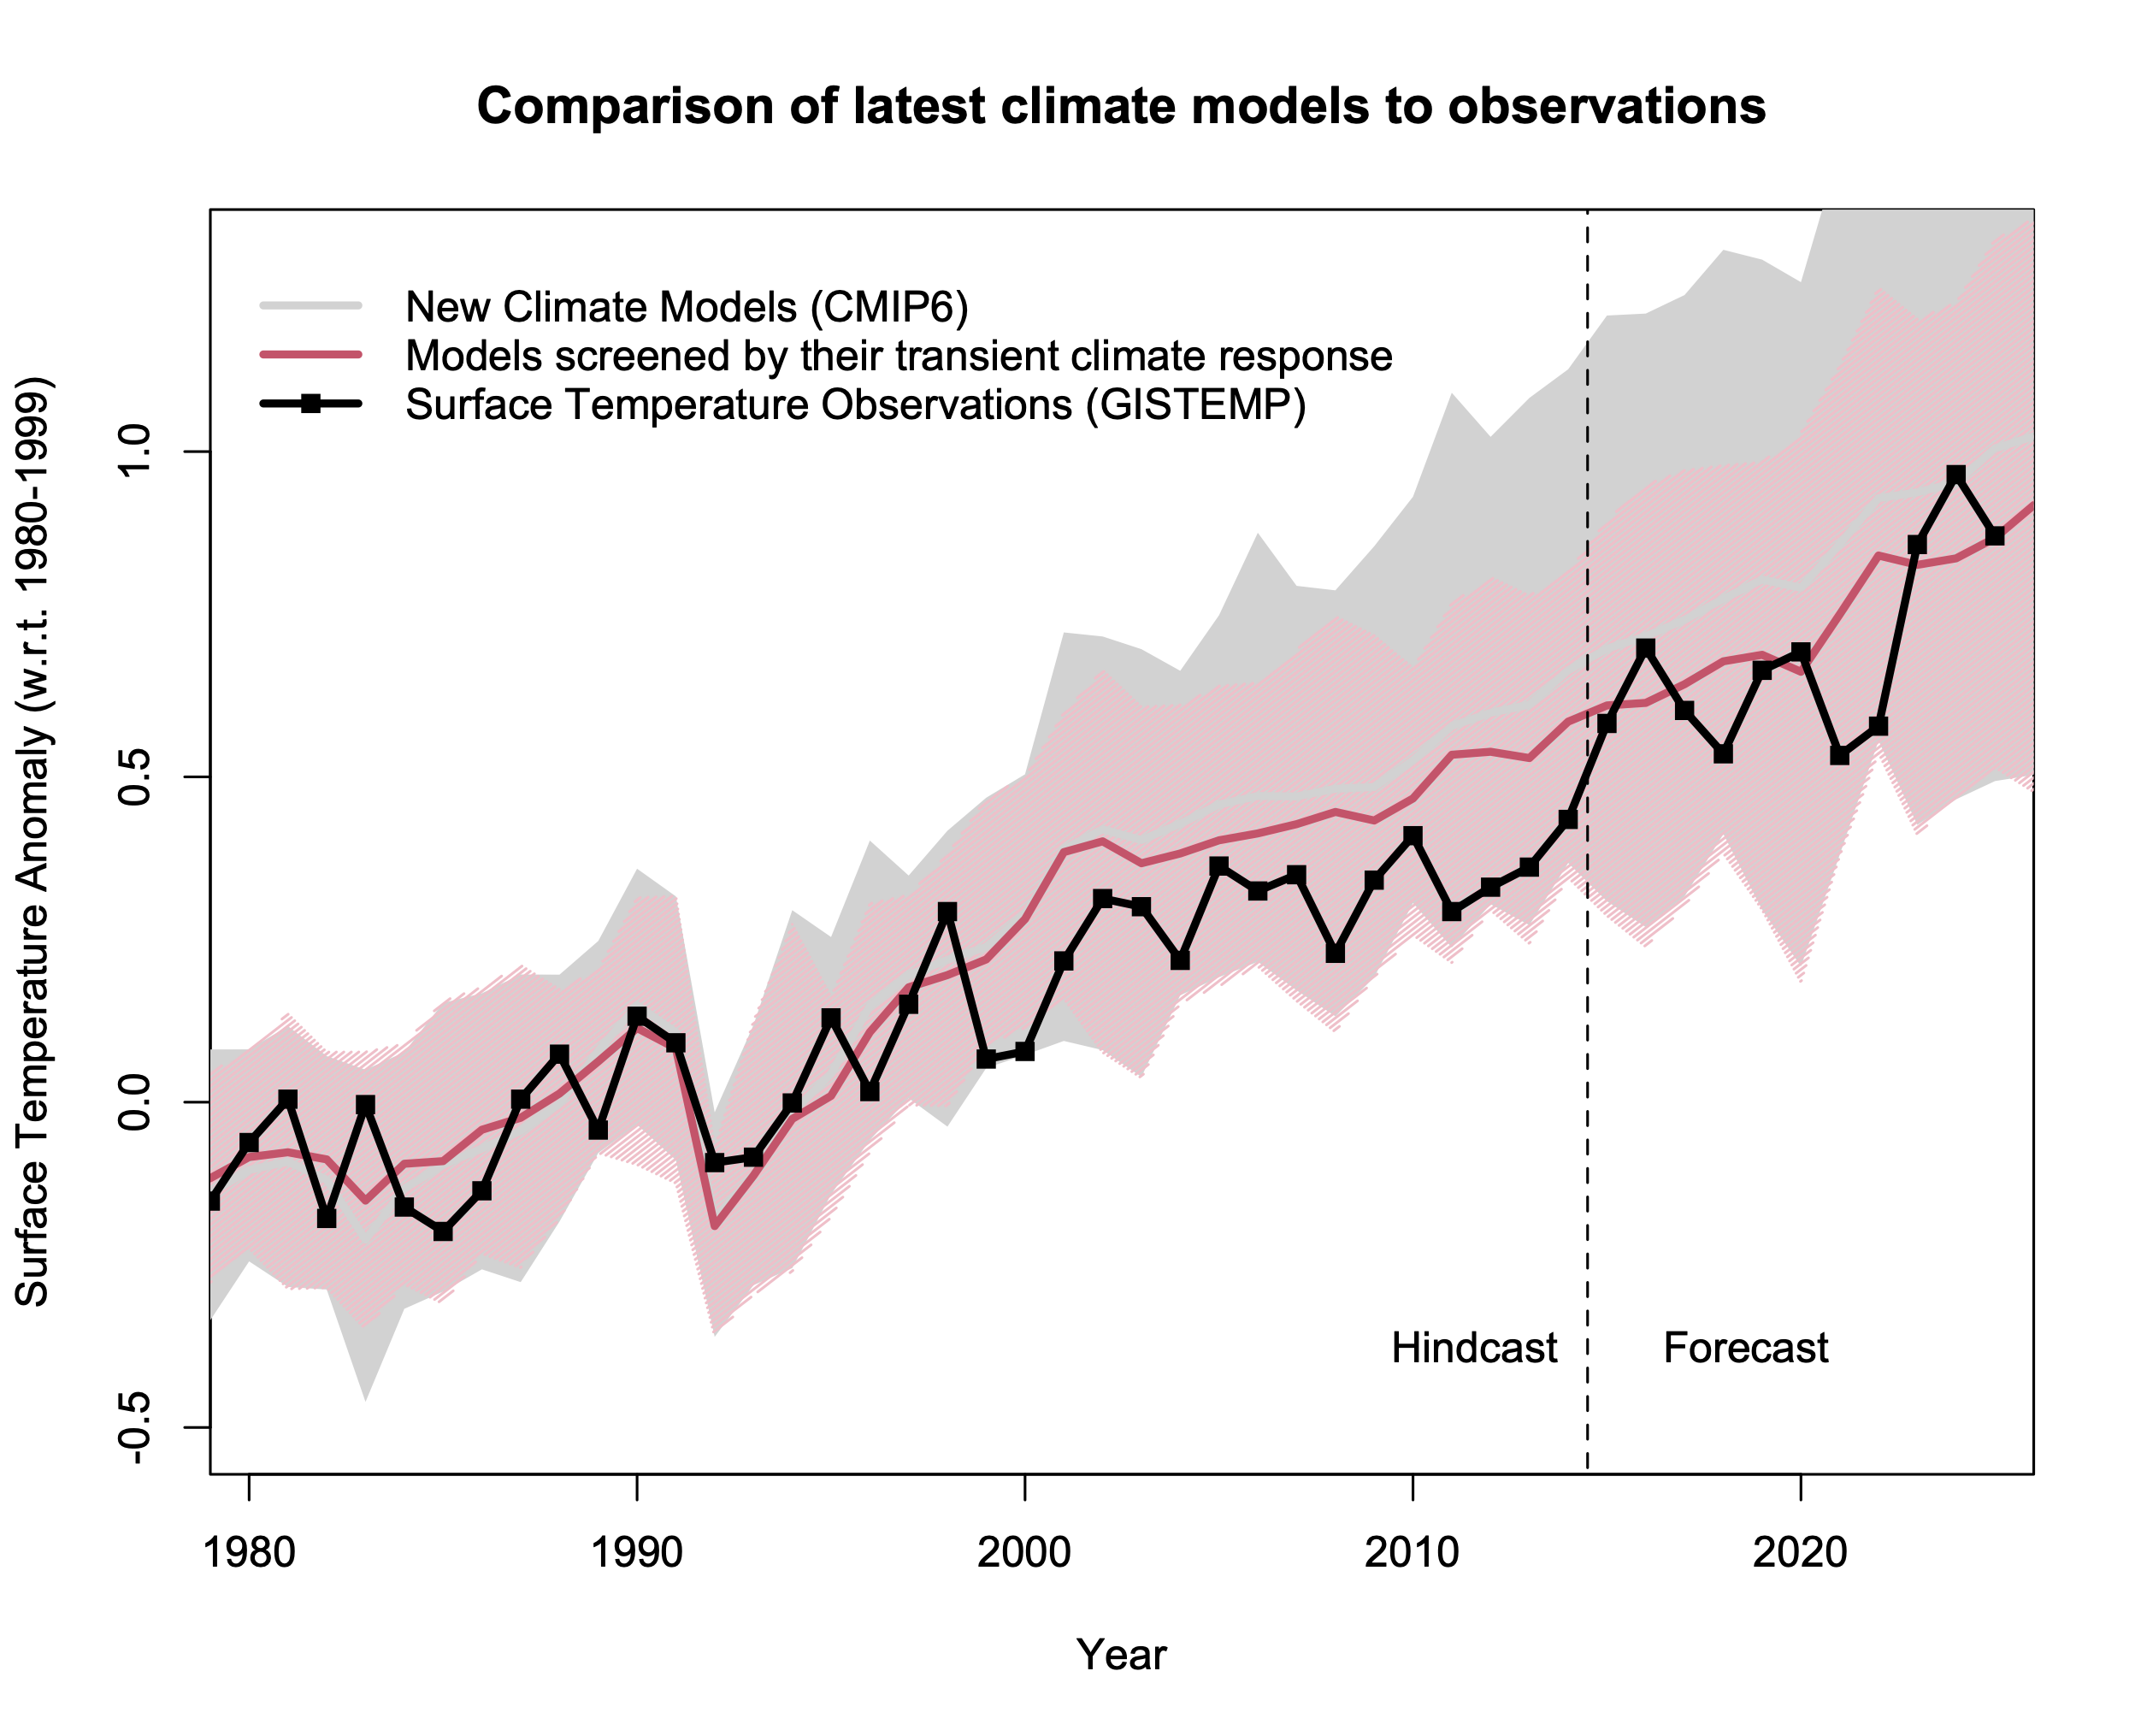
While we can’t know the true internal variability perfectly, we have climate models which provide an estimate of this variability. The figure below shows that the CMIP6 models (screened for a likely Transient Climate Response (TCE)) have a spread that fully contains the observed climate signal. Notably, the ensemble mean of these models demonstrates a slightly greater than linear warming (minus the effects 1991 eruption of Mount Pinatubo).
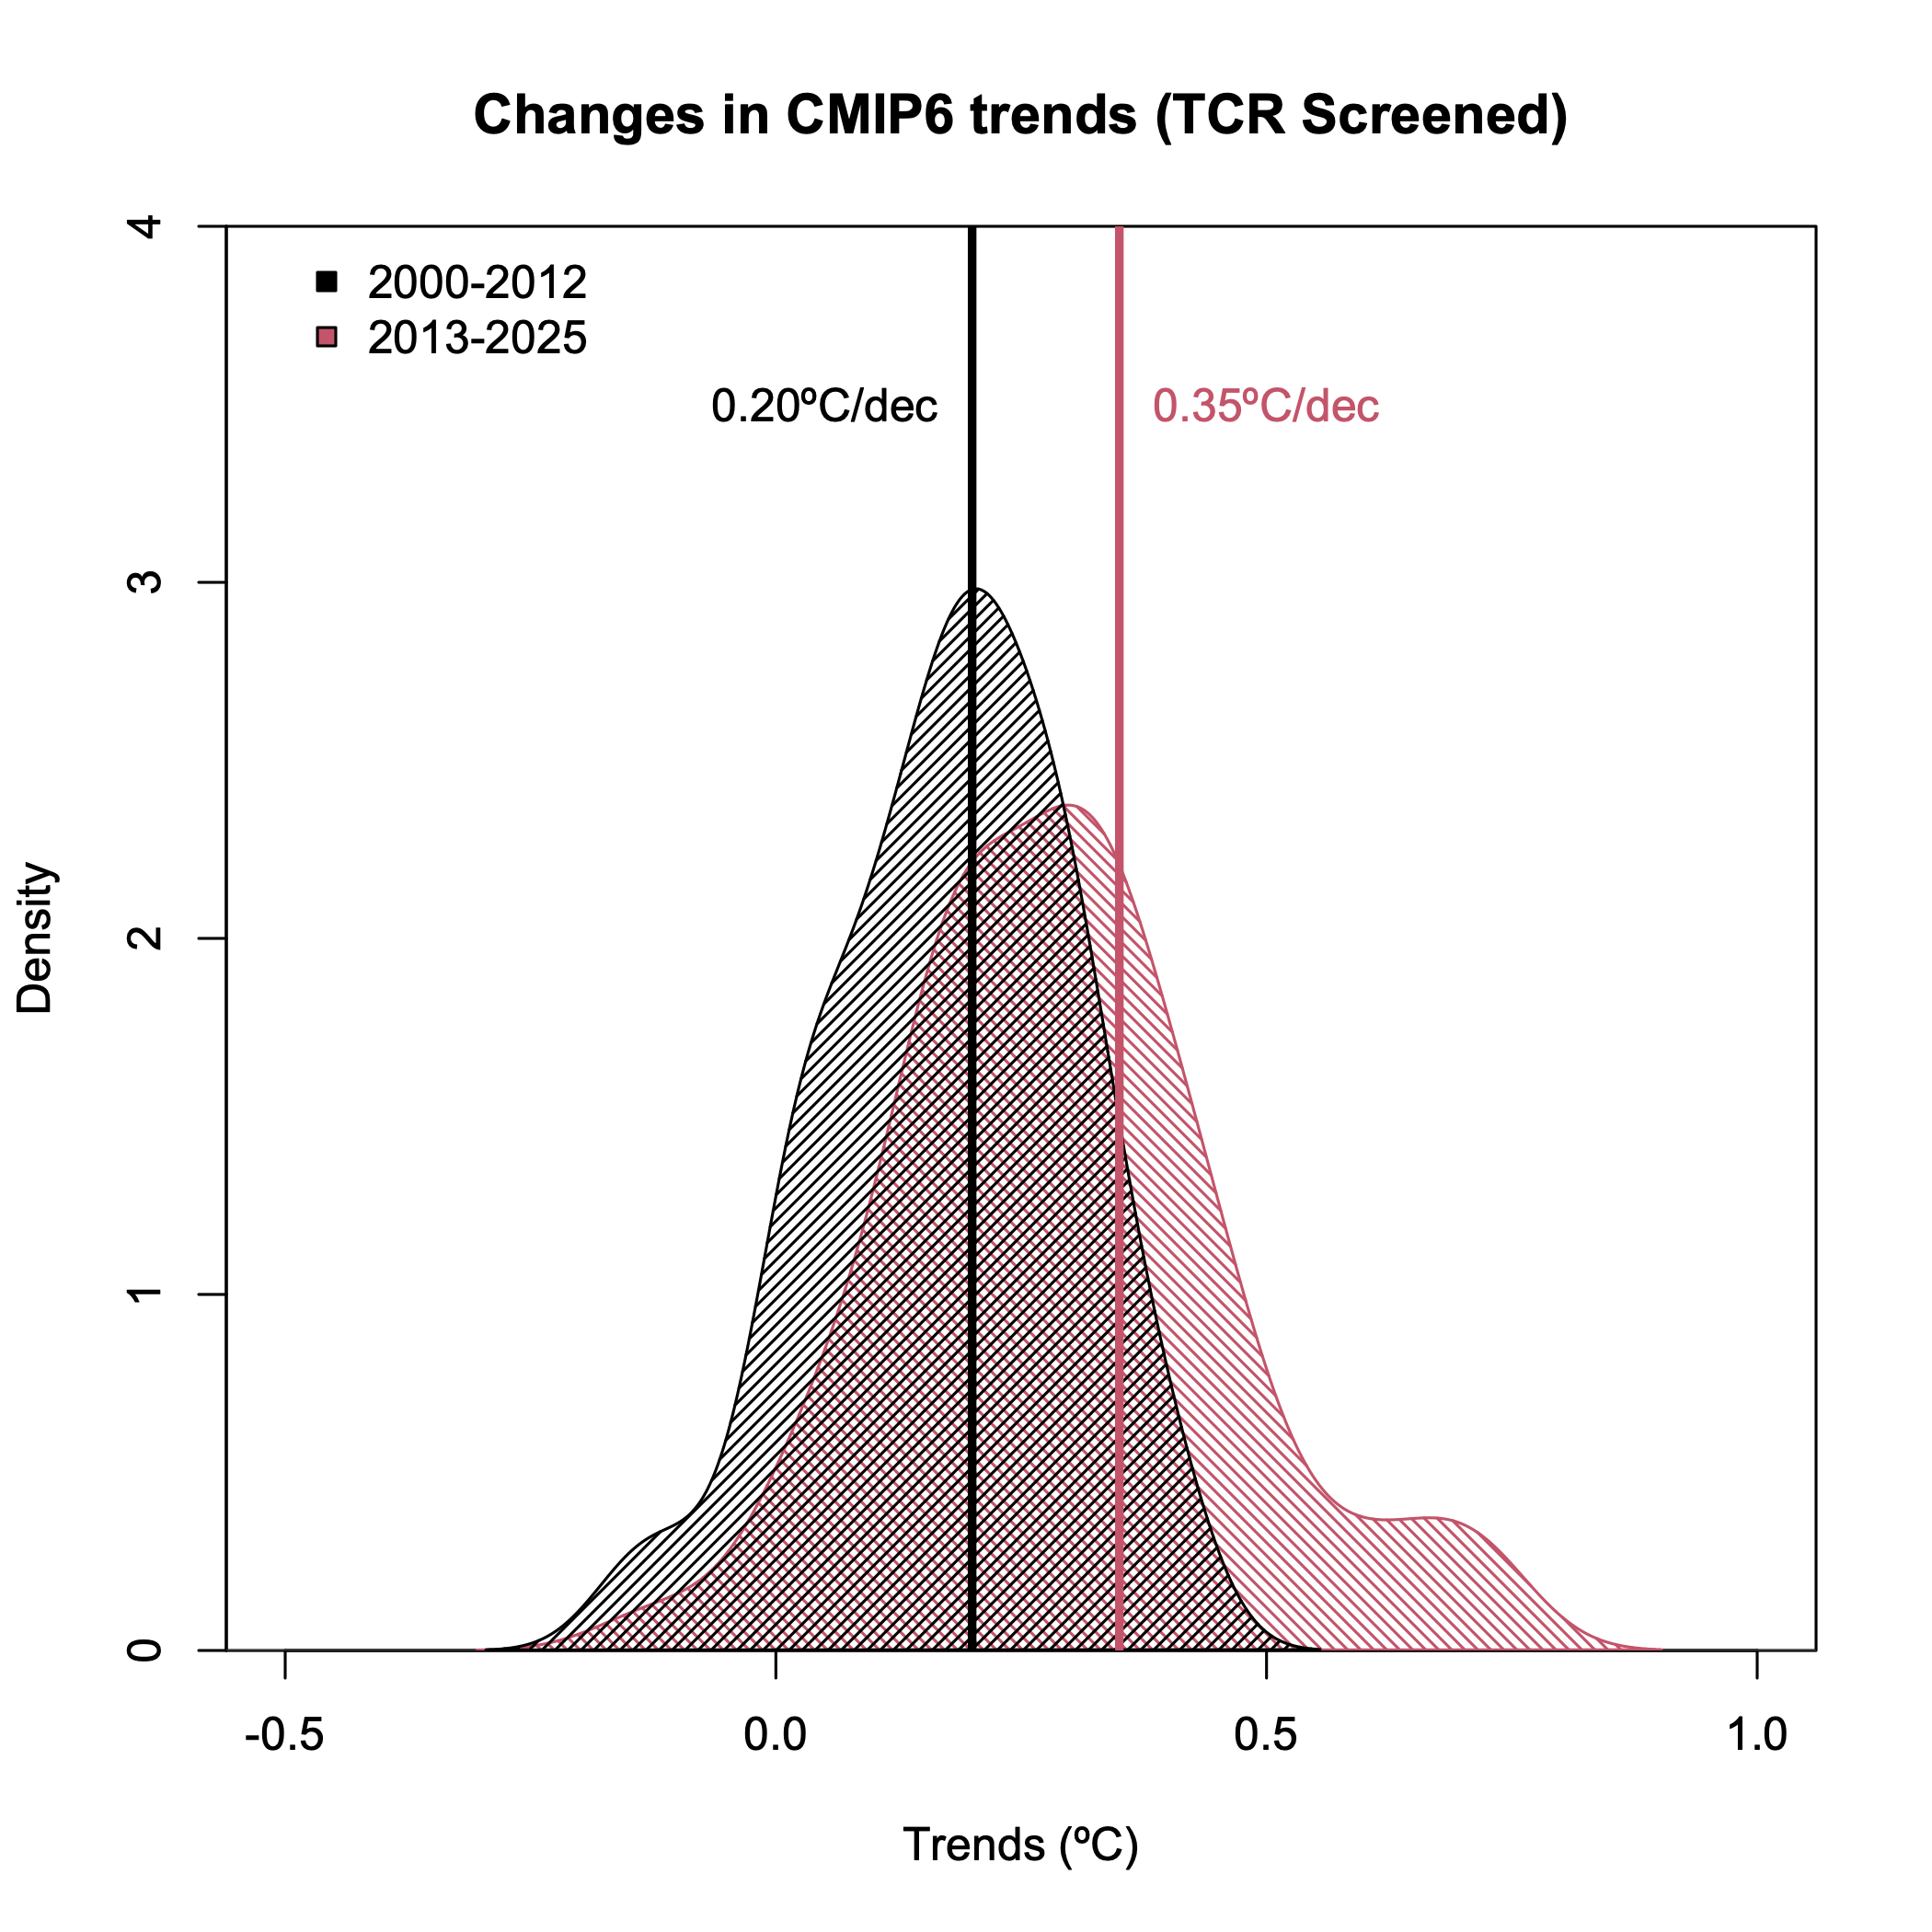
We can look at this more closely. If we look at the trends in individual model simulations for the last 13 years (2013-2025) and the 13 years before that (2000-2012), on average, the models show a slight acceleration over the same period highlighted by FR26 (0.18ºC to 0.30ºC). However, while there is a difference in the mean of these distributions, they are not clearly separate. This shows that, at least in model land, the acceleration in trend (given the internal variability and model uncertainty) is going to be difficult to detect. Note that comparisons between the models and the real world are complicated by any divergences in the forcings in the scenarios (designed more than 15 years ago) and what actually happened (Hunga Tonga, the IMO regulations, Chinese aerosol decreases etc.).
So where does this leave us? There is no detectable acceleration in the raw observed GMT, but there is an acceleration in GMT when removing the linear effects of ENSO, volcanoes, and solar variability, and there is slight acceleration in GMT when estimated using a multi-model ensemble of climate models. John Kennedy recently discussed some of these results in the context of FR26, expanding to a wider discussion of estimates of warming rate. He hits the nail on the head by pointing out two key open questions: “If there is an acceleration, what is physically driving it?” and “What will happen to the warming rate in the future?” The question about mechanism is key to trustworthy predictions of the future rate, and this is not addressed in the new paper.
The prediction of 1.5ºC warming by ~2030 made in FR26 is made in this context by estimating the rate of warming in this adjusted GMT. While made in the imperfect context discussed here, this estimate is reasonable when compared to a more comprehensive attempt to estimate this date . However, as John states, we already know the planet was warming, we have some evidence for acceleration, but we need a better path forward to predict how GMT and subsequent regional climate will change under continued CO2 emission
References
- G. Foster, and S. Rahmstorf, "Global Warming Has Accelerated Significantly", Geophysical Research Letters, vol. 53, 2026. http://dx.doi.org/10.1029/2025GL118804
- G. Foster, and S. Rahmstorf, "Global temperature evolution 1979–2010", Environmental Research Letters, vol. 6, pp. 044022, 2011. http://dx.doi.org/10.1088/1748-9326/6/4/044022
- C. Beaulieu, C. Gallagher, R. Killick, R. Lund, and X. Shi, "A recent surge in global warming is not detectable yet", Communications Earth & Environment, vol. 5, 2024. http://dx.doi.org/10.1038/s43247-024-01711-1
Foster, aka Tamino, has a post about thier work here, the closing paragraph is included below
https://tamino.wordpress.com/2026/03/07/global-warming-has-accelerated/
>”Which estimate is best? I don’t know, but I do know that even 0.24 °C per decade will take us past 2 °C right around the year 2050. The whole point of the Paris agreement is: DON’T GO THERE. My advice: fasten your seat belt, things are going to get ugly”
Dr. Michael Mann objects to how the paper removes the impact of changes in total solar irradiance, ENSO, and volcanic emissions.
Even if his objection fails, the paper’s title “https://doi.org/10.1029/2025GL118804Global Warming Has Accelerated Significantly” is misleading since the paper does not show significant acceleration of the global temperature trend. It instead shows significant acceleration only after removing the impact of the 3 factors noted above. This was noted about the paper’s pre-print as well, but it wasn’t addressed in the peer-reviewed paper.
So the paper doesn’t rebut Dr. Mann’s claim that there is not yet significant acceleration of the global temperature trend. He made that claim in response to Dr. James Hansen’s claim of acceleration.
Uncertainty is not your friend argument twisted the other way around. It’s not significant coz your methodology is now dubious whereas skeptics are wrong by questioning uncertainty coz it’s just as likely to be worse and not better.
I can actually see the arguments about starting points ( cherry picking) and how do you objectively remove natural events to leave only accurate background temps etc. as the others would know all this they wrote it anyway twice but it’s obviously as it stands not convincing enough climate scientists
https://youtu.be/DzXyi6purZY
Table 1 of the paper and of the paper’s pre-print includes a trend of ~0.4°C/decade. This is not the global temperature trend, but instead the trend after removal of the impact of changes in total solar irradiance, ENSO, and volcanic emissions. Yet people like Leon Simons used that trend to make projections, such as projecting 2°C of global warming above pre-industrial levels (1850-1900) by 2037/2038. That was followed by 3°C by 2060 and 4°C by 2084.
But even the paper’s lead author thought that projected rate was likely too much. The lead author instead opted for ~0.33°C/decade:
The paper’s adjusted trend of ~0.4°C/decade thus shouldn’t be taken as representative for temperature trends. It will likely exceed future trends, especially if there is a cooling effect from reductions in total solar irradiance or from multiple La Niña events in ENSO:
In a previous comment I instead suggested a projection of ~0.28°C/decade. Extrapolating that would imply 2°C by 2045-2050, 3°C by 2075-2090, and 4°C by 2105-2130. So about a decade slower than Leon Simons’ projection for reaching 2°C, two decades slower for 3°C, and three decades slower for 4°C. That seems consistent with the broader literature:
I thought the whole thing was based around shipping emissions cutting sulphur from the fuel and this means less radiation being reflected back to space and less cloud being formed as one aspect of the increased warming.
Increased methane emissions too means more short term warming
PB, regarding the acceleration in the underlying anthropogenic warming trend noted by F&R that seems to get going around 2010. I’m just a lay person, but one theory I’ve read is that the acceleration is caused mostly or even completely by a reduction in aerosols, caused in turn by a combination of reductions in land based industrial aerosols in China that started around 2010 , and the reduction in shipping aerosols you mentioned starting around 2002. We have cause and effect and what appears to be quite a reasonable correlation. However despite all this, there still seems a lot of uncertainty about the cause, which mystifies me. It would be great if the experts or anyone could explain why there’s still so much uncertainty despite the fact that the aerosol theory seems to fit.
Correction. Caused by the reduction in shipping aerosols you mentioned starting around 2020.
https://www.nature.com/articles/d41586-026-00745-z
Do you finally acknowledge what was explained to you before:
that Foster and Rahmstorf showed there was not statistically significant acceleration of the global warming trend, but instead that there was statistically significant acceleration of the global temperature trend only after removing the impact of changes in total solar irradiance, ENSO, and volcanic emissions?
https://www.realclimate.org/index.php/archives/2025/12/1-5oc-and-all-that/#comment-843542
of course – you remove those events which are naturally occuring and leave the bedrock which is what is warming. The bedrock is permanent warming and everything else is temporary.
Good idea to remove them otherwise warming is measured at certain times is even faster.
You disagreed several times when it was explained to you before. Interesting that you now agree.
Your additional comments also seem incorrect, and illustrate why the paper’s title is misleading. ‘Global warming’ is about the global temperature trend. That trend includes both anthropogenic and non-anthropogenic contributions. The temperature contribution from decreasing total solar irradiance, for example, is just as real as the temperature contribution from increasing greenhouse gases, even though those contributions are not of the same magnitude. To say otherwise conflates ‘anthropogenic global warming’ with ‘global warming’.
The paper has not shown global warming significantly accelerated, contrary to the paper’s misleading title. The paper instead showed that an approximation of anthropogenic global warming significantly accelerated, depending on how well one thinks anthropogenic warming is approximated by the paper’s removal of the impact of total solar irradiance, volcanic emissions, and ENSO. These points were made back when the paper’s pre-print first came out:
https://pubpeer.com/publications/973ABFB81F504E8CB1B50E941CF3F7
Your comments on permanence don’t seem to work either. Yes, volcanic emissions are often random. But there can be long-term secular trends in total solar irradiance. We’ve already had a multidecadal decrease in solar irradiance since the 1970s, offsetting some of the greenhouse-gas-induced warming. And there’s nothing in principle stopping there from being a preponderance of El Niño events over La Niña events, leading to a trend in ENSO.
I think you will find that both papers -25 and 26 ones has tried the answer the question of is CC accelerating and if so why?
Warming and cooling factors – warning factors – more methane so short term warming is higher perhaps. Cooling factors – shipping emissions lessened and perhaps it impacts low level cloud formation too so perhaps some warming here.
As for volcanoes – eventually it washes out. Solar – small factor again with sunspots and activity levels.
Remove as much as you can and look at the emissions. After all co2 is on time levels way beyond these natural contributions.
Warning from GHG is real but muted by pollution so remove some of the pollution and you get more warming. The forcing contribution factors seem to be the issue here. How much more warming if any .
Neither paper found statistically significant acceleration of global warming, i.e. of the global temperature trend. So one does not need to explain why there is significant acceleration, anymore more than one needs to explain why there are unicorns:
This was explained to you several times, but you kept restating your false claims to the contrary. That included you saying I was “downplaying” when I told you the research showed no statistically significant acceleration:
As I noted back then, you misused “the concept of ‘statistically significant acceleration’ to voice your concerns about global warming” instead of appropriately using it as a tool “to give an answer that applies regardless of one’s biased, subjective preferences about the data“. I hope you now having to admit there’s not significant acceleration influences how you evaluate evidence in the future, and how you respond to those who address your misinformation.
I wonder why the radiative power imbalance detected by CERES is not mentioned. It fits well to FR26. Are CERES findings considered as too uncertain – yes or no? If yes, this should be explicitly stated. Then, the lower albedo values from CERES are being caused by less low level clouds and partly by less direct sulfur reflection, afaik. So to say “We don’t know the reason.” and leaving the question open as if there hasn’t been important research already is a bit strange.
I think you mean this paper: https://www.giss.nasa.gov/pubs/abs/ts01400p.html
It finds a decreased sunlight reflection of 0.37 W/m2 per decade.
The increase of the sunlight absorbed by the earth of 0.45 W/m2 is per decade. The study shows that the majority of warming is caused by increasing direct solar radiation, which in turn is caused by a decreasing cloud cover. If this study is correct, the remaining value for global warming due to greenhouse gases would be only 0.45 W/m² – 0.37 W/m² = 0.08 W/m².
Have I interpreted this correctly?
No. You do not. Read
https://www.realclimate.org/index.php/archives/2022/09/a-ceres-of-fortunate-events/
Hm. The lions part of global warming does still come from GHG concentration increase, which itself is still increasing, btw. (Hope this increase-increase will at least stop soon.) Only the increase of warming rate – above the linear trend of the past 40 years before 2015 – is due to aerosols / cloud cover changes.
There is a new paper to aerosols, clouds an direct solar radiation showing a significant warming directly by the sun:
https://phys.org/news/2026-02-reduction-aerosols-cloud-solar-europe.html
The IPCC sees no warming by the sun in chap. 7 and there in Figure 7.6.
You are misinterpreting both what is claimed by the IPCC and vy the paper. Changes in aerosols do not represent changes in insolation.
It is certainly true that changes in aerosols are important. That does not in any negate or diminish the fact that greenhouse gasses are responsible for the overwhelming preponderance of warming in the current epoch.
Wolfgang, there is no contradiction between the study you quote in phys.org and the IPCC Figure 7.6. The study you quote finds an increased solar warming effect, but only because of a decrease in aerosols and cloudiness. The study doesn’t say sun has changed its output of solar energy. The Figure 7.6 also shows that a reduction in aerosols has occurred, and that solar energy output hasn’t had a net change over the quoted time period
Wolfgang,
In your original appearance up-thread, you ask “Do you interpret the paper you link-to correctly?”
And the answer is “No!!!”
Your second appearance here more evidently appears to be bashing the inane “It’s the sun wot dun it!!” drum with a link to an op-ed on Segado-Moreno et al (2026) ‘Past, current and future solar radiation trends in Europe: Multi-source assessment of the role of clouds and aerosols’. With this second appearance, do note the solar flux is not responsible for AGW as it has remained unchanged. The impact of cloud effects on climate are two-fold with greenhouse-gas-driven AGW causing a warming cloud feedback and pollution a cooling cloud feedback, the latter now decreasing in magnitude.
In your original appearance up-thread, you linked-to Tselioudis et al (2025) ‘Contraction of the World’s Storm-Cloud Zones the Primary Contributor to the 21st Century Increase in the Earth’s Sunlight Absorption’, which finds the Δ Short Wave Cloud Radiative Effect (ΔSWCRE) = +0.45Wm^-2/decade (2001-24).
(Note in the paper the cited Loeb et al (2024) ‘Observational Assessment of Changes in Earth’s Energy
Imbalance Since 2000’ finds ΔSWCRE(2000-19) = +0.37Wm^-2/dec which could be a bit confusing as+0.37Wm^-2/dec appears below. And to add to the confusion, the Loeb et al value for the Earth Energy Imbalance is given as +4.5Wm^-2/decade.)
Tselioudis et al (2025) look at shifting cloud zones and attribute +0.37Wm^-2/dec of the global ΔSWCRE (global = +0.45Wm^-2/decade) leaving +0.08Wm^-2/dec to other short-wave cloud effects.
So this +0.08 number is nothing to do with GHG forcing. It would be fantastic if these CERES numbers could provide values for GHG forcing but the OLR numbers (see the Loeb et al paper) also encompass the forcing feedbacks as well as the temperature feedback from AGW. Using GHG concentrations, the NOAA AGGI shows GHG forcing running at (([2024=]+3.539 minus [2000=]+2.619)/2.4dec =) +0.38Wm^-2/decade.
This GHG forcing number hasn’t changed much for half a century. What has changed is the additional forcing from the likes of aerosol pollution which is very poorly quantified but we can say it was initially increasing and as the pollution diminished it is now decreasing.
(Note these studies of changing cloud do not address the massive variability which prevented any statistical significance for the change being found by Chefper et al (2025).
Tselioudis et al’s attribution of SWCRE (almost entirely to shifting cloud regimes) is not finding a new effect but rather quantifying the impact of such effects on SWCRE. The equatorial band is shrinking as expected and the NH & SH storm bands are drifting poleward which is also shown in models. (I note there is signs of the equatorial band, the ITCZ, drifting northward 30km/dec(land) & 15km/dec(ocean) which is apparently not something shown in models – Aumann et al (2024)‘Northward Shift and Narrowing of the ITCZ in 20 Years of AIRS Data’)
Tselioudis et al (2025) attribution of SWCRE is likely controversial. The more usual major reason given for reduced albedo is not shifting clouds but rather the cloud-effect from reductions in aerosol pollution etc (general or more-recently marine), this being the one cause mentioned by Foster & Rahmstorf
(2025) who say:-
Note that Quaas et al (2022) ‘Robust evidence for reversal of the trend in aerosol effective climate forcing’ find the forcing due to reduced pollution thro’ 2000-19 = +0.2Wm^-2(+/-0.1) or +0.1Wm^-2/dec, although note that the much-discussed increase in marine pollution was post-2019.
Wolfgang. No you have interpreted this entirely correctly because (ascribing no malice to Wolfgang) you do not know or understand that Earth prevents being continuously heated until it’s the hottest object in Universe by emitting LWIR to space, not by emitting SWR to space. You are ignoring the combination of (1) The Planck response and (2) The fact that albedo reflected-SWR +ve feedbacks are somewhere approximately (poor cloud certainty) in the range of 2/3rds of the GHG Forcing and H2O gas feedback in the LWIR. This means that it wouldn’t take much for the SWR +ve feedbacks to warming to meet or exceed what is causing them. Your suggestion that clouds could reflect significantly more or less Solar SWR on a multi-decadal or longer basis because “clouds Just Do That” is risible for the reasons I just provided.
My “No you have interpreted this entirely correctly” S.B. “No, you have interpreted this entirely incorrectly”.
I read the comments below and I’m not “satisfied”. This new research article
https://scienceofclimatechange.org/wp-content/uploads/SCC-Vol.6.1-02_Ato.pdf
seems to adress a similiar issue as mine.
So, you find the self-published rantings of a crank who doesn’t even know how to write a scientific paper more convincing that the consensus of all the experts.
Got it. Have a nice life.
Wolfgang,
I’m not sure what ‘satisfaction’ you seek here but would point to the pay-to-publish article you link-to and suggest its “independent-researcher freelance” author is entirely out of his depth.
The idea of his article titled ‘Multivariate Analysis, Phase Verification, and the Rejection of Man-made Positive Feedback Global Warming Theory’ is that the wobbles in climate forcing due to (1) surface water vapour, (2) TSI/absorbed solar & (3) CO2 will leave a signal in the wobbles of the global sea surface temperature. And all this using a couple of decades of data.
Such an idea is eye-bulgingly stupid.
Some of the more obvious examples of why this is all utter nonsense.
(a) Surface humidity is not where the water vapour forcing acts..
(b) What is called UAH-G-SST is UAH TLT Ocean.
(c) An applied climate forcing acts on the climate for a century or more. Thus any inter-annual wobbles in their application will be entirely fuzzed-out in action at the inter-annual scale.
(d) If this “independent-researcher” sees global SST as “the dependent variable” in this analysis, by what physical mechanism does he think the water vapour enters the atmosphere if not global SST, this being the big surface layer of liquid water on the planet?
“less low level clouds” s.b. “fewer low level clouds”. “clouds” is digital, It is “cloud’ that’s analog (and how, ask any simulation Modeler about “Objects” or ask any worn-out, exhausted supercomputer). Each bod is permitted 1 irrelevant comment per day per Realclimate Rules.
Hi Nathan,
In your Fig. 3, the skews for the earlier and later periods differ substantially–with the 2000-2012 skew being leftward and that from 2013-2024 being more pronounced and rightward. Can you estimate how much of the difference derives from the different skewing, and if you remove this, is the change still significant?
A minor correction. We didn’t actually predict that we’ll cross 1.5°C by 2030, we stated that IF we continue at the same pace as the last decade THEN we’ll cross 1.5°C by 2030. Whether or not we do so, depends crucially on why the last decade warmed so fast (we make no attempt to identify that) and whether or not we can cut CO2 emissions “significantly” in the next few years (I’m skeptical).
The press has emphasized “cross 1.5°C by 2030,” but I think what they should emphasize is faster warming, and that almost everybody expected faster warming, even before we published our paper. Some say it’s only 0.24°C per decade, some say 0.27, others estimate 0.30, but nobody I know still believes in the “slightly below 0.2°C per decade” that it was for nearly 40 years. More worrisome is the fact that even at low estimates (like 0.24°C) we’ll cross 2°C right around the year 2050.
Grant Foster (a.k.a. Tamino)
Thank you for including the assumptions and caveats relevant to this study. Those caveats and assumptions will be used against this report by your political opponents. However, it was the right thing to do. Congratulations and thank you for the hard work involved in this.
Thomas Fuller says: “As I’m 66, I don’t know how long I would be able to sustain it, but I would be willing to wager that GAT doesn’t rise to .2C in any decade in my lifetime.”
“[Response: You don’t need to wait! GISTEMP trend from 2001 to 2020 is 0.23ºC/dec. Difference btw 2011-2020 and 2001-2010 is 0.21ºC, difference btw, 1991-2000 and the following decade is 0.24ºC etc. etc. In HadCRUT5 the last 20 year trend is exactly 0.2ºC/dec. I could go on, but you’d do well to the math before you wagered any actual money. – gavin]”
While some scientists are discussing the statistical details and finesses of this, the political juggernaut of fossil fuel addicted and sectarian-calvinist-zionist doomsday-christian/satanistic belief/dogma-driven US oligarchy has left the harbour and in it’s own kind of hitlerian runaway hubris started the third world war (the second fascist initiated, if one really can detect any significant and stable downturn in the relentless and totalitarian continuous warring since august 1945, which is at least highly debatable. It’s also plausible, as the world affairs have developed since 1914, that what we are seeing in fact is the same thing going on with the global population of homo sapiens, as with other local/regional animal populations when they cross the carrying capacity of their ecosystem niche and collapse. In fact many things point towards the conclusion that what we call capitalism is simply the collapse of mankind, mainly because it fell into a fatal ecological trap by expanding it’s consumption beyond sustainable limits by becoming addicted to “burning buried sunshine” (J. S. Dukes 2003) and other overuses of resources and thereby manipulating the global ecosystem over the edge to a degenerative collapse causing the sixth global extinction catastrophe for life on earth).
One result of this is for certain, that the Trump mafia regime has begun the systematical liquidation of science in favour of totalitarian, pseudoscientific myth-making, fascist style like the one known under Hitler as “german physics” (denial of Einstein’s theory of relativity by racist/anti-semitic “arguments” etc.) and under Stalin as lysenkoism (Stalin “confirmed” Trofim Lysenko’s denial of the darwinian theory by stalinist dogma, coupled to dogmatic conflicts in the ruling party around the development of agricultural production). This trend towards civilizational and cultural collapse was long in the making in the US, especially since Reagan came to power via the Iran-Contras trick/coup in kahoots with the Khomeiny regime 1979. No other country in the world today (maybe to a degree except some islamist countries?) fx. harbours a lot of anti-darwinian (and thus anti-geologic!) pseudo-scientific museums of biblical-dogmatic “natural history”. Of course this represents a long running and widespread anti-scientific and totalitarian tendency in the US. And if you don’t recognize scientific geological history/paleontology, it’s no wonder that you also don’t accept climate history and science. With Trump and pseudo-scientific nonsense as it is spread by the oligarchs Peter Thiel and Elon Musk in power, this has by now reached a highly critical stage.
The wise answer to this from the mainstream US science community, cannot be what the exiled historian Timothy Snyder precisely calls “to obey in advance”. But that is unfortunately exactly what the remaining feeble and opportunist Washington ruling leadership of the Democratic party around Kamala Harris and the Clintons, Hakim Jeffries etc. is doing: in fact they do obey Trump in advance, as does also the mainstream european NATO leadership. These “liberals” again and again believe that they can “talk it over” with Trump, even as the evidence for this being pure illusionism is by now long ago mounting sky-high. The result of this chamberlainian “strategy” is that the remaining pockets of democratic and scientific resistance to totalitarian oligarchy are being dismantled, faster and faster.
To conclude: I can’t avoid noticing, that the discussions going on here on Realclimate are being more and more narrowly focused on what to me seem like a kind of statistical escapism into petitesses from the bitter reality of the oligarchic-totalitarian crushing offensive which is by now succeding in rapidly destroying any vague remaining elements (there aren’t many) of climate policies around the world. To me this is just fiddling while Rome burns to the ground. It’s a blind alley for the attempts to stop the fossil fuel industry from destroying our common future. It’s simply irrelevant to the future of mankind, because *we will never be able to say exactly when the world crossed the fatal climatic (and ecosystemic!) tipping points to catastrophic collapse, before it’s far too late.
The attempt to avoid passing these tipping points by defining some “degree goals” has been a total political failure. It hasn’t achieved anything but Trump etc., because it’s far too abstract for most citizens to grasp. *Among the climate aware public it has mainly functioned as a distraction from the important issue: that we need to cut the use of fossil fuels as fast as possible*, and that *far more important than any degree measure of the pace of global heating is what the effects of a given amount of heating in fact are for nature and society: in wildfires, droughts, flooding, landslides, hurricanes, agricultural losses, epidemics etc.* That failed policy has alienated the main public from the important societal issues concerning global heating and energy use.
This statistical discussion has been and is now more than ever simply clouding that fatal political fact. namely that focussing on these degree goals creates the illusion that “there is still time to act”, as every UN leader has now been mechanically repeating for over forty years, of course without achieving anything but delivering eternal excuses for the politicians to continue with business as extremely usual, pleading that “at least we are doing something, and more than others” – which has always been a lie, a greenwashing of the in fact just stupid and denialist, opportunistic reality of mainstream – even socalled “green” – politics. Now we have just oligarchic-imperialist war, renewed armaments race just creating even more and deeper fossil fuel dependency, even more and faster environmental degradation etc. – which is of course exactly the central goal of the Trump, Putin, mideastern etc. fascist/totalitarian oligarchies, because they thrive on this deadly societal downward spiral into the abyss.
Time to wake up now. https://www.pnas.org/doi/10.1073/pnas.1810141115 . https://www.theguardian.com/environment/2026/feb/16/europe-climate-advisory-board-3c-global-heating – as if that was possible without societal collapse… but they simply don’t care – adapting to any heating was always the just slightly hidden goal behind fossil capitalist policy, because for the owners it’t only their profits that count. That we do know since Hitler and the activities in Auschwitz of IG Farben etc., since the Vietnam war, since the Gulf wars and other oil wars, the wars of Putin (now new ones!), the chinese attempts to conquer oil reserves in the South China Sea, the Taiwan Strait, the oil wars in Sudan, Nigeria etc. etc.
The common men have no choice. Their only chance is to fight oligarchy and fascism. In this existential fight for the survival of mankind, scientists have to choose which side they are on. If they don’t, merciless historical forces will do it for them anyway. As Timothy Snyder puts it: “Never obey in advance” is your only choice if you support freedom and not slavery.
https://agupubs.onlinelibrary.wiley.com/doi/full/10.1029/2021RG000757
https://m.youtube.com/watch?v=-zvAIuYOzU8
https://m.youtube.com/watch?v=tVFSJINGueM
https://m.youtube.com/watch?v=e2paRMQ1k6k
Time for who to wake up exactly – the political class who pander to voters who dont appear to be interested much.
You make some good points (in a looong screed). Really if the constitution of the US was working the way it was meant to the US wound have overthrown this ******* stupid dictator a long time ago. Instead it seems the “Right” foresaw that and figured sections of the lower class had to be softened up and dumbed down over the decades first. So now if the US tried to get rid of this Russia loving creep they risk civil war. Madman Putin is running the world.
Whoever among the gnostic foresaw this? Is there a, as you imply because we overshot our natural carrying capacity, a self-destructive species-limiting gene involved? Hmm…
So what’s the solution as far as the democratic world is concerned? They are trying the “wait him out” (hopeful) solution, praying that he won’t do too much damage before his time runs out. If they were asleep before I doubt they are now. Putin and T knowing this and knowing this is his last term are pulling out all the stops. Fascism’s last stand.
Don’t give up on the good people of the US. They are still “a light on the hill”.
—-
To be fair, there are a few good things that clownish or just cunning/evil T has done (likely for appearances sake to get more votes). Things that the ultra liberal and ultra compromising left didn’t try because they figured it might tick someone off. An obvious one is removal of artificial colors from foods, something the gutless left should have done a long time ago.
/this off topic discussion
“if the constitution of the US was working the way it was meant to …”
This is not accurate. The undemocratic set up of the Senate and Electoral College were explicitly used to /iprevent/i real democratic governance. The seeds of the industrial/urban/liberal North and the slave based agricultural South Civil War were planted in 1787-9. We Americans are still trying to finish that war and might fall apart in the process.
Attacking the “gutless left” is worse than futile. That your sneering of the “ultra liberal’ etc so plays into the fascists’ narrative.
Toby Thaler, The seeds of the industrial/urban/liberal North and the slave based agricultural South Civil War were planted in 1787-9. We Americans are still trying to finish that war and might fall apart in the process.”
I was thinking that the south just didn’t like how the civil war ended. But I guess you’re right that we can go back further. Slavery has an old pedigree. Actually, we can probably keep tracing it back to the beginning of recorded history for that matter.Actually we can even go back 300,000 years to the beginning of Homo sapiens. ACTUALLY …
“Attacking the “gutless left” is worse than futile. That your sneering of the “ultra liberal’ etc so plays into the fascists’ narrative.”
Okay.
I can’t agree, Karsten. The very same Hakeem Jeffries whom you castigate for “agreeing in advance” is currently (together with Senate leader Chuck Shumer) maintaining a partial shutdown of the government which we now know will reach at least 24 days. It’s forcing the Maladminstration into ever more desperate attempts to pass legislation to rig the midterm elections. Far from “talking it over” with Trump, they are engaged in an existential struggle.
I’m not saying that the Democratic leadership is above or beyond criticism; indeed, there is a widespread desire among Democratic and even independent voters for a more aggressive response to the outrages we are constantly seeing perpetrated. But the essential problem is that their power is limited: the voters most unwisely gave decisive control to the wreckers in 2024, and this is augmented by the disregard for legal, social, customary and moral norms on the part of the White House.
This could change dramatically this fall, if the midterms are run fairly and freely. That is what the struggle now is about: Trump is trying everything to pass the SAVE Act, which would, he hopes, sufficiently suppress the Democratic vote as to allow him to retain a friendly Congress. If he loses the Congress, his ability to do what he has been doing will be significantly impaired–I’m hoping that “hamstrung” will turn out to be an appropriate word.
Let us see if Stefan and Tamino have reached 95% in their latest work and now actuaries and the University of Exeter back it up.
https://actuaries.org.uk/media/isvotyer/parasol-lost.pdf
From this video:
https://youtu.be/e2paRMQ1k6k?si=BpH1y9GHfmRGiaHp
I’m on your side, but after a career spent trying to dissuade my colleagues from forcing data to fit their favorite model, when I look at your fits I am reminded that Paul Simon got it right: “A man sees what he wants to see…”
This is a bit misleading: while this study uses observational data, it modifies these observations through statistical filtering. Therefore, it is not a direct result of the observations, but rather a statistically reconstructed signal. Its robustness depends entirely on the validity of the corrections applied. This is not direct empirical evidence of climate acceleration; it is, once again, a statistical hypothesis obtained after removing MODELED natural phenomena !
Recently, Zeke Hausfather, PhD in climatology and researcher at the Breakthrough Institute, also expressed reservations regarding the study’s conclusions…
Jean-Pierre,
Actually, the process of drawing insight from raw data through the application of models has a name: science. And it is not as if this is the first time the model applied here has been used. It’s strengths and weaknesses are well known. The main weaknesses have to do with the model used for ENSO resulting in larger residuals than for the other forcings. The main strength: simplicity. The model makes clear that without the noise generated by a few salient forcings, the trends become clear and undeniable–undeniable unless you are willing to posit that the dozens of other small forcings are conspiring to generate the trend. I don’t think that even you would be that brazen.
And Hausfather agrees with the basic conclusion of the paper–that warming over the last decade has accelerated. He even agrees–within about 15%–on the magnitude of the acceleration. I doubt Foster and Rahmstorf would quibble with that level of agreement.
The model used here is an excellent tool when one wants to cut through the noise and glimpse the underlying trend–not necessarily the magnitude, but certainly what the data are telling us is important.
Ray,
No one disputes that statistical tools can help interpret data. The issue is not the use of models per se, but the epistemological status of the result.
Once the observational record has been adjusted by subtracting modeled contributions (ENSO, volcanic aerosols, solar variability), the resulting curve is no longer a direct observation but a model-dependent statistical reconstruction. Its robustness therefore depends strongly on the assumptions of the regression model (linearity, independence of forcings, stationarity of coefficients).
As you point out yourself, the ENSO component leaves relatively large residuals. Since ENSO represents the dominant source of interannual variability in global temperature, this limitation is not trivial.
More importantly, the claimed acceleration relies on roughly a decade of data. In climate statistics this is a very short window, and short-term slopes can easily emerge from internal ocean variability.
This does not mean the method is useless; it simply means the result should be interpreted cautiously. At present it is more accurate to describe this as a statistical indication of possible acceleration, rather than direct empirical evidence of a robust change in the warming rate.
Please! You can’t even get a global temperature without a model. And since we are looking at trends, we are inherently in the realm of statistical models. Raw data simply cannot be interpreted without the aid of models. Raw data by itself means nothing.
The model in question has a track record of well over a decade of elucidating important trends in the global temperature data. That it does so by looking at only 3 primary sources of noise provides strong evidence that these sources are dominant in the overall noise. The very reason why global temperature series require long datasets to draw conclusions with high confidence is because of such noise. This paper shows that by removing known sources of noise allows one to reach a much higher level of confidence with a shorter dataset. As we have pissed away 40 years by denying the undeniable, added certainty in shorter time is undeniably a good thing.
Differences between temperature products might serve a good example for the point Jean-Pierre seems to be making.
Choices in the treatment of some MSU channels are one cause of the systematic difference between the various published LT temperature trends.
Likewise, as Jean-Pierre points out the trend removal used here generates model depend data removed from the measurements possibly reflecting the opinions of the authors more than anything. Obviously missing is a thorough discussion of alternative choices.
Yebo Kando: “possibly reflecting the opinions of the authors more than anything.”
Bullshit! You act as if this model were purpose built rather than one having over a decade of successful application. Yes, there are systematic issues, but they are known and they do not affect the conclusions here.
Were I in the denialist camp like you, I would be grateful that the model was successful at placing a limit on the acceleration–as the previous 3 years of data by themselves are sufficient to raise alarm.
This looks like a weak argument covered up with rough language and insults, both should be against forum policies.
Not discussing the effects of different choices during the analysis on the uncertainty does not make this work particularly good or strong, it looks lacking.
And this looks to me as if you are utterly ignoring the substance of my post and choosing to tone troll. I have already pointed out that these issues have been discussed in previous papers by the authors.
All models are wrong. This model is useful, in that it has shown repeatedly that removing just the 3 main causes of noise in the data suffices to reveal the underlying trends. So, unless you can come up with some mechanism whereby such removal manufactures a trend, maybe look at what the data are telling us–namely that there is something very different about the past several years. Moreover, it says we can c0nclude this with high confidence.
Foster and Rahmstorf are careful not to say exactly what is different, and I agree with that strategy. It could be that past aerosols masked some of past warming–in which case, we have less time to respond to the crisis.
It could be that some new source of noise is contributing–in which case we need to understand it.
And it could be that the natural buffers that have kept the brakes on warming for the past 40 years and fraying and we are near a turning point–in which case we may be fucked royally!
In any case, it seems like something we ought to know about.
say Ray:
“It could be that some new source of noise is contributing–in which case we need to understand it.”
There is a source of “noise” when it comes to regional sea-level measurements that is far from understood. This is the erratic inter-annual variations measured at most coastal stations around the world. Some stations — such as along Australia — follow ENSO to a great extent but the vast majority don’t so they fall into an orthogonal category of variational change. And of course, since these are inter-annual, they do obscure the interpretation of any trend. And any change in trend, such as acceleration makes it even more problematic.
Given that, the first thought that one would try to exclude is tidal forcing as a proximal cause. Since they are erratic, this has largely been excluded as a possibility in the past, yet it seems as this dismissal was prematurely cavalier, as all the nonlinear possibilities have never been sufficiently been explored. In fact, fluid dynamics is going through a bit of a renaissance via machine learning and the application of nonlinear neural network modeled layers, particularly as hidden, latent layers or manifolds.
This is my contribution to exploring how tidal forcing can contribute to variational changes and especially acceleration:
https://github.com/pukpr/GEM-LTE
I have some screenshots on that site showing how globally comprehensive the results are. BTW, anyone can run this if they are interested.
Remember that oscillations are a form of acceleration — since acceleration is the first derivative of any change, and a cycle is approximated as roughly a sine wave, then the derivative of a sine wave is a cosine wave. So it’s really hard to ignore when the components of the variation are multidecadal.
Uhm.. again swearwords and personal attacks.. just let them be.
Jean-Pierre already told you that the calculated result is not a noice reduced version of the original data but something else.
As you mentioned temperature, I pointed out that small choices in the data treatment have significant effects on the output.
A detailed mathematical analysis of possible choices during the removal of various trends is missing in Forster and Rahmstorf’s work.
This is also where your language gets weak! The model is a successful one (as was flat earth) and F+R were careful .. which might correctly reflect your opinion, but has no scientific weight. Consider my point unanswered and please be more scientistific in your answers!
Thanks for the useful article, and thanks also to those who posted further information.
I will again remind people that no matter how well intended or accurate your posts are, if they are overlong they undermine your point. We all know what an appalling mess we have with a dishonest bullying lying predator and his exploitative buddies in charge. We all know that knowledge, wisdom, and civilization are under attack.
It is particularly unhelpful if you use a chatbot to expand your otherwise useful information. I know it feels ‘right’, but resisting an increasingly addictive process and posting the extended results here might help. If you are mature and know what you’re doing, it does a good job, but taking all things into consideration it has considerable downsides.
Do the perpendicular (much more than tangental) despicable vulgar screeds by Karsten V. Johansen and Ron R. belong on an information site that’s theoretically devoted to Climate Science? Or any science, or any site devoted to rational discussions of any matters.
RealClimate is rapidly heading toward ‘all ad hominem all the time.’
DH: I recommend that you model “science, or … rational discussions of any matters” rather than escalating “vulgar” “ad hominem attacks.”
And there is all the fossil fuel sulfate aerosols to be accounted for – a cooling effect that is transient, that does not actually reduce the strength of enhanced greenhouse effect in any way, just gives the appearance of ‘countering’ warming so as long as the rates of adding it don’t decline. I’ve seen estimates ranging between 0.2C to above 1C, which means we are very probably beyond the possibility of any peak less than 1.5C right now and possibly already locked in to more than 2C. It is a big uncertainty that nonetheless, by not counting it, persistently make the evolution of global warming look slower and less than it actually is.
Historical temperatures show undeniably that things are getting warmer faster, Temperature growth rates are accelerating. And we know why despite the institutional gatekeepers silence and denials we don’t know why.
2015–2025 Decadal GMST Anomaly ~1.30°C (1.25–1.35°C) (rate ~0.25–0.40°C/dec)
Current ‘2023-2025’ GMST Anomaly ~1.50°C (1.45–1.55°C) (rate ~0.35-0.45°C/dec)
By 2050 Decadal GMST Anomaly ~2.35°C (2.20–2.50°C) (rate ~0.35–0.45°C/dec)
https://www.realclimate.org/index.php/archives/2026/02/unforced-variations-feb-2026/#comment-845058
Re: “Historical temperatures show undeniably that things are getting warmer faster“
The sockpuppet account continues disinforming. Historical temperatures instead show no statistically significant acceleration of the recent global temperature trend. Ranting about supposed “institutional gatekeepers” does nothing to change this, nor is it a competent statistical analysis.
With respect to the ENSO… if one plots the monthly NINO 3.4 index against monthly Mauna Loa CO2 there is no correlation. One can see this by simply looking at a long term plot where the negative La Niña is balanced by the positive El Niño with the neutral condition in between.
I don’t believe anyone expects that there should be a correlation between NINO 3.4 and monthly CO2 measurements at Mauna Loa. FWIW, I certainly wouldn’t.
The point here is that La Ninas lower GMST and El Ninos raise it, thereby obfuscating the longer-term trend. (A fact exploited ad nauseum by denialati, by the way.)
Well, actually yes there is a not-insignificant cross-correlation of 12.7% between the two raw time series, which peaks when CO2 lags NINO3.4 by 6 months
KW: Well, actually yes there is a not-insignificant cross-correlation of 12.7% between the two raw time series, which peaks when CO2 lags NINO3.4 by 6 months
BPL: If r is 0.127, then the proportion of variance accounted for is r^2 = 0.0161, or 1.6%.
Especially if one takes the time-derivative of monthly CO2, which eliminates the trend. Then you will see the ENSO correlation clearly (also of course a seasonal or annual correlation).
Kevin.. if anthropogenic CO2 is affecting the climate (long term weather) there should be a correlation between the ENSO. (all THREE parts) and CO2. You have focused only on two. All three parts are always shown on ENSO charts. And the trend is essentially flat. The positive El Niño peaks balanced by the negative La-Nina with the neutral in between.
Right. ENSO is essentially uncorrelated with long term trends in GHGs. Therefore, an analysis that seeks to eliminate the effect of ENSO on GMT by subtracting it out will not be introducing a bias on the trend in GMT due to greenhouse gas levels.
Less a comment than a set of queries:
FR26 makes the case for a recent (since 2013) acceleration in the rise of GMT. I wonder how valuable or prudent it is to defer (even for public consumption) to the GMT metric, when presumably substantive (if not significant) variability in temperatures can be measured from hemisphere to hemisphere (north to south and east to west), since prevailing conditions and even forcing dynamics vary from hemisphere to hemisphere.
Surely, someone is capturing the specific data for each hemisphere, and ,granted, GMT metrics are intended to even these out: but in terms of thermal dynamic realities, could not some relevant data be missing altogether in calculating GMT measures?
I wonder, therefore, whether relevant state-of-the-art climate modeling could attain even slightly more specific results by incorporating something along the lines of a “chirality factor” that would address the asymmetries that are features of the global climate. –or are the asymmetries already being addressed to climatologists’ satisfaction?
–or, if not “chirality” (or: if not “chirality” alone), perhaps “hemispheric torque asymmetry”?
Edward Burke,
You suggest an F&R2026-type analysis could be carried out at a hemispherical level rather than global. One effect usually encountered looking at a sub-set of the global temperature data is that the variability sky-rockets, a level of variability which somewhat cancels itself out at a global level. It is the variability that has prevented any statistical significant findings. But this sky-rocketing variability doesn’t appear with a NH/SH split. F&R2011 & F&R2026 is trying to see past that variability** to show the effect of AGW on temperature with statistically significant findings. (With F&R2011 the finding was an absence of deceleration in ΔT(global) while now with F&R2026 the finding is a recent acceleration.)
(** Specifically F&R are accounting for solar & volcanic variability as well as ENSO.)
The NH/SH hemispheres are not that well connected climatologically and, with their differing amounts of land (NH=40% land, SH=20%) & positions of land masses, they are reacting very differently to AGW. So would an F&R-style analysis of AGW rates show statistically-significance acceleration more starkly? Relative to globally, the variability is bigger in the NH but so is the warming trend. The SH has similar variability to that found globally but with a lower warming trend. And a plot of SH temperature does appear to have a relatively smooth acceleration post-1980, although the pre-1980 SH ΔT will prevent that showing up so well with the 30-year OLS trends.
MA Rodger:
Thank you for your response.
I would say instead that the Northern and Southern hemispheres are indeed intimately connected climatologically and for exactly the same reasons you give–amounts of land relative N and S and the positions of those respective land masses. (The AMOC does not “originate” north of the equator, after all, e. g.)
You may forgive me for not having engaged in requisite specificity as a consequence. To properly assess the unitary planetary climate and its functionality, I think at least some climate scientists somewhere in their work need to assess the distinct contributions dominant not only in the Northern Hemisphere and the Southern Hemisphere with their respective dominant dynamics but that assessment must be given to “each” of the planet’s hemispheres–not simply longitudinally “East” and “West” but also with respect to the hemispheric dominance represented by both the Atlantic and the Pacific Basins (not to dismiss the Indian Ocean Basin or the Southern Ocean Basin or the Arctic Ocean Basin) and also of the hemispheres (the hemispheric divisions) where the land masses are dominant where they occur.
If you were telling me that “hemispheric asymmetries are indeed being addressed satisfactorily by climate science”, I would not say I’m in any position to contest your assertion: while I appreciate the enormous challenges already faced by responsible climate scientists, I myself cannot say that I know that the granular assessment of all (overlapping) hemispheric asymmetries (their unique respective contributions, i. e.) is being made, not that I would expect such assessment to give a more startling picture of whatever rate GMT is rising or with whatever acceleration (I’m on board with FR2026 findings, to the extent I can digest them as a layman), but I remain concerned that an accurate description of global climate can only begin to emerge with granular global modeling. It was partly for this reason that I offered subsequently (see my post below dated 18 March) the view that commercial reckoning (courtesy of reinsurance risk analytics assessing temporal horizons going out 1 to 5 or 1 to 7 years) of existing and more-or-less immediate risks from encroaching Technogenic Climate Change is arguably out in front–already–of conventional (and academic) “climate modeling”.
My concern remains that climate realities are appreciably out in front of climate science data collection and analysis, that climate science data and analysis are appreciably out in front of social and political response, and that by the time we hear definitive word that cascades of self-amplifying tipping points begin to be reached (if these are not already being reached by the climate realities that are out in front of all measurement data to date), we will have passed every possible opportunity to mitigate a global disaster some of whose effects are already baked into our global cake, since GMSL rise is already on course to continue across centuries and millennia to come.
Edward Burke,
On the point of the connectivity between the climate of Northern & Southern hemispheres and specifically the role of the AMOC – the AMOC doesn’t actually “originate” anywhere but in terms of the surface parts of the circulation, it rises in the northern Pacific and equatorial Indian Ocean (as per the graphic HERE.
But generally, the meridional heat transfer at a global level is very small across the equator (as per Fig 3 of Schmitt (2018). The actual ocean heat transfer up the Atlantic is indeed actually ever northward according to Fig 12 of Blaker et al (2021) but even then the northward heat transport thro’ the North Atlantic is mainly heat obtained from north of the equator.
On the point of “district contributions” to AGW, regional analysis is generally being addressed in terms of the impacts of regional AGW but not the “contribution” that such “impacts” have on the global whole, this even with a NH/SH split. My personal view is that the NH/SH split should get more attention, mainly as an aid to analysis.
As for climatology not being “out in front” with the “science data collection (i.e. its use of the available data being less than up-to-date), the message of climatology to the “social and political” sphere has been quite definite for a third of a century. I can relate my own experiences trying to get that scientific message across 30 years ago. It quickly became evident that it was the “political” sphere which had to be convinced and that has not gone well. Indeed, it continues not to go well.
As for the point of GMSL rise, here I do feel the messaging from climatology was/is far too fixated with what would happen by 2100 and ignores the stark longer-term message. IPCC AR5 (Fig 13.14**) came out with a value of +2.3metres SLR per ºC AGW over a couple of millenia with another 6 metres if Greenland was allowed to go into melt-down. So the +1.5ºC limit of AGW would cause ≈ 10m SLR which would have quite an impact on coastlines, even in my neck of the woods with all its cliffs along (most of) the coast. It’s a powerful message – my local airport (Hurn) would be half under water – perhaps flying boats one end and normal jets the other?
(**The captionless Fig 13.14, top to bottom – thermal expansion, glaciers, Greenland, Antarctic, total, LH final, RH after 2000y.)
The rate of global warming was strangely static between the late 1970s and 2000, sitting roughly at +0.18ºC/decade. After 2000, the rate does exhibit acceleration (this being due to the 2016 El Niño and later warming appearing in the post-2000 30 year OLS calculations). Thro’ 2000-11 (the 30-y OLS runs out of data in 2011), the warming rate has risen to +0.23ºC/decade, an acceleration of +0.07ºC/decade/decade but the wobbles in the global temperature record prevent this being declared statistically significant. Had there been warming prior to 2000, this absence of statistical significance would likely not be enduring today.
And the reason the rate of AGW was static 1977-2000 is….
The two graphic HERE – Posted 27th March 2026 plot the NH & SH GISTEMP LOTI record 1940-on and the rate of warming/cooling of LOTI (global, NH & SH) for the full 1880-on record.
These graphics show this remarkable absence of acceleration 1977-2000 was because ❶ thro’ 1977-95 the SH warming decelerated while the NH accelerated, and ❷ both NH & SH had a bit of a ‘break’ either way 1995-2000. This ‘break’ in acceleration/deceleration was due to the much-argued-about ‘slowdown’ 2007-12, this wobble big enough to stop the 1982 El Chichón & 1991 Pinatubo coolings adding a bit of acceleration to the progress of 30y OLS warming.
The 1977-95 SH deceleration results mostly from a period of strong SH warming back in the late 1960s moving out of the 30y OLS analysis range.
The latest hemisphere warming rates (OLS centred at 2011) come out at NH=+0.35ºC/dec and SH=+0.15ºC/dec with the acceleration slightly slower in SH (NH +0.08ºC/dec^2, SH +0.06ºC/dec^2).
Those who wish to bravely project these accelerations to find a rate for 2026 will reach a global value for the rate of AGW at +0.33ºC/dec.
And I’ll leave the matter of statistical significance to others.
(I should add that very similar acceleration numbers appear using other SAT/SST records NOAA & HadCRUT. The NH acceleration record 1880-on agree strongly while SH accelerations only show a short period of slight difference tho’ the 1960’s and significant difference only begins to appear pre-1930.)
Thanks for this detailed response to FR26. I appreciate the technical context, but I’m struck by the overall framing.
The FR26 paper looks at observational data and finds statistically robust evidence that warming has accelerated. Your commentary acknowledges the methods are sound and the detection is robust under their assumptions. Yet the takeaway message seems designed to minimize this finding: “nothing new here,” “models already show this,” “hint: not much.”
But is that accurate? If observations are now pushing the upper bound of what CMIP6 projected, isn’t that scientifically significant? Shouldn’t that prompt us to ask whether models are systematically underrepresenting something? Instead, the framing seems to treat the model spread as an inviolable container – if an observation falls anywhere within it, we can safely ignore it.
And regarding the 2023-25 spike: we keep hearing “we don’t know why.” But if we genuinely don’t know the mechanism, how can we simultaneously claim the models “already showed this”? Models only “show” something if the mechanisms producing it in the simulation match reality. If we don’t know the real mechanism, placing the observation inside the model spread tells us nothing about whether the models got it right for the right reasons.
Isn’t there a simpler interpretation: warming is accelerating faster than many expected, our models have uncertainty ranges wide enough to occasionally capture this by chance, and maybe we should be paying closer attention to what the observations are telling us rather than filtering everything through model ensembles designed 15 years ago?
Cloud formation appears to be what is impacted most from cleaning up our pollution. Cloud formation isn’t understood well enough but all these cloud condensing nuclei that have bern eliminated from the pollution stack could be a contribution to the warming.
So we have elimination of pollution – sulphur etc and this then reduces cloud formation allowing more solar radiation to reach earth. This the only thing I’m seeing as possible cause
Just take a few more years to find out
Pete, “This the only thing I’m seeing as possible cause”. Other possible is cloud changes in response to a warming troposphere. (I mean, that’s setting aside what I read continually on this “Quora” Web Site Forum, that clouds Just Do That and that’s what’s warmed the last 50 years).
I skimmed through 122 Comments in 17 seconds and yet again saw no comment, no refutation, of what I’ve correctly asserted since 2014 and RealClimate Rules & Decorums (resembling Victorian ladies’ tea & petits four parties) allow cut’n’paste if it’s a different thread. During the period ~1970-2014 oft cited as a trend of +0.180 degrees / decade the La Nina and ENSO-neutral years both had a pretty-obvious trend of +0.165 degrees / decade (with the ENSO-neutral being a warmer trend line of course and I recall 0.13 degrees warmer but don’t quote me) with the slack taken up by El Nino years warming at +0.20 degrees / decade until 1995 and then at +0.23 degrees / decade 1995 to 2012 but it was spotty and I used calendar years (2 years per El Nino).
This Posting and most comments against it are highly deficient in not addressing the following by refuting it with high-quality physical science.
I made that plot on 11×17 paper in 2013 and intended to do it again using El Nino periods instead of calendar years. At https://www.youtube.com/watch?v=agKayS6h6xA 21:38 to 23:20 colour-coded pictorial of GMST anomaly 1976-98 to 1999-2012 and wind explanation.
The following I don’t have time to proof-read and was intended for posting on another Social Media Web Site Forum, one with a very large audience: My thought is “hiatus” started 1995 due to cause given in peer-reviewed published paper, wind stronger explanation, Pacific Ocean. By 2012 the wind was a massive 30% (1 metre / second) stronger than pre-1995. “Recent intensification of wind-driven circulation in the Pacific and the ongoing warming hiatus” Nature Climate Change 4, 222–227 (2014) doi:10.1038/nclimate2106 Received 11 September 2013 Accepted 18 December 2013 Published online 09 February 2014 Corrected online 14 February
“We were surprised to find the main cause of the Pacific climate trends of the past 20 years had its origin in the Atlantic Ocean,” said co-lead author Dr Shayne McGregor.
“The solution was found in the rapid warming of the Atlantic Ocean basin, which has created unexpected pressure differences between the Atlantic and Pacific”
”Many climate models appear to have underestimated the magnitude of the coupling between the two ocean basins, which may explain why they struggled to produce the recent increase in Pacific Equatorial trade wind trends”.
“researchers don’t expect the current pressure difference between the two ocean basins to last. When it does end, they expect to see some rapid changes, including a sudden acceleration of global average surface temperatures”. I figure it ended in 2015 so I calculated that average there was -0.20 degrees SST anomaly over central-eastern Pacific 60S-60N, 13% of Earth’s area, 1976-98 to 1999-2012 when NOAA have GMST anomaly 0.30 degrees, so 13%* 0.50 degrees = +0.065 degrees S.B. added at 2014 to adjust for the Unnatural Fluctuation 1995–2014, by incremental adjustment from 1996 on to 2014.
https://www.youtube.com/watch?v=agKayS6h6xA Trenberth Ocean Heat Uptake: The Apparent Hiatus in Global Warming and Climate Sensitivity Yale University21:38 to 23:20 colour-coded pictorial of GMST anomaly 1976-98 to 1999-2012 and wind explanation, Pacific Ocean eastern 2/3rds COOLED over the 18 years while almost everywhere else except the Southern Ocean warmed.
Latitudes width width
0.0 -0.3 KM*10**3 of MST anomaly 1976-98 to 1999-2012 at 0.0 or -0.3 degrees
30-60N 1.8 3.7
0-30N 6.2 3.3
0-30S 2.7 11.2
30-60S 4.0 11.1
0.0 -0.3 KM**2*10**6 of MST anomaly 1976-98 to 1999-2012 at 0.0 or -0.3 degrees
0-60N 12.3 20.5
0-60S 10.1 25.2
60S-60NS 22.4 45.7
So here are GMST anomaly trends as shown everywhere and adjusted by my +0.065 degrees at 2014.
GMST adjusted GMST
increase increase
rate rate
0.18 0.20 1978–2012
0.30 0.25 2012-2025
So I figure the true acceleration in warming rate is 0.20 to 0.25 / decade, an acceleration of 25% from about 1995 to 2020, rather than 0.18 to 0.30 / decade, an acceleration of 67%. Due to adjustment needed for the Unnatural Fluctuation 1995–2014 (humans warmed Atlantic Ocean surface which cooled Pacific Ocean surface).
I’ve been following RealClimate since its inception. James Hansen’s work has been underrepresented and frequently dismissed on this site all along, despite him being Gavin‘s boss for many years. Kevin Anderson fared even worse. Now Foster (Tamino) and Rahmstorf are suddenly getting the cold shoulder too, despite having been major contributors to this site. I sense a pattern. Findings that reinforce the IPCC orthodoxy are endorsed here, while findings that reveal it to be too conservative are spun as alarmist or excluded altogether.
Why weren’t Foster and Rahmstorf invited to present their paper here, or at least invited to respond to Lenssen’s critique? Why does Lenssen not mention that Hansen et al. came to a similar conclusion in February 2025 (Global Warming Has Accelerated), and unlike Foster and Rahmstorf, suggested a plausible cause for the acceleration?
yes everyone acknowledges the cuts in pollution (suphur etc from china and ship fuel) and maybe its correlation to cloud fortmation (cloud condensing nuclei). but as yet not how much it has increased warming because the time line is sinply not long enough as yet.
few more years of data needed
Re: “Why does Lenssen not mention that Hansen et al. came to a similar conclusion in February 2025 (Global Warming Has Accelerated), and unlike Foster and Rahmstorf, suggested a plausible cause for the acceleration?“
Foster + Rahmstorf didn’t come to the same conclusion since they did not find statistically significant acceleration of the global temperature trend. Lenssen explained that. And Foster + Rahmstorf highlighted the fact that Hansen et al. did not do an appropriate statistical analysis to check for acceleration:
Foster + Rahmstorf instead found statistically significant acceleration only after removing the impact of changes in total solar irradiance, ENSO, and volcanic emissions. Lenssen explained that as well. So the paper’s title “Global Warming Has Accelerated Significantly” is misleading. Maybe instead of baselessly insinuating there is some Real Climate, pro-IPCC plot against Hansen and Foster, you should instead thank Lenssen for his explanation and learn from it? You can also check Foster + Rahmstor’s paper to confirm that what Lenssen said is correct:
Also, Foster is free to respond to Lenssen’s critique. In fact, Foster already has and gave only a minor correction. Finally, Hansen’s work has been repeatedly discussed and lauded on this website. So please drop the biased narrative of some anti-Hansen “IPCC orthodoxy“.
Climate change is accelerating but it isnt accelerating because we dont know the forcings of suplur and clouds and only after we remove natural heating mechanisms do we find some potential warming because we need more time to validate this accelerated warming which isnt accelerating yet ;)
Amen to complicated science
You could just look up what ‘statistically significant’ means since that’s what ‘significantly” refers to in the paper’s title. You’ve had months to look it up and people explained it to you multiple times when you distorted its meaning:
https://www.realclimate.org/index.php/archives/2026/03/how-robust-is-our-accelerometer/#comment-846122
Yet you instead continue to make these comments that distort probability and that I’m beginning to doubt are made in good faith.
So for the 10th time: it’s likely that global surface warming is accelerating. But the probability is not high enough to claim statistically significant acceleration of that warming, i.e. to reject the null hypothesis of no change in the warming trend. There’s nothing confusing about this, despite you trying to make it seem so.
98% isn’t high enough or the methodology isn’t rigorous enough. Always a problem is trying to demonstrate something might have changed and I’ve got no issue with that. I didn’t write the paper, not once but twice as 90% wasn’t good enough and now 98% isn’t rigorous enough.
Their mythology is flawed as you can’t just takeout events and see what’s left
You ought to relax a bit as I’m not knocking climate change science at all. 0.2C is fine as it stands and as mile Mann had said – reality is bad enough.
The AMOC ain’t collapsing anytime soon and warming hasn’t accelerated coz everyone’s incorrect but the IPCC which is fair enough as it takes ages to churn out these reports and they do scrutinise a lot of work on the subject.
37 billion tonnes a year and climbing for the moment. Maybe the next report will convince enough people to act on these emissions but it’s doubtful
Neither the paper nor its pre-print said 98% for the detection of acceleration for the global temperature trend. 98% would imply p0.05) would not be enough for statistical significance, despite your prior misinformation to the contrary.
98% is not what they say for the global temperature trend, but instead for the trend adjusted to remove the impact of changes in total solar irradiance, ENSO, and volcanic emissions. You’ve had this explained to you so many times that it’s mind-boggling you keep conflating this adjusted trend with the global temperature trend:
Also, you can stop tone trolling. And to reiterate what Barton Paul Levenson said when I previously responded to your misinformation on this topic:
Re: “98% would imply p0.05) would not be enough for statistical significance, despite your prior misinformation to the contrary.”
It seems the symbols I used deleted text in this section during formatting. This is what was said without those symbols:
98% would imply ‘p less than 0.05’, which would be enough to reject the null hypothesis of no change in the warming trend; i.e. to imply statistically significant acceleration. 90% (i.e. ‘p more than 0.05’) would not be enough for statistical significance, despite your prior misinformation to the contrary.
Atomsk’s Sanakan,,
In the grand scheme of things, what we can say is that the rate of AGW had been effectively constant for the period 1970-2015 (running at +0.17ºC/decade in GISTEMP). Post-2015 AGM has been running entirely above that linear rate of increase. F&R26 (the subject of above OP) does not modify such a situation. All it does is reduce the wobbles in the data that allows statistical significance to increase to a level that allows folk to accept that the +0.17ºC/decade 1970-2015 linear trend of the underlying AGW is ended. There are some potential problems with the F&R26 adjustment but that is another story.
I would say that having the last decade of global temperature data sitting well above the trend line it has wobbled about so closely for the previous half century** is “significant.” If the statisticians cannot quantify that “significance,” that is surely an issue for the statistics*** not climatology.
(**See graphic of GISTEMP here – Posted 23rd March 2026.)
Perhaps what should be an issue for climatology is why the rate of AGW remained constant for half a century.
At a very simplistic level, if forcings is applied to the climate, the total increasing at a constant level****, those additional annual forcings would be adding a bigger temperature increase over the first decade of their application followed a far smaller continuing increase to temperature for the next century or more, perhaps a tenth or less the rate of increase but an additional rate that would accumulate and become significant after a few decades. Thus after more than half a century of very roughly constant forcing from GHGs, there should be seen perhaps even a 50% increase in the rate of AGW.
Of course the aerosol forcing is poorly defined which makes a simplistic approach a little too simplistic.
(**** GHG climate forcing has been roughly +0.4Wm^-2/decade since 1970)
The models which do account for aerosols, abet inexactly, do show a general acceleration over time with the rate of AGW running at roughly +0.3ºC/decade through the 2020s.
Given all that, is it worthwhile arguing either what is a new rate of AGW post-2010 (as some are want to do) or what is the significance (or lack thereof) of the post-2015 wobble in a +0.17ºC/decade world?
The last decade temperature data could include a significant adjustment to the climate response through some big unforced variation the models have failed to capture. With such adjustment, the post adjustment rate of AGW presumably prove to be far lower than the situation would be without such an adjustment.
And where do the poorly quantified aerosols fit into this? The reduction in aerosols itself is effectively another ‘adjustment’.
CK,
Tamino comes here all the time. Your conspiracy theory of RealClimate moderation doesn’t hold up. There is no feud between the moderators and Foster/Rahmstorf.
I disagree that Stefan and I got the “cold shoulder.” What we got was a thoughtful critique, which included possible weaknesses in the work — and that’s exactly what we wanted. Anything less would be unscientific.
I will also point out that Stefan is part of the regular RealClimate team, and if either of us had wanted to we would probably have been given a forum to discuss the work on this site. Frankly, I prefer a more objective appraisal; we already “had our say” in the paper itself.
Appears to me that people are stating that you can’t just remove a few natural events and claim that the underlying rate of climate change has changed. Significantly.
That’s what I’ve read anyway. Flawed methodology arguments
Dear RC Community:
Perhaps possibly maybe the time begins to arrive to incorporate risk data analyses from the global reinsurance industry.
The following summary (courtesy of Google Gemini) assesses how FR26 can be incorporated into analysis of risks facing the Brazilian Atlantic port of Santos:
‘The integration of high-velocity research like Foster and Rahmstorf (2026) into commercial catastrophe (Cat) models marks a fundamental break from the “wait-and-see” approach of the IPCC. For reinsurers, this is not a theoretical debate about decadal trends; it is a mechanical recalibration of event probability.
In the case of Santos, and the South Atlantic more broadly, the data from Foster and Rahmstorf (FR26) and the “Aerosol Shock” research (e.g., Diamond et al., 2025; Hansen et al., 2025) are being used to justify a pivot in how “Secondary Perils” are priced.
1. The FR26 “Acceleration Signal” in South Atlantic Risk
The Foster and Rahmstorf (2026) paper asserts with 98% confidence that global warming has accelerated to nearly 0.35°C–0.4°C per decade since 2015.
The Cat Model Application: Firms like Moody’s RMS and Verisk/AIR use this to justify “Non-Stationary” modeling. Historically, they assumed the “climate of today” was like the “climate of the last 30 years.” FR26 provides the statistical cover to assume the “climate of 2027” will be significantly more energetic than 2017.
The Santos Impact: For Brazil’s Atlantic coast, this translates to a higher frequency of Extratropical Cyclones. While the IPCC might focus on the long-term shift in the South Atlantic Convergence Zone, Cat models incorporate the FR26 acceleration to increase the weight of “tail-risk” storm surges in their 1-to-5-year solvency plans.
2. The “Aerosol Shock” and Tropical Transition
The reduction in shipping sulfur (IMO 2020) has created a localized “Termination Shock” in the South Atlantic.
The “Unmasking”: Without the reflective sulfate “parasol” from the heavy shipping lanes around the Cape of Good Hope, sea surface temperatures (SSTs) in the South Atlantic have spiked.
The Cat Model Integration: Reinsurers are seeing that “Tropical-like” characteristics are moving further south. In February 2026, catastrophic flooding in Southeastern Brazil was attributed by groups like ClimaMeter to human-driven climate change (thermodynamic loading).
The Data Source: Cat modelers use Vexcel and Nearmap imagery to verify the “Damage Signature” of these new storms. If a 2026 storm in Santos looks more like a Caribbean hurricane than a traditional cold front, they recalibrate the “vulnerability curves” for the port’s gantry cranes and storage facilities.’
The foregoing summary suggests to yours truly that climate perils are not nearly as remote today as IPCC and AR7 participants may prefer to believe as 2029 reporting approaches, that climate sciences face a notable lag in both data collection and analysis that is not keeping pace with climate realities, and that, worst of all, political and social responses to the imminent threats posed by Technogenic Climate Change are well behind climate realities, climate science assessments, and reinsurance industry catastrophic risk modeling.
That global reinsurance firms are using the most sophisticated and (arguably) best-informed modeling for assessing immediate risks (1 to 5 or 1 to 7 years) currently available might give the climate science community cause for pause so that it can properly recalibrate its own efforts. (With respect to the IPCC, Moody’s RMS and Verisk/AIR seem to be working in 2026 with the RCP 4.5 baseline.)
“global warming has accelerated to nearly 0.35°C–0.4°C per decade since 2015”. How nearly to 0.35°C ? I been arguing with Fossils mostly about whether it’s “biggish” or “just a small” for ice loss , heat and stuff. Lindzen says it’s a “modest warming” (“modest warming of about 1 degree”). I’ve been claiming 0.065 degrees but I’m probably way off. Either way that’ll be either “not much” or “significant” I would think. As I convert to being a Socialite I’m using “smallish” “biggish” “almost” and “nearly” much more because sums are tedious.
Re “misleading” title, conspiracy theory, etc.:
The issue is the appearance of bias. Results that are more drastic than the IPCC consensus are frequently denigrated here, even when they’re from highly respected authors. Sanakan’s claim that the title of FR26 is “misleading” exemplifies the bias. They chose their title for a reason, and it was good enough for AGU Geophysical Research Letters. I’m not alleging a conspiracy. Bias is often unconscious and implicit. Downplaying the acceleration of global warming as “not much” is bad optics, because after more than 30 years it’s apparent, at least to me, that the scale and rapidity of climate change have been consistently underestimated. That underestimation has complex structural causes, but unlike the IPCC, RealClimate’s posts aren’t sanitized by diplomats. It’s implausible to blame petrostates for RealClimate casting doubt on all but the most mainstream results. The more likely cause is excessive reticence, which contributes to stasis by failing to convey seriousness and urgency. Both Hansen and Anderson have repeatedly criticized excessive reticence as an inappropriate response to the planetary emergency. Humanity is losing control, but you’d never know it from this website. Wake me up when the Keeling curve plateaus.
https://www.ilr.cornell.edu/news/about-ilr/we-have-planetary-emergency
https://columbia.edu/~jeh1/mailings/2016/20160323_DangerousReticence.pdf
https://theconversation.com/the-disagreement-between-two-climate-scientists-that-will-decide-our-future-217759
https://www.theguardian.com/environment/2023/jul/19/climate-crisis-james-hansen-scientist-warning
Chris Korda,
The thing is one needn’t posit bias. In any scientific discipline, there will be a range of opinions. Most of the opinions will occupy the middle range–it’s safer, and there is usually firmer evidentiary footing than is found on the extremes. Scientists have opinions, and they have reasons why they have those opinions. If the reasons are evidence based, the scientists fall within the acceptable range of opinion. Both Hansen and those who view Hansen’s assessments as too pessimistic fall within that range. To frame the disagreements that occur as a conflict between two walled, antagonistic camps is not just wrong, it is tiresome. It’s an exchange of views, an attempt to persuade.
Hanlon’s law states that one should not attribute to malice what can be explained by stupidity. I would like to introduce a corrolary–neither stupidity nor malice (nor bias) are required to explain that which can be understood in terms of the law of large numbers.
Re: “The issue is the appearance of bias. Results that are more drastic than the IPCC consensus are frequently denigrated here, even when they’re from highly respected authors. Sanakan’s claim that the title of FR26 is “misleading” exemplifies the bias.“
You haven’t shown bias on my part. You instead asserted bias without addressing any of the evidence cited to you. That reveals bias in favor of claiming global warming significantly accelerated, even when that claim contradicts the statistical analysis done in the paper.
To make this clearer feel free to state what numbered statement, if any, you don’t accept and why:
1) The paper’s title is “Global Warming Has Accelerated Significantly”.
2) The paper does not show global warming accelerated significantly since the paper’s text states it found no statistically significant acceleration of the global temperature trend.
Accepting statement 1 and statement 2 implies the paper’s title is misleading. That’s not “bias”; it’s a logical implication. Statement 1 is supported by the paper’s title. And I already quoted portions of the paper supporting statement 2. Here they are again:
Re: “Downplaying the acceleration of global warming as “not much” is bad optics, because after more than 30 years it’s apparent, at least to me, that the scale and rapidity of climate change have been consistently underestimated. […] The more likely cause is excessive reticence, which contributes to stasis by failing to convey seriousness and urgency.“
There’s no significant warming acceleration to explain. This isn’t a matter of “optics“, “excessive reticence“, “seriousness and urgency“, etc. with respect to saying whether warming significantly accelerated. It’s a matter of accuracy; it’s a matter of whether significant acceleration actually happened. To say otherwise is a fallacious ‘appeal to consequences’ where one prioritizes a claim’s usefulness, optics, emotional message conveyed, etc. over a claim’s accuracy.
Re: “They chose their title for a reason, and it was good enough for AGU Geophysical Research Letters.“
Sometimes peer reviewers and/or a journal make a mistake. Hence the existence, for example, of post-publication peer review. I think they made a mistake by not requiring the paper’s title be changed. I’ve explained why above. I suspect the authors chose the title because the lead author believes true global warming is the trend adjusted to remove the impact of changes in total solar irradiance, ENSO, and volcanic emissions:
I think that’s incorrect since the global warming trend includes the temperature impact of all factors, not only anthropogenic factors and/or not only some non-anthropogenic factors. For example, a global temperature increase caused by increased solar output is still global warming. To say otherwise conflates ‘global warming’ with ‘anthropogenic global warming’. I’m not alone in thinking this:
A more accurate title for the paper would thus be: “Anthropogenic Global Warming Has Accelerated Significantly”. That’s especially so since papers like “Is Anthropogenic Global Warming Accelerating?” have titles that distinguish anthropogenic warming from overall global warming. The discussion could then move to how well the adjusted trend represents the anthropogenic trend, i.e. how strong is the residual contribution from non-anthropogenic factors the authors didn’t adjust for. The paper’s lead author is aware of this issue, yet the paper’s title misleadingly obscures it:
The aforementioned points have other implications, such as that Michael Mann was correct to object that James Hansen hadn’t shown significant warming acceleration. This also illustrates how non-anthropogenic factors like decreasing solar output can prevent significant warming acceleration, even if anthropogenic warming significantly accelerates. And it reveals the error of projections that treat the adjusted trend as equivalent to the global temperature trend. These issues were raised before the paper’s publication, when the paper was in the pre-print stage.
Re: “https://www.theguardian.com/environment/2023/jul/19/climate-crisis-james-hansen-scientist-warning“
That article shows Mann disputing Hansen over whether there’s significant acceleration:
Mann was right about that, as shown above. That’s not changed by resorting to ‘appeal to consequences’.
“We see no evidence of what Jim is claiming,” said the blind man.
The difference between observed global surface temperature, say GMST from one year to the next, and the isolated Anthropogenic Global Warming measurements ~ say AGMST from one year to the next, on average ranges between 0.01C and 0.02C. So tiny it barely exists.
While the Rate of Warming Increase of that non-Anthropogenic component portion is essentially ~Zero over decadal timescales. It’s so small you can barely see it, while a blind man probably sees nothing at all.
This correctly places the objective scientific importance of the thousands of words written about that particular topic, as well as the opinions of several men. Chris Korda qualifies the core context quite well here above. None so blind as those who will not see holistically.
The paper confirms Jim Hansen didn’t do the appropriate statistical tests. Those tests show there isn’t yet statistically significant acceleration of the global temperature trend. The paper thus confirms Michael Mann’s claim that Hansen hadn’t shown significant acceleration.
And Chris Korda didn’t get to “the core context quite well”. They instead claimed there is bias against Foster and Rahmstorf, despite Foster disagreeing with that.
James Hansen
We addressed the physics of the problem, as summarized above in discussing the four principal sources of information. None of these matters were addressed by the clique of climate “experts” who spoke in the media the day after our paper “Global warming has accelerated”[7] came out. Instead of addressing the climate physics, the criticisms were ad hominem” “Hansen exaggerates,” “Hansen makes lots of mistakes,” “Hansen is not collegial,” our analysis was “too simple” and our conclusions were “outside the mainstream.” These experts thus totally shut down public discussion of our paper. Steve Kolmes, the editor of Environment, was stunned; you should speak with him, if you think that I am exaggerating. The media has “go to” scientists who are willing or eager to speak out. I was reminded of this when Seth Borenstein of the Associated Press told me that he could not write about our paper “Ice Melt, Sea Level Rise, and Superstorms” because 5 of his 6 “go to” scientists advised against it. That’s a story for another time.[15]
This is not rocket science. You can understand it and help explain it to people. Aerosol forcing was still increasing (causing more cooling) during the period 1970-2005, as aerosols were spread more globally, reducing the net forcing from about 0.45 to 0.3 W/m2 per decade (GHG minus aerosol forcings). Recently, at least since ~2015, the aerosol change (reduced aerosol amount, thus reduced cooling) adds to the GHG forcing instead of subtracting from it, thus producing a net forcing near 0.6 W/m2 per decade.
No wonder global warming is accelerating. Why do they resist this? Why argue that the real world is still somewhere within the model fog?
The climate model sensitivity is set by choices of scores of quantities over decades of model development. Choice among alternative model versions, i.e., choice of model parameters, is influenced by which model gives better agreement with global warming. If the model was developed with aerosols close to IPCC’s best estimate (negligible change of aerosol forcing during 1970-2005), the model needs to have a sensitivity near 3°C for doubled CO2 to match observed warming.
So, if the aerosol forcing was not actually constant, that’s a BFD. It is not so easy to go back and make different parameter choices. It’s a lot easier to say the real world is still in the model fog, or Hansen is full of it. Let’s just ignore the four ways that they showed climate sensitivity is high.
Why does this matter?
Climate sensitivity and aerosols are two independent matters, tied together only because of the way the modelers make their choices. That’s a reason for having independent ways to determine climate sensitivity, i.e., the list of four ways that the modelers do not want to talk about.
It matters because the switch from 0.3 to 0.6 W/m2 per decade is the reason that Earth’s energy imbalance doubled and global SSTs increases are accelerating.
But the real reason this matters is that we need to inform young people accurately about the situation to help them deal with it. This funny business with the clique was enough to get me off the farm to live in an apartment, where I can work much more efficiently.
Clarification: “trash talk” is what competitive athletes do. Nothing wrong with that. Caitlin Clark is a prolific trash talker — I love it. Larry Bird and Magic Johnson traded trash talk all the time. It’s rather common among some of the best athletes. However, when serious scientific issues are raised on one side and the clique responds with ad hominem remarks, it is inappropriate to describe this as trash talk, which implies that the two behaviors are equal. I don’t give a whit about being called brash, although I think that blunt is probably more accurate. The issue is how to communicate scientific understanding to the public — if the public understood the climate situation, polices would be different — but we scientists are not good communicators.
The NOAA Climate Prediction Center updates El Nino information every week, normally on Monday. Figures 1, 3 and 5 here were copied from their post on 16 March 2026.
Hansen J, Kharecha P, Morgan D, Vest J. Another El Nino Already? What Can We Learn from It? 06 February 2026
Hansen JE, Kharecha P, Sato M et al. Global warming has accelerated: are the United Nations and the public well-informed? Environ.: Sci. Pol. Sustain. Devel. 67, 6–44, 2025, https://doi.org/10.1080/00139157.2025.2434494
Tierney JE, Zhu J, King J et al. Glacial cooling and climate sensitivity revisited. Nature 584, 569-73, 2020
Tierney was able to exclude from her analysis the assumption that microbiota in the ocean do not adapt to temperature change, even over millennia. With that prior, dubious, assumption, ice age ocean temperatures were set based on the temperatures that a given species tolerates today.
Osman MB, Tierney JE, Zhu J et al. Globally resolved surface temperatures since the Last Glacial Maximum. Nature 599, 239-44, 2021
Hansen J, Sato M, Hearty P et al., “Ice melt, sea level rise and superstorms: evidence from paleoclimate data, climate modeling, and modern observations that 2C global warming is highly dangerous,” Atmos Chem Phys 16 3761-812, 2016.
Based on global climate modeling, paleoclimate analyses, and ongoing observations of climate processes, we inferred that the threats of long-term climate change were more imminent than IPCC recognized. Using a model that did a good job of simulating deepwater formation, we concluded that continued increasing greenhouse gas emissions is likely to cause shutdown of the ocean’s overturning circulations (AMOC and SMOC) by midcentury. Those shutdowns, in turn affect melting of Antarctic ice shelves, and would likely cause multimeter sea level rise on the century (not millennial) time-scale. The Southern Meridional Overturning Circulation is fed by Antarctic Bottom Water Formation at several coastal sites around Antarctica. This deepwater tends to fill the lower half of the global ocean, but its volume has been shrinking over the past several decades as meltwater reduces the rate of bottom water formation. This ocean circulation is an important player in the global carbon cycle.
https://jimehansen.substack.com/p/super-el-nino-super-warming-is-the
There are basic Physics reasons for why the southern ocean SSTs is rapidly warming despite the change in IMO aerosols not decreasing as fast as they have in the northern hemisphere. The same reason why the rapid sea ice melting from underneath the Antarctic ice sheets is occurring. The same reason why the Mediterranean warming spike produced the Valencia record breaking floods. The same reason why 2024 GMST spiked to a new all time record and have not significantly decreased in 2025 like used to happen post-El Ninos prior to 1998 and 2015-2016 etc.
Holistic climate science is an interdisciplinary approach that studies the climate system as a complex, interconnected whole rather than as isolated parts. It integrates natural sciences (physics, biology, chemistry) with social sciences, economics, and political systems to analyze feedback loops and systemic dependencies.
Systemic View: Rather than breaking down components (reductionism), it focuses on the whole system and the relationships between components.
Interconnectedness: It recognizes that climate change is linked to ecological, social, economic, and political factors.
Interdisciplinary: It draws from meteorology, oceanography, ecology, sociology, and economics to create a complete picture.
Feedback Loops: It focuses on understanding complex interactions, such as how thawing permafrost (natural) affects economic infrastructure (human) and exacerbates warming.
It is Always Solutions-Oriented: It promotes integrated strategies, such as circular economies or nature-based solutions, rather than just treating symptoms, or isolating singular causes based on statistics alone.
None of this is being said for the benefit of the sockpuppet account, but instead for the benefit of those its spent years trying to mislead:
The IPCC’s 2021 equilibrium climate sensitivity (ECS) estimate is ~3°C, while James Hansen’s 2023 estimate is ~5°C. Both drew on paleoclimate data for time periods like the Pliocene and the Last Glacial Maximum (LGM). Hansen’s higher ECS also has implications for cloud feedback:
There’s plenty of work on cloud feedback, the Pliocene, the LGM, etc. that’s closer to the IPCC’s ECS estimate than to Hansen’s higher estimate. This includes work published after the research included in the IPCC’s and Hansen’s assessments:
Finally, Hansen did not do the appropriate analysis to determine whether there was statistically significant acceleration of global warming. When the appropriate analysis is done, there is no significant acceleration. That’s a central point of the paper this post was on:
Dr GIlbz – she states that it states 98% confidence in the FR26 paper so ca;l me a fool or a trol (I might be the former but not the latter) and Ill go with that :)
https://www.youtube.com/watch?v=DzXyi6purZY&t=879s
and now for the actuaries (Just have a think – https://www.youtube.com/watch?v=e2paRMQ1k6k&t=4s) who again are sounding the alarm on the rate of warming (from the University of Exeter) state this.
We are in a period of accelerated warming.
Good article here citing recent work done on low level cloud and any warming from them
https://www.carbonbrief.org/guest-post-how-declining-cloudiness-is-accelerating-global-warming/
The models appaer to accont for low level clouds declining (relative humidity).
https://climatereanalyzer.org/clim/sst_daily/?dm_id=world2
late march breaks the world heat record 60n – 60s