As previewed last weekend, I spent most of last week at a workshop on Climate Sensitivity hosted by the Max Planck Institute at Schloss Ringberg. It was undoubtedly one of the better workshops I’ve attended – it was focussed, deep and with much new information to digest (some feel for the discussion can be seen from the #ringberg15 tweets). I’ll give a brief overview of my impressions below.
Climate Science
A hypothesis about the cold winter in eastern North America + Update
The past winter was globally the warmest on record. At the same time it set a new cold record in the subpolar North Atlantic – and it was very cold in the eastern parts of North America. Are these things related?
Two weeks ago NOAA published the following map of temperature anomalies for the past December-January-February (i.e. the Northern Hemisphere winter). One week ago, we published a paper in Nature Climate Change (which had been in the works for a few years) arguing that the cold in the subpolar North Atlantic is indicative of an AMOC slowdown (as discussed in my last post). Immediately our readers started to ask (as we indeed had been asking ourselves): does the cold winter in eastern North America (culminating in the Inhofe snowball incident) have anything to do with what is going on in the Atlantic?
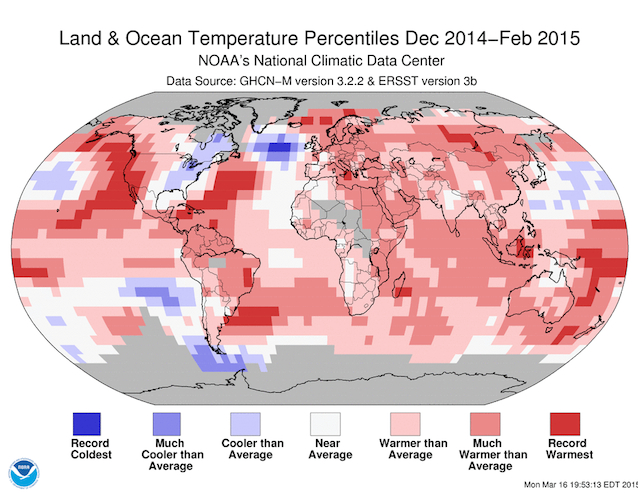 Fig. 1 Temperature anomaly map for the past december-january-february, from NOAA.
[Read more…] about A hypothesis about the cold winter in eastern North America + Update
References
- S. Rahmstorf, J.E. Box, G. Feulner, M.E. Mann, A. Robinson, S. Rutherford, and E.J. Schaffernicht, "Exceptional twentieth-century slowdown in Atlantic Ocean overturning circulation", Nature Climate Change, vol. 5, pp. 475-480, 2015. http://dx.doi.org/10.1038/nclimate2554
What’s going on in the North Atlantic?
The North Atlantic between Newfoundland and Ireland is practically the only region of the world that has defied global warming and even cooled. Last winter there even was the coldest on record – while globally it was the hottest on record. Our recent study (Rahmstorf et al. 2015) attributes this to a weakening of the Gulf Stream System, which is apparently unique in the last thousand years.
The whole world is warming. The whole world? No! A region in the subpolar Atlantic has cooled over the past century – unique in the world for an area with reasonable data coverage (Fig. 1). So what’s so special about this region between Newfoundland and Ireland?
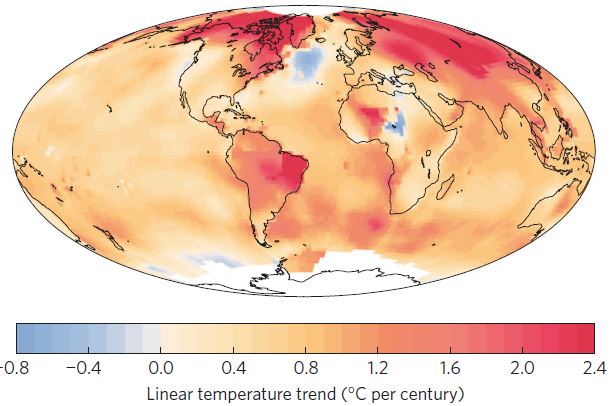
Fig. 1 Linear temperature trend from 1900 to 2013. The cooling in the subpolar North Atlantic is remarkable and well documented by numerous measurements – unlike the cold spot in central Africa, which on closer inspection apparently is an artifact of incomplete and inhomogeneous weather station data.
Climate Sensitivity Week
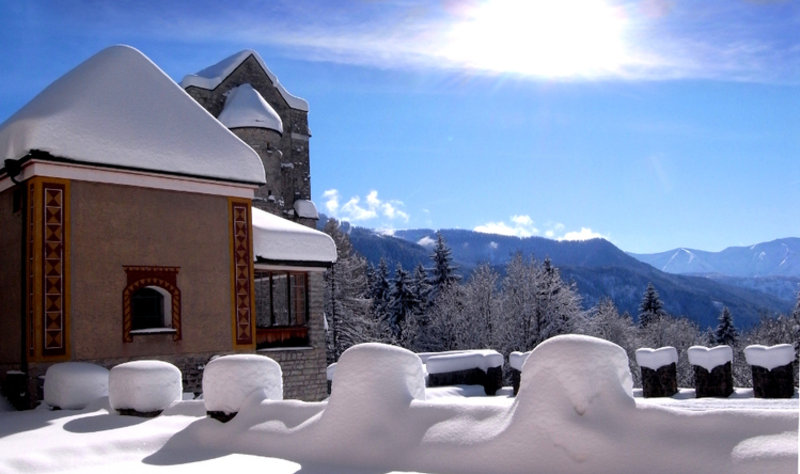 Some of you will be aware that there is a workshop on Climate Sensitivity this week at Schloss Ringberg in southern Germany. The topics to be covered include how sensitivity is defined (and whether it is even meaningful (Spoiler, yes it is)), what it means, how it can be constrained, what the different flavours signify etc. There is an impressive list of attendees with a very diverse range of views on just about everything, and so I am looking forward to very stimulating discussions.
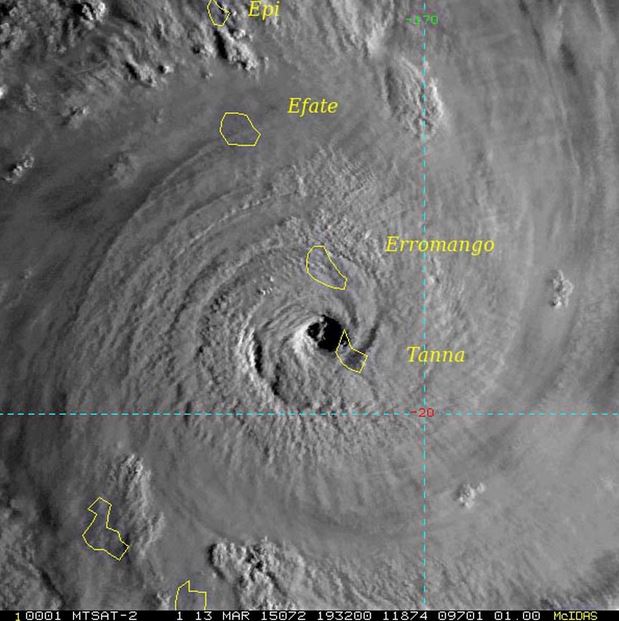
Severe Tropical Cyclone Pam and Climate Change
Guest post by Kerry Emanuel
In the past 16 months, two exceptionally intense tropical cyclones, Haiyan and Pam, have struck the western Pacific with devastating effect. Haiyan may have had the highest wind speeds of any tropical cyclone on record, but we will never know for sure because we do a poor job estimating the intensity of storms that are not surveyed by aircraft. (Currently, only North Atlantic tropical cyclones are routinely reconnoitered by aircraft, and only if they threaten populated regions within a few days.) Pam’s analyzed intensity puts it within 10 knots of the most intense storms on record in the South Pacific, but here again this is within the error bars of satellite-derived intensity estimates.
[Read more…] about Severe Tropical Cyclone Pam and Climate Change
Unforced variations: March 2015
Climate Oscillations and the Global Warming Faux Pause
No, climate change is not experiencing a hiatus. No, there is not currently a “pause” in global warming.
Despite widespread such claims in contrarian circles, human-caused warming of the globe proceeds unabated. Indeed, the most recent year (2014) was likely the warmest year on record.
It is true that Earth’s surface warmed a bit less than models predicted it to over the past decade-and-a-half or so. This doesn’t mean that the models are flawed. Instead, it points to a discrepancy that likely arose from a combination of three main factors (see the discussion my piece last year in Scientific American). These factors include the likely underestimation of the actual warming that has occurred, due to gaps in the observational data. Secondly, scientists have failed to include in model simulations some natural factors (low-level but persistent volcanic eruptions and a small dip in solar output) that had a slight cooling influence on Earth’s climate. Finally, there is the possibility that internal, natural oscillations in temperature may have masked some surface warming in recent decades, much as an outbreak of Arctic air can mask the seasonal warming of spring during a late season cold snap. One could call it a global warming “speed bump”. In fact, I have.
Some have argued that these oscillations contributed substantially to the warming of the globe in recent decades. In an article my colleagues Byron Steinman, Sonya Miller and I have in the latest issue of Science magazine, we show that internal climate variability instead partially offset global warming.
We focused on the Northern Hemisphere and the role played by two climate oscillations known as the Atlantic Multidecadal Oscillation or “AMO” (a term I coined back in 2000, as recounted in my book The Hockey Stick and the Climate Wars) and the so-called Pacific Decadal Oscillation or “PDO” (we a use a slightly different term–Pacific Multidecadal Oscillation or “PMO” to refer to the longer-term features of this apparent oscillation). The oscillation in Northern Hemisphere average temperatures (which we term the Northern Hemisphere Multidecadal Oscillation or “NMO”) is found to result from a combination of the AMO and PMO.
In numerous previous studies, these oscillations have been linked to everything from global warming, to drought in the Sahel region of Africa, to increased Atlantic hurricane activity. In our article, we show that the methods used in most if not all of these previous studies have been flawed. They fail to give the correct answer when applied to a situation (a climate model simulation) where the true answer is known.
We propose and test an alternative method for identifying these oscillations, which makes use of the climate simulations used in the most recent IPCC report (the so-called “CMIP5” simulations). These simulations are used to estimate the component of temperature changes due to increasing greenhouse gas concentrations and other human impacts plus the effects of volcanic eruptions and observed changes in solar output. When all those influences are removed, the only thing remaining should be internal oscillations. We show that our method gives the correct answer when tested with climate model simulations.
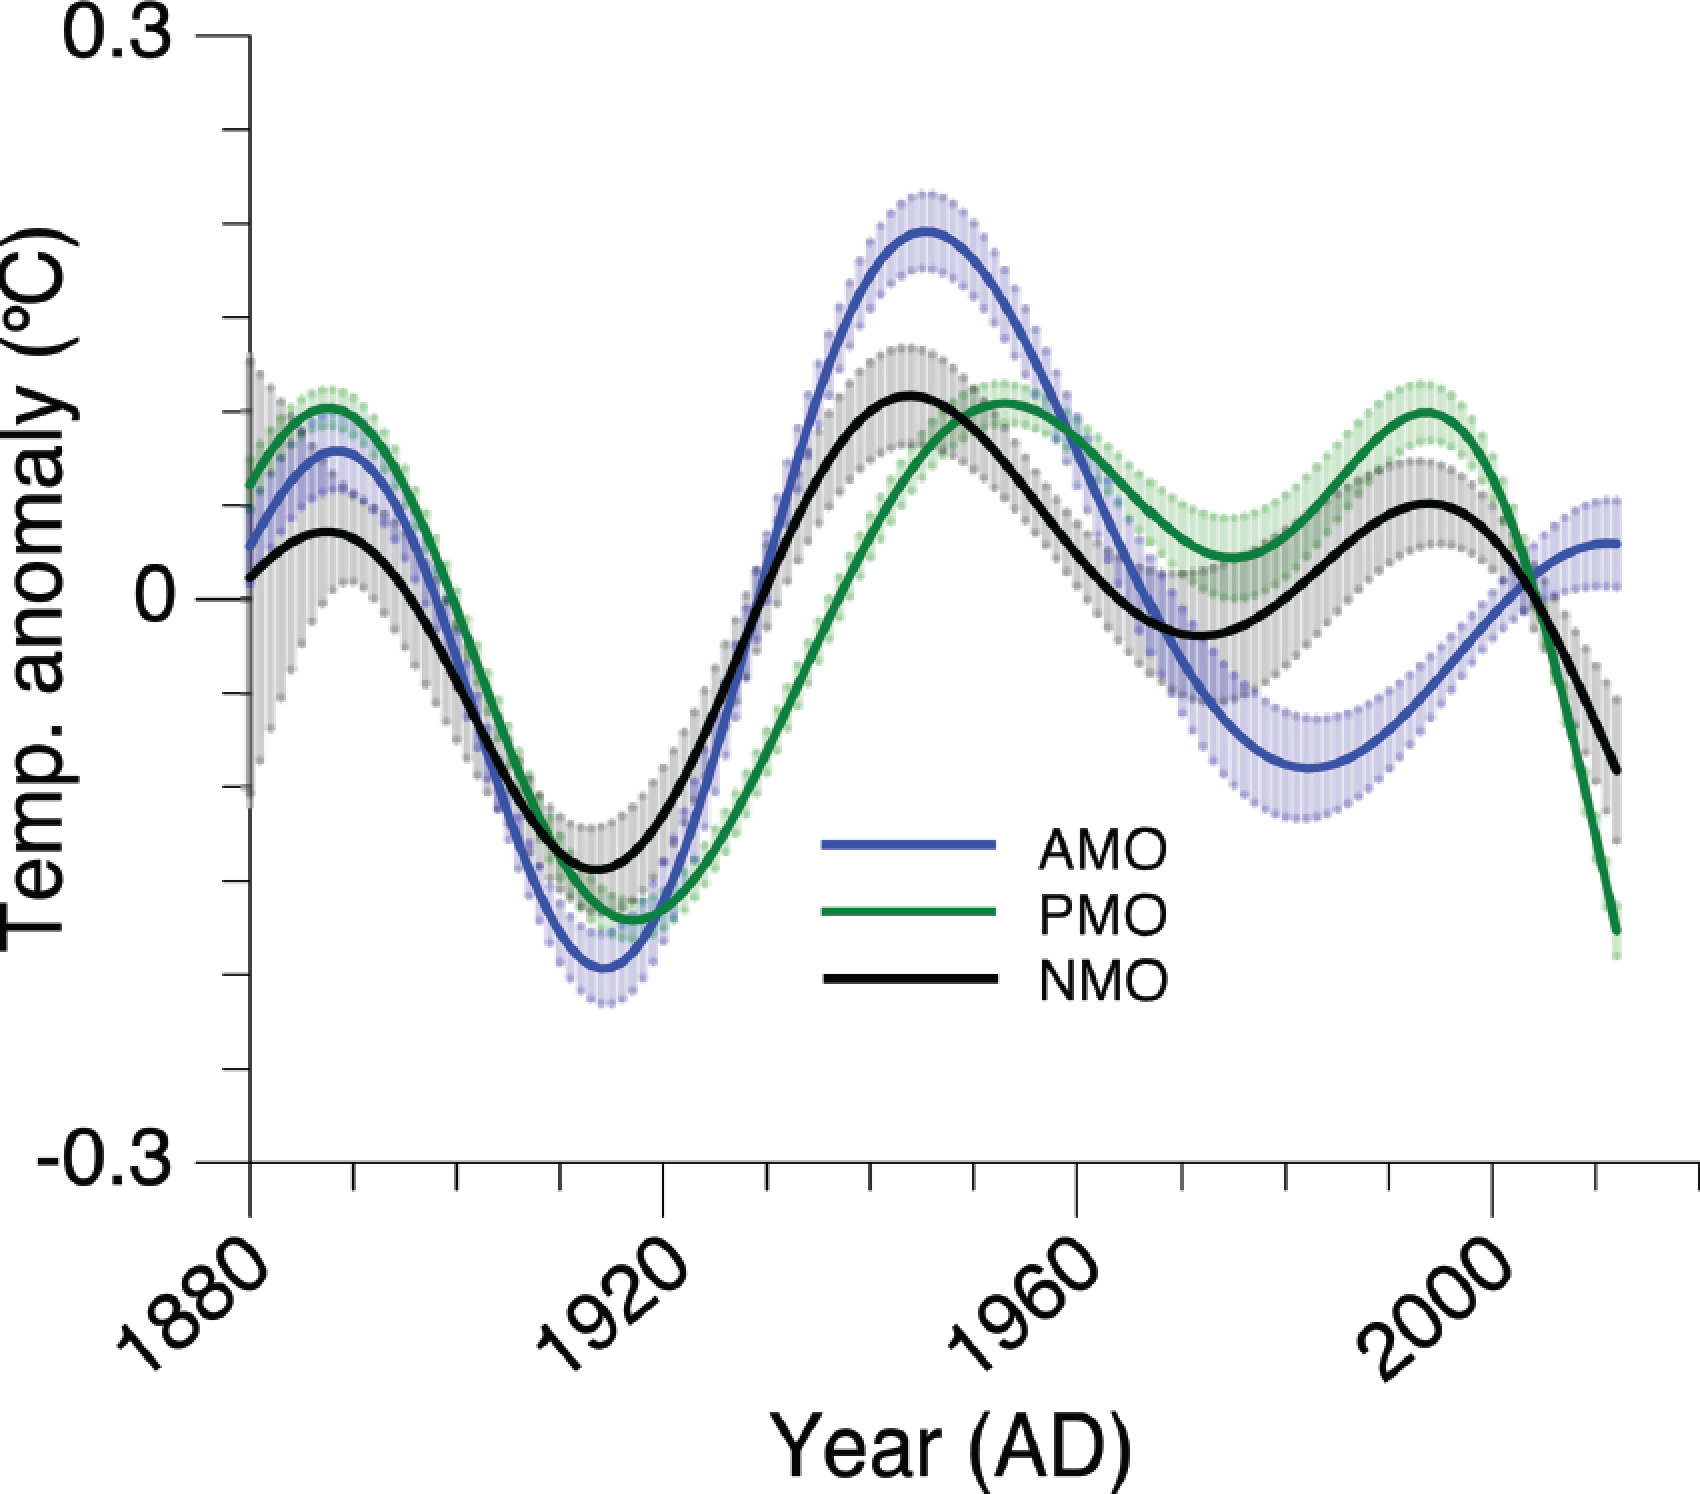
Estimated history of the “AMO” (blue), the “PMO (green) and the “NMO” (black). Uncertainties are indicated by shading. Note how the AMO (blue) has reached a shallow peak recently, while the PMO is plummeting quite dramatically. The latter accounts for the precipitous recent drop in the NMO.
Applying our method to the actual climate observations (see figure above) we find that the NMO is currently trending downward. In other words, the internal oscillatory component is currently offsetting some of the Northern Hemisphere warming that we would otherwise be experiencing. This finding expands upon our previous work coming to a similar conclusion, but in the current study we better pinpoint the source of the downturn. The much-vaunted AMO appears to have made relatively little contribution to large-scale temperature changes over the past couple decades. Its amplitude has been small, and it is currently relatively flat, approaching the crest of a very shallow upward peak. That contrasts with the PMO, which is trending sharply downward. It is that decline in the PMO (which is tied to the predominance of cold La Niña-like conditions in the tropical Pacific over the past decade) that appears responsible for the declining NMO, i.e. the slowdown in warming or “faux pause” as some have termed it.
Our conclusion that natural cooling in the Pacific is a principal contributor to the recent slowdown in large-scale warming is consistent with some other recent studies, including a study I commented on previously showing that stronger-than-normal winds in the tropical Pacific during the past decade have lead to increased upwelling of cold deep water in the eastern equatorial Pacific. Other work by Kevin Trenberth and John Fasullo of the National Center for Atmospheric Research (NCAR) shows that the there has been increased sub-surface heat burial in the Pacific ocean over this time frame, while yet another study by James Risbey and colleagues demonstrates that model simulations that most closely follow the observed sequence of El Niño and La Niña events over the past decade tend to reproduce the warming slowdown.
It is possible that the downturn in the PMO itself reflects a “dynamical response” of the climate to global warming. Indeed, I have suggested this possibility before. But the state-of-the-art climate model simulations analyzed in our current study suggest that this phenomenon is a manifestation of purely random, internal oscillations in the climate system.
This finding has potential ramifications for the climate changes we will see in the decades ahead. As we note in the last line of our article,
Given the pattern of past historical variation, this trend will likely reverse with internal variability, instead adding to anthropogenic warming in the coming decades.
That is perhaps the most worrying implication of our study, for it implies that the “false pause” may simply have been a cause for false complacency, when it comes to averting dangerous climate change.
The Soon fallacy
As many will have read, there were a number of press reports (NYT, Guardian, InsideClimate) about the non-disclosure of Willie Soon’s corporate funding (from Southern Company (an energy utility), Koch Industries, etc.) when publishing results in journals that require such disclosures. There are certainly some interesting questions to be asked (by the OIG!) about adherence to the Smithsonian’s ethics policies, and the propriety of Smithsonian managers accepting soft money with non-disclosure clauses attached.
However, a valid question is whether the science that arose from these funds is any good? It’s certainly conceivable that Soon’s work was too radical for standard federal research programs and that these energy companies were really taking a chance on blue-sky high risk research that might have the potential to shake things up. In such a case, someone might be tempted to overlook the ethical lapses and conflicts of interest for the sake of scientific advancement (though far too many similar post-hoc justifications have been used to excuse horrific unethical practices for this to be remotely defendable).
Unfortunately, the evidence from the emails and the work itself completely undermines that argument because the work and the motivation behind it are based on a scientific fallacy.
[Read more…] about The Soon fallacy
The mystery of the offset chronologies: Tree rings and the volcanic record of the 1st millennium
Guest commentary by Jonny McAneney
Volcanism can have an important impact on climate. When a large volcano erupts it can inject vast amounts of dust and sulphur compounds into the stratosphere, where they alter the radiation balance. While the suspended dust can temporarily block sunlight, the dominant effect in volcanic forcing is the sulphur, which combines with water to form sulphuric acid droplets. These stratospheric aerosols dramatically change the reflectivity, and absorption profile of the upper atmosphere, causing the stratosphere to heat, and the surface to cool; resulting in climatic changes on hemispheric and global scales.
Interrogating tree rings and ice cores
Annually-resolved ice core and tree-ring chronologies provide opportunities for understanding past volcanic forcing and the consequent climatic effects and impacts on human populations. It is common knowledge that you can tell the age of a tree by counting its rings, but it is also interesting to note that the size and physiology of each ring provides information on growing conditions when the ring formed. By constructing long tree ring chronologies, using suitable species of trees, it is possible to reconstruct a precisely-dated annual record of climatic conditions.
Ice cores can provide a similar annual record of the chemical and isotopic composition of the atmosphere, in particular volcanic markers such as layers of volcanic acid and tephra. However, ice cores can suffer from ambiguous layers that introduce errors into the dating of these layers of volcanic acid. To short-circuit this, attempts have been made to identify know historical eruptions within the ice records, such as Öraefajökull (1362) and Vesuvius (AD 79). This can become difficult since the ice chronologies can only be checked by finding and definitively identifying tephra (volcanic glass shards) that can be attributed to these key eruptions; sulphate peaks in the ice are not volcano specific.
Thus, it is fundamentally important to have chronological agreement between historical, tree-ring and ice core chronologies: The ice cores record the magnitude and frequency of volcanic eruptions, with the trees recording the climatic response, and historical records evidencing human responses to these events.
But they don’t quite line up…
[Read more…] about The mystery of the offset chronologies: Tree rings and the volcanic record of the 1st millennium
Noise on the Telegraph
I was surprised by the shrill headlines from a British newspaper with the old fashioned name the Telegraph: “The fiddling with temperature data is the biggest science scandal ever”. So what is this all about?