• Skip to primary navigation
  • Skip to main content
  • Skip to primary sidebar
  • Skip to footer

RealClimate

Climate science from climate scientists...

  • Start here
  • Model-Observation Comparisons
  • Miscellaneous Climate Graphics
  • Surface temperature graphics
You are here: Home / Archives for mike

mike

A Tale of Two Hockey Sticks

9 Aug 2021 by mike

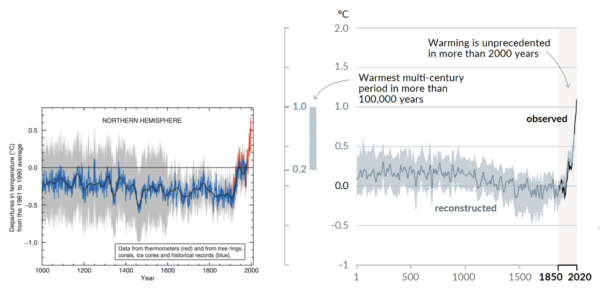
Two decades ago, the so-called “Hockey Stick” curve, published in 1999 by me and my co-authors (Mann, Bradley and Hughes, 1999), was featured in the all-important “Summary for Policy Makers” (SPM) of the 2001 IPCC Third Assessment report. The curve, which depicted temperature variations over the past 1000 years estimated from “proxy data such as tree rings, corals, ice cores, and lake sediments”, showed the upward spiking of modern temperatures (the “blade”) as it dramatically ascends, during the industrial era, upward from the “handle” that describes the modest, slightly downward steady trend that preceded it.

The Hockey Stick became an icon in the case for human-caused climate change, and I found myself at the center of the contentious climate debate (I’ve described my experiences in “The Hockey Stick and the Climate Wars”).

Featured two decades later now in the AR6 SPM is a longer Hockey Stick with an even sharper blade. And no longer just for the Northern Hemisphere, it now covers the whole globe. The recent warming is seen not only to be unprecedented over the past millennium, but tentatively, the past hundred millennia.

Side-by-side comparison of the (left) original Mann et al (1999) “Hockey Stick” reconstruction as featured in the Summary for Policy Makers of the IPCC 3rd Assessment report (2001) and the (right) longer, sharper “Hockey Stick” as featured in the Summary for Policy Makers of the IPCC 6th Assessment report (2021).

The relevant statements in the SPM and Technical Summary are:

A.2.2 Global surface temperature has increased faster since 1970 than in any other 50-year period over at least the last 2000 years (high confidence). Temperatures during the most recent decade (2011–2020) exceed those of the most recent multi-century warm period, around 6500 years ago13 [0.2°C to 1°C relative to 1850– 1900] (medium confidence). Prior to that, the next most recent warm period was about 125,000 years ago when the multi-century temperature [0.5°C to 1.5°C relative to 1850–1900] overlaps the observations of the most recent decade (medium confidence). {Cross-Chapter Box 2.1, 2.3, Cross-Section Box TS.1}

SPM AR6

Global surface temperature has increased by 1.09 [0.95 to 1.20] °C from 1850–1900 to 2011–2020, and the last decade was more likely than not warmer than any multi-centennial period after the Last Interglacial, roughly 125,000 years ago.

Cross Section Box TS.1

As the new IPCC report lays bare (you can find my full commentary about the new report at Time Magazine), we are engaged in a truly unprecedented and fundamentally dangerous experiment with our planet.

References

  1. M.E. Mann, R.S. Bradley, and M.K. Hughes, "Northern hemisphere temperatures during the past millennium: Inferences, uncertainties, and limitations", Geophysical Research Letters, vol. 26, pp. 759-762, 1999. http://dx.doi.org/10.1029/1999GL900070

Filed Under: Climate Science, Greenhouse gases, Instrumental Record, IPCC, Paleoclimate

The Rise and Fall of the “Atlantic Multidecadal Oscillation”

4 Mar 2021 by mike

Two decades ago, in an interview with science journalist Richard Kerr for the journal Science, I coined the term the “Atlantic Multidecadal Oscillation” (AMO) to describe an internal oscillation in the climate system resulting from interactions between North Atlantic ocean currents and wind patterns. These interactions were thought to lead to alternating decades-long intervals of warming and cooling centered in the extra-tropical North Atlantic that play out on 40-60 year timescales (hence the name). Think of the purported AMO as a much slower relative of the El Niño/Southern Oscillation (ENSO), with a longer timescale of oscillation (multidecadal rather than interannual) and centered in a different region (the North Atlantic rather than the tropical Pacific).

Today, in a research article published in the same journal Science, my colleagues and I have provided what we consider to be the most definitive evidence yet that the AMO doesn’t actually exist.

[Read more…] about The Rise and Fall of the “Atlantic Multidecadal Oscillation”

Filed Under: Climate modelling, Climate Science, Instrumental Record, Oceans

Climate Change and Extreme Summer Weather Events – The Future is still in Our Hands

31 Oct 2018 by mike


Summer 2018 saw an unprecedented spate of extreme weather events, from the floods in Japan, to the record heat waves across North America, Europe and Asia, to wildfires that threatened Greece and even parts of the Arctic. The heat and drought in the western U.S. culminated in the worst California wildfire on record. This is the face of climate change, I commented at the time.

Some of the connections with climate change here are pretty straightforward. One of the simplest relationships in all of atmospheric science tells us that the atmosphere holds exponentially more moisture as temperatures increase. Increased moisture means potentially for greater amounts of rainfall in short periods of time, i.e. worse floods. The same thermodynamic relationship, ironically, also explains why soils evaporate exponentially more moisture as ground temperatures increase, favoring more extreme drought in many regions. Summer heat waves increase in frequency and intensity with even modest (e.g. the observed roughly 2F) overall warming owing to the behavior of the positive “tail” of the bell curve when you shift the center of the curve even a small amount. Combine extreme heat and drought and you get more massive, faster-spreading wildfires. It’s not rocket science.

But there is more to the story. Because what made these events so devastating was not just the extreme nature of the meteorological episodes but their persistence. When a low-pressure center stalls and lingers over the same location for days at a time, you get record accumulation of rainfall and unprecedented flooding. That’s what happened with Hurricane Harvey last year and Hurricane Florence this year. It is also what happened with the floods in Japan earlier this summer and the record summer rainfall we experienced this summer here in Pennsylvania. Conversely, when a high-pressure center stalls over the same location, as happened in California, Europe, Asia and even up into the European Arctic this past summer, you get record heat, drought and wildfires.

Scientists such as Jennifer Francis have linked climate change to an increase in extreme weather events, especially during the winter season when the jet stream and “polar vortex” are relatively strong and energetic. The northern hemisphere jet stream owes its existence to the steep contrast in temperature in the middle latitudes (centered around 45N) between the warm equator and the cold Arctic. Since the Arctic is warming faster than the rest of the planet due to the melting of ice and other factors that amplify polar warming, that contrast is decreasing and the jet stream is getting slower. Just like a river traveling over gently sloping territory tends to exhibit wide meanders as it snakes its way toward the ocean, so too do the eastward-migrating wiggles in the jet stream (known as Rossby waves) tend to get larger in amplitude when the temperature contrast decreases. The larger the wiggles in the jet stream the more extreme the weather, with the peaks corresponding to high pressure at the surface and the troughs low pressure at the surface. The slower the jet stream, the longer these extremes in weather linger in the same locations, giving us more persistent weather extremes.

Something else happens in addition during summer, when the poleward temperature contrast is especially weak. The atmosphere can behave like a “wave guide”, trapping the shorter wavelength Rossby waves (those that that can fit 6 to 8 full wavelengths in a complete circuit around the Northern Hemisphere) to a relatively narrow range of latitudes centered in the mid-latitudes, preventing them from radiating energy away toward lower and higher latitudes. That allows the generally weak disturbances in this wavelength range to intensify through the physical process of resonance, yielding very large peaks and troughs at the sub-continental scale, i.e. unusually extreme regional weather anomalies. The phenomenon is known as Quasi-Resonant Amplification or “QRA”, and (see Figure below).

Many of the most damaging extreme summer weather events in recent decades have been associated with QRA, including the 2003 European heatwave, the 2010 Russian heatwave and wildfires and Pakistan floods (see below), and the 2011 Texas/Oklahoma droughts. More recent examples include the 2013 European floods, the 2015 California wildfires, the 2016 Alberta wildfires and, indeed, the unprecedented array of extreme summer weather events we witnessed this past summer.

The increase in the frequency of these events over time is seen to coincide with an index of Arctic amplification (the difference between warming in the Arctic and the rest of the Northern Hemisphere), suggestive of a connection (see Figure below).

Last year we (me and a team of collaborators including RealClimate colleague Stefan Rahmstorf) published an article in the Nature journal Scientific Reports demonstrating that the same pattern of amplified Arctic warming (“Arctic Amplification”) that is slowing down the jet stream is indeed also increasing the frequency of QRA episodes. That means regional weather extremes that persist longer during summer when the jet stream is already at its weakest. Based on an analysis of climate observations and historical climate simulations, we concluded that the “signal” of human influence on QRA has likely emerged from the “noise” of natural variability over the past decade and a half. In summer 2018, I would argue, that signal was no longer subtle. It played out in real time on our television screens and newspaper headlines in the form of an unprecedented hemisphere-wide pattern of extreme floods, droughts, heat waves and wildfires.

In a follow-up article just published in the AAAS journal Science Advances, we look at future projections of QRA using state-of-the-art climate model simulations. It is important to note that that one cannot directly analyze QRA behavior in a climate model simulation for technical reasons. Most climate models are run at grid resolutions of a degree in latitude or more. The physics that characterizes QRA behavior of Rossby Waves faces a stiff challenge when it comes to climate models because it involves the second mathematical derivative of the jet stream wind with respect to latitude. Errors increase dramatically when you calculate a numerical first derivative from gridded fields and even more so when you calculate a second derivative. Our calculations show that the critical term mentioned above suffers from an average climate model error of more than 300% relative to observations. By contrast, the average error of the models is less than a percent when it comes to latitudinal temperature averages and still only about 30% when it comes to the latitudinal derivative of temperature.

That last quantity is especially relevant because QRA events have been shown to have a well-defined signature in terms of the latitudinal variation in temperature in the lower atmosphere. Through a well-established meteorological relationship known as the thermal wind, the magnitude of the jet stream winds is in fact largely determined by the average of that quantity over the lower atmosphere. And as we have seen above, this quantity is well captured by the models (in large part because the change in temperature with latitude and how it responds to increasing greenhouse gas concentrations depends on physics that are well understood and well represented by the climate models).

These findings, incidentally have broader implications. First of all, climate model-based studies used to assess the degree to which current extreme weather events can be attributed to climate change are likely underestimating the climate change influence. One model-based study for example suggested that climate change only doubled the likelihood of the extreme European heat wave this summer. As I commented at the time, that estimate is likely too low for it doesn’t account for the role that we happen to know, in this case, that QRA played in that event. Similarly, climate models used to project future changes in extreme weather behavior likely underestimate the impact that future climate changes could have on the incidence of persistent summer weather extremes like those we witnessed this past summer.

So what does our study have to say about the future? We find that the incidence of QRA events would likely continue to increase at the same rate it has in recent decades if we continue to simply add carbon dioxide to the atmosphere. But there’s a catch: The future emissions scenarios used in making future climate projections must also account for factors other than greenhouse gases. Historically, for example, the use of old coal technology that predates the clean air acts produced sulphur dioxide gas which escapes into the atmosphere where it reacts with other atmospheric constituents to form what are known as aerosols.

These aerosols caused acid rain and other environmental problems in the U.S. before factories in the 1970s were required to install “scrubbers” to remove the sulphur dioxide before it leaves factory smokestacks. These aerosols also reflect incoming sunlight and so have a cooling effect on the surface in the industrial middle-latitudes where they are produced. Some countries, like China, are still engaged in the older, dirtier-form of coal burning. If we continue with business-as-usual burning of fossil fuels, but countries like China transition to more modern “cleaner” coal burning to avoid air pollution problems, we are likely to see a substantial drop in aerosols over the next half century. Such an assumption is made in the Intergovernmental Panel on Climate Change (IPCC)’s “RCP 8.5” scenario—basically, a “business as usual” future emissions scenario which results in more than a tripling of carbon dioxide concentrations relative to pre-industrial levels (280 parts per million) and roughly 4-5C (7-9F) of planetary warming by the end of the century.

As a result, the projected disappearance of cooling aerosols in the decades ahead produces an especially large amount of warming in middle-latitudes in summer (when there is the most incoming sunlight to begin with, and, thus, the most sunlight to reflect back to space). Averaged across the various IPCC climate models there is even more warming in mid-latitudes than in the Arctic—in other words, the opposite of Arctic Amplification i.e. Arctic De-amplification (see Figure below). Later in the century after the aerosols disappear greenhouse warming once again dominates and we again see an increase in QRA events.

So, is there any hope to avoid future summers like the summer of 2018? Probably not. But in the scenario where we rapidly move away from fossil fuels and stabilize greenhouse gas concentrations below 450 parts per million, giving us a roughly 50% chance of averting 2C/3.6F planetary warming (the so-called “RCP 2.6” IPCC scenario) we find that the frequency of QRA events remains roughly constant at current levels.

While we will presumably have to contend with many more summers like 2018 in the future, we could likely prevent any further increase in persistent summer weather extremes. In other words, the future is still very much in our hands when it comes to dangerous and damaging summer weather extremes. It’s simply a matter of our willpower to transition quickly from fossil fuels to renewable energy.

Filed Under: Aerosols, Arctic and Antarctic, Climate impacts, Climate Science, Greenhouse gases, heatwaves Tagged With: aerosols, Arctic amplification, climate change, greenhouse warming, weather extremes

Pre-industrial anthropogenic CO2 emissions: How large?

11 Oct 2018 by mike

Guest article by William Ruddiman

Fifteen years after publication of Ruddiman (2003), the early anthropogenic hypothesis is still debated, with relevant evidence from many disciplines continuing to emerge. Recent findings summarized here lend support to the claim that greenhouse-gas emissions from early agriculture (before 1850) were large enough to alter atmospheric composition and global climate substantially.

Marine isotopic stage (MIS) 19 is the closest orbital analog to the current MIS 1 interglaciation (Tzedakis et al., 2012), with similarly small changes in precession (εsinω) and nearly synchronous peaks in sin and obliquity (Fig. 1a, b). MIS 11 was once claimed to be the closest MIS 1 analog (for example, Broecker and Stocker, 2006), but that claim is now rejected because obliquity and precession peaks in MIS 11 were far offset.


Figure 1 Comparison of (a) obliquity and (b) precession (εsinω) trends during MIS19, (green), MIS11 (black) and MIS1 (red). Based on Tzedakis et al. (2012). (c) CO2 trends during MIS19 (black) and MIS1 (red). CO2 data for MIS 19 are from Dome C (Bereiter et al. 2015). CO2 data for MIS 1 are from Law Dome (MacFarling Meure et al. 2006) and Dome C (Monnin et al. 2001, 2004) for MIS1.


With MIS 11 eliminated as an analog, the focus is on MIS 19. The CO2 signals early in MIS 1 and MIS 19 (Fig. 1c) reached nearly identical peaks of 270 and 269 ppm, after which the MIS 1 value fell for 4000 years but then rose by 20 ppm to a late pre-industrial 280-285 ppm. In contrast, the MIS 19 CO2 trend continued downward for more than 10,000 years to 245-250 ppm by the time equivalent to the present day. This value is consistent with the 240-245 ppm level proposed in the early anthropogenic hypothesis for a natural Holocene world (with no human overprint). The 35-ppm difference between the two interglaciations is close to the 40-ppm Holocene anomaly inferred by Ruddiman (2003).

A GCM simulation of the MIS 19 time equivalent to today by Vavrus et al. (2018) indicates that the low CO2 values would have caused year-round snow cover (indicative of incipient glaciation) in the Canadian Archipelago and over Baffin Island (an area roughly the size of Greenland), as well as other Arctic regions (see also Ganopolski et al., 2014).

Ruddiman (2003) estimated pre-industrial carbon emissions of 300-320 Gt, based on a back-of-the-envelope compilation of the incomplete forest clearance histories then available (Table 1). [One Gt is one billion tons]. That estimate was for a while rejected as too high by a factor of 5 to 10 (Joos et al., 2004; Pongratz et al., 2008; Stocker et al., 2011. However, Kaplan et al. (2011) found that those estimates had been biased downward because they assumed much smaller early per-capita clearance than the large amounts shown by actual historical data. Those estimates also ignored areas that had been cleared and were not in active agricultural use, but had not yet reforested. Adjusting for these factors, Kaplan and colleagues estimated pre-industrial emissions of 343 GtC.

Erb et al. (2017) averaged 7 estimates of the amount of carbon that would currently be stored in Earth’s potential natural vegetation had there been no human activities (910 GtC) compared to the 460 GtC carbon actually stored there today. They attributed the difference of 450 GtC to cumulative vegetation removal by humans (mostly deforestation). With ~140 GtC of clearance having occurred during the industrial era, that left an estimated 310 GtC as the total removed and emitted to the atmosphere during pre-industrial time. In a similar analysis, Lorenz and Lal (2018) estimated pre-industrial carbon emissions of ‘up to’ 357 GtC.

Studies in other disciplines have begun adding direct ground-truth evidence about early clearance. Analyses of pollen in hundreds of European lake cores (Fyfe et al., 2014; Roberts et al, 2018) show that forest vegetation began to decrease after 6000 years ago and reached near-modern levels before the start of the industrial era (Fig. 2). In China, compilations of over 50,000 archaeological sites by Li et al. (2009) and Hosner et al. (2016) show major increases of farming settlements in previously forested areas beginning 7,000 years ago. These extensive compilations support the above estimates of large early anthropogenic clearance and C emissions.


Figure 2. Evidence of early forest clearance in Europe. (A) Locations of cores in the European pollen database. Cores used for pollen summary in B are shown in red (Fyfe et al., 2015). (B) Changes in forest, open, and semi-open (mixed forest and open) vegetation plotted as ‘pseudobiome’ sums.


As this wide-ranging multi-disciplinary evidence has emerged, some scientists continue to reject the early anthropogenic hypothesis. Most of the opposition is based on a geochemical index (δ13CO2) measured in CO2 contained in air bubbles trapped in ice cores. The δ13CO2 index shows the relative balance through time between the amount of 12C-rich terrestrial carbon from the land and 13C-neutral carbon from the ocean. The small 13C decrease in atmospheric CO2 during the last 7000 years has been interpreted as indicating minimal input of 12C-rich terrestrial carbon during that time (Broecker and Stocker, 2006; Elsig et al., 2009). In a July 20, 2018 Scienceonline.org post, Jeff Severinghaus estimated the early human contribution to the observed CO2 rise as “1 to 2 ppm at the most”, or just 5-10% of the recent estimates reviewed in Table 1.

Other scientists (Stocker et al., 2018; Ruddiman et al., 2016) have pointed out that the δ13CO2 index cannot be used to isolate the amount of deforestation carbon unless all significant carbon sources and sinks are well constrained. The compilation by Yu (2011) indicating that ~300 Gt of terrestrial (12C-rich) carbon were buried in boreal peats during the last 7000 years shows that this constraint had not been satisfied in previous studies. Burial of ~300 GtC in boreal peats requires a counter-balancing emission of more than 300 GtC of terrestrial carbon during the last 7000 years, and the discussion above summarizes evidence that pre-industrial deforestation can fill that deficit. Even now, however, carbon exchanges (whether sources or sinks) in non-peat permafrost areas and in river floodplains and deltas during the last 7000 years remain poorly known.

Scientists trying to make up their minds about this still-ongoing debate can now weigh wide-ranging multi-disciplinary evidence for large early forest clearance against reliance on the as-yet poorly constrained δ13CO2 index.

References

Bereiter, B., S. Eggleston, J. Schmitt, C. Nehrbass-Ahles, T. F. Stocker, et al. (2015), Revision of the EPICA Dome C CO2 record from 800 to 600 kyr before present, Geophys. Res. Lett., 42, 542–549.

Broecker, W. S. and T. L. Stocker (2006), The Holocene CO2 rise: Anthropogenic or natural? EOS Trans. Amer. Geophysical Union 87, 27.

Erb, K.-H., T. Kastner, C. Plutzar, C., A. L. S Bais, N. Carvalhai., et al. (2018), Unexpectedly large impact of forest management on global vegetation biomass. Nature 553, 73-76.

Elsig J., J. Schmitt, D. Leuenberger, R. Schneider, M. Eyer, et al. (2009), Stable isotope constraints on Holocene carbon cycle changes from an Antarctic ice core. Nature 461, 507-510.

Fyfe, R. M., J. Woodbridge, and N. Roberts (2015), From forest to farmland: pollen-inferred land cover changes across Europe using the pseudobiomization approach. Global Change Biology 20, 1197-1212.

Ganopolski, A., R. Winkelmann and H. J. Schellenhuber, (2014), Critical insolation-CO2 relation for diagnosing past and future glacial inception. Nature 529, 200-203.

Hosner, D., M. Wagner, P. E. Tarasov, X. Chen, and C. Leipe (2016), Spatiotemporal distribution patterns of archaeological sites in China during the Neolithic and Bronze Age: An overview. The Holocene 26, 1576-1583.

Joos F, Gerber S, Prentice IC, et al. (2004) Transient simulations of Holocene atmospheric carbon dioxide and terrestrial carbon since the last glacial maximum. Global Biogeochemical Cycles 18. DOI: 10.1029/2003GB002156.

Kaplan J. O, K. M. Krumhardt, E. C. Ellis, W. F. Ruddiman, C. Lemmen, et al. Goldewijk (2011), Holocene carbon emissions as a result of anthropogenic land cover change. The Holocene 21, 775-792.

Li, X., J. Dodson, J. Zhou, and X. Zhou (2008), Increases of population and expansion of rice agriculture in Asia, and anthropogenic methane emissions since 5000 BP. Quat. Int. 202, 41-50.

Lorenz, K. and R. Lal (2018), Agricultural land use and the global carbon cycle. In: Carbon sequestration in agricultural systems, p. 1-37.

MacFarling Meure, C., D. Etheridge, C. Trudinger, P. Steele, R. Langenfelds, et al. (2006), Law Dome CO2, CH4 and N2O ice core records extended to 2000 years BP. Geophys. Res. Lett., 33, L14810, doi:10.1029/2006GL026152.

Monnin E., A. Indermühle, A. Dällenbach, J. Flückinger, B. Stauffer, et al. (2001), Atmospheric CO¬¬2 concentrations over the Last Glacial Termination. Science, 291, 112-114.

Pongratz, J., C. Reick, T. Raddatz, and M. A. Claussen (2008), A reconstruction of global agricultural areas and land cover for the last millennium. Global Geochemical Cycles 22, GB3018m doi:10.1029/2008GLO36394.

Roberts N, R. M. Fyfe, J. Woodbridge, et al. (2018), Europe’s forests: A pollen-based synthesis for the last 11,000 years. Nature Scientific Reports. DOI: 10.1038/s41598-017-18646-7
Ruddiman, W. F. (2003), The anthropogenic greenhouse era began thousands of years ago. Climatic Change 61, 261-293.

Ruddiman, W. F., D. Q. Fuller, J. E Kutzbach, P. C. Tzedakis, J. O. Kaplan et al. (2016), Late Holocene climate: Natural or anthropogenic? Rev. of Geophys. 54, 93-118.

Stocker, B. D., K. Strassmann, and F. Joos (2011), Sensitivity of Holocene atmospheric CO2 and the modern carbon budget to early human land use: analyses with a process-base model. Biogeosciences 8, 69-88.

Stocker, B.D., Z. Yu, and F. Joos (2018), Constraining CO2 emissions from different Holocene land-use histories: does the carbon budget add up? PAGES 26, 6-7.

Tzedakis, P. C., J. E. T. Channell, D. A. Hodell, H. F. Kleiven, and L. K. Skinner (2012), Determining the length of the current interglacial. Nature Geoscience 5, 138-141.

Vavrus, S. J., F. He, J. E. Kutzbach, W. F. Ruddiman, and P. C. Tzedakis (2018), Glacial inception in marine isotope stage 19: An orbital analog for a
natural Holocene. Nature Scientific Reports 81, doi:10.1038/s41598-018-28419-5.

Filed Under: Carbon cycle, Climate Science, Greenhouse gases, Paleoclimate Tagged With: co2, early anthropocene, greenhouse gases

Boomerangs versus Javelins: The Impact of Polarization on Climate Change Communication

7 Jun 2016 by mike

Guest commentary by Jack Zhou, Nicholas School of the Environment, Duke University

For advocates of climate change action, communication on the issue has often meant “finding the right message” that will spur their audience to action and convince skeptics to change their minds. This is the notion that simply connecting climate change to the right issue domains or symbols will cut through the political gridlock on the issue. The difficulty then lies with finding these magic bullet messages, figuring out if they talk about climate change in the context of with national security or polar bears or passing down a clean environment to future generations.

On highly polarized issues like climate change, however, communicating across the aisle may be more difficult than simply finding the right message. Here, the worst case scenario is not simply a message failing to land and sending you back to the drawing board. Instead, any message that your audience disagrees with may polarize that audience even further in their skepticism, leaving you in a worse position than you began. As climate change has become an increasingly partisan issue in American politics, this means that convincing Republicans to reject the party line of climate skepticism may be easier said than done.
[Read more…] about Boomerangs versus Javelins: The Impact of Polarization on Climate Change Communication

Filed Under: Climate Science

The Early Anthropocene Hypothesis: An Update

15 Mar 2016 by mike

Guest post from Bill Ruddiman, University of Virginia

For over a decade, paleoclimate scientists have argued whether the warmth of the last several thousand years was natural or anthropogenic. This brief comment updates that debate, also discussed earlier at RC: Debate over the Early Anthropogenic Hypothesis (2005) and An Emerging View on Early Land Use (2011). The graph below outlines the evolution of that debate through 4 phases.

RuddimanFigure

In phase 1 (the 1900’s), scientists viewed Holocene climate change as driven only by natural causes until the industrial era began. But by the late 1990’s, ice core data revealed late Holocene GHG rises unlike trends in previous interglaciations. Two hypotheses proposed natural causes for the CO2 increase: carbonate compensation (Broecker et al., 1999, 2001) and coral-reef construction (Ridgewell et al., 2003).

In phase 2 (2001-2003), the early anthropogenic hypothesis (EAH) challenged natural explanations for the anomalous late Holocene CO2 (and CH4) rises, attributing them to the spread of early agriculture thousands of years ago.

In phase 3 (2004-2008), several arguments were advanced against the EAH:
* too few people lived millennia ago to have had a significant influence on land clearance, GHG emissions and climate;
* a (proposed) interglacial stage 11 analog for the Holocene suggested that thousands of years of natural warmth still remain in the current interglaciation;
* the weak decrease in ice core δ13CO2 during the last 7000 years did not permit extensive deforestation which would have released abundant 12C -rich carbon.
Papers by myself, my co-authors at Wisconsin, and others during phase 3 rebutted some of these criticisms, but community opinion remained divided.

Phase 4 (2009-2016) has seen a major shift in viewpoint of published papers: 30 papers favor aspects of the EAH, 6 papers oppose it, and 5 are in the middle. Most of the phase 4 papers that oppose the hypothesis or are ‘in the middle’ are based on modeling studies. Many of the 30 supporting papers are broad-scale compilations of archaeological and paleoecological evidence:
* The average GHG trends from 7 previous interglaciations show CO2 and CH4 decreases, in contrast to the late Holocene increases;
* Interglacial stage 19, the closest Holocene analog, shows decreases in CH4 and CO2, and the CO2 decrease closely matches the 2003 EAH prediction;
* CH4 emissions from Asian rice paddies account for 70% of the observed CH4 rise from 5000 to 1000 years ago
* historical data show that early per-capita land use was at least 4 times larger than assumed in several phase-3 land use simulations
* a recent land use simulation based on historical evidence accounts for more than half the CO2 anomaly originally proposed in the EAH;
* pollen evidence shows nearly complete deforestation in north-central Europe before the industrial era began;
* δD and δ18O trends show anomalous late Holocene warmth compared to cooling trends in prior interglaciations, in agreement with A-OGCM simulations of the warming effect of the anthropogenic CO2 and CH4 trends.

_____________
Anyone seeking more detail on this issue should contact pisgahill@gmail.com for pdf copies of the recent 2016 Ruddiman et al. paper in Reviews of Geophysics and an invited paper just submitted to Oxford University Press that summarizes the history of this debate, with full references to the papers shown in the table.

Filed Under: Climate Science

How Likely Is The Observed Recent Warmth?

25 Jan 2016 by mike

With the official numbers now in 2015 is, by a substantial margin, the new record-holder, the warmest year in recorded history for both the globe and the Northern Hemisphere. The title was sadly short-lived for previous record-holder 2014. And 2016 could be yet warmer if the current global warmth persists through the year.

One might well wonder: just how likely is it that we would be seeing these sort of streaks of record-breaking temperatures if not for human-caused warming of the planet?

Precisely that question was posed by several media organizations a year ago, in the wake of the then-record 2014 temperatures. Various press accounts reported odds anywhere from 1-in-27 million to 1-in-650 million that the observed run of global temperature records (9 of the 10 warmest years and 13 of the 15 warmest years each having had occurred since 2000) might have resulted from chance alone, i.e. without any assistance from human-caused global warming.

My colleagues and I suspected the odds quoted were way too slim. The problem is that each year was treated as though it were statistically independent of neighboring years (i.e. that each year is uncorrelated with the year before it or after it), but that’s just not true. Temperatures don’t vary erratically from one year to the next. Natural variations in temperature wax and wane over a period of several years. [Read more…] about How Likely Is The Observed Recent Warmth?

Filed Under: Climate Science

An Online University Course on the Science of Climate Science Denial

22 Apr 2015 by mike

Guest post from John Cook, University of Queensland

For many years, RealClimate has been educating the public about climate science. The value of climate scientists patiently explaining the science and rebutting misinformation directly with the public cannot be overestimated. When I began investigating this issue, my initial searches led me here, which was invaluable in increasing my understanding of our climate and making sense of misinformation. RealClimate has inspired and empowered a host of climate communicators such as myself to step forward and help make climate science more accessible to the general public.

To further the work of educating the public, and empowering people to communicate the realities of climate change, the Skeptical Science team has collaborated with The University of Queensland to develop a MOOC, Making Sense of Climate Science Denial. MOOC stands for Massive (we’ve already had thousands of students sign up from over 130 countries) Open (available for free to everyone) Online (web-based, no software required) Course.

The course examines the science of climate science denial. Why do a small but vocal minority reject the scientific evidence for climate change? What techniques do they use to cast doubt on the science? And we examine the all-important question – based on scientific research, how should we respond to science denial?

Several strands of research in cognitive psychology, educational research and a branch of psychology called “inoculation theory” all point the way to neutralising the influence of science denial. The approach is two-fold: communicate the science but also explain how that science can be distorted.

So our course looks at the most common climate myths you’re likely to encounter online or in the media. We examine myths casting doubt on the reality of global warming. We explore the many human fingerprints on climate change. We look at the messages from past climate change and what climate models tell us about the future. And we look at how climate change is impacting every part of society and the environment. As we examine myths touching on all these parts of climate science, we shine the spotlight on the fallacies and techniques used to distort the science.

FLICC

As well as our short video lectures debunking climate myths, we also interviewed many of the world’s leading scientists. I had the privilege to speak to Ben Santer, Katharine Hayhoe, Richard Alley, Phil Jones, Naomi Oreskes and let’s not forget my long, fascinating conversation with Michael Mann. I was also lucky enough to interview Sir David Attenborough at the Great Barrier Reef. We spoke to both climate scientists and social scientists who study the psychology of climate science denial. Some of the most powerful moments from those interviews came when the scientists described the attacks they’d personally experienced because of their climate research:

Our MOOC starts next Tuesday, April 28. It’s a free online course hosted by the not-for-profit edX (founded by Harvard University & MIT). It runs for 7 weeks, requiring 1 to 2 hours per week. You can enroll at http://edx.org/understanding-climate-denial.

Filed Under: Climate Science

A Scientific Debate

13 Apr 2015 by mike

Guest posting from Bill Ruddiman, University of Virginia

Recently I’ve read claims that some scientists are opposed to AGW but won’t speak out because they fear censure from a nearly monolithic community intent on imposing a mainstream view. Yet my last 10 years of personal experience refute this claim. This story began late in 2003 when I introduced a new idea (the ‘early anthropogenic hypothesis’) that went completely against a prevailing climatic paradigm of the time. I claimed that detectable human influences on Earth’s surface and its climate began thousands of years ago because of agriculture. Here I describe how this radically different idea was received by the mainstream scientific community.

Was my initial attempt to present this new idea suppressed? No. I submitted a paper to Climatic Change, then edited by Steve Schneider, a well-known climate scientist and AGW spokesman. From what I could tell, Steve was agnostic about my idea but published it because he found it an interesting challenge to the conventional wisdom. I also gave the Emiliani lecture at the 2003 December American Geophysical Union (AGU) conference to some 800 people. I feel certain that very few of those scientists came to my talk believing what my abstract claimed. They attended because they were interested in a really new idea from someone with a decent career reputation. The talk was covered by many prominent media sources, including the New York Times and The Economist. This experience told me that provocative new ideas draw interest because they are provocative and new, provided that they pass the key ‘sniff test’ by presenting evidence in support of their claims.

Did this radical new idea have difficulty receiving research funding? No. Proposals submitted to the highly competitive National Science Foundation (NSF) with John Kutzbach and Steve Vavrus have been fully funded since 2004 by 3-year grants. Even though the hypothesis of early anthropogenic effects on climate has been controversial (and still is for some), we crafted proposals that were carefully written, tightly reasoned, and focused on testing the new idea. As a result, we succeeded against negative funding odds of 4-1 or 5-1. One program manager told me he planned to put our grant on a short list of ‘transformational’ proposals/grants that NSF had requested. That didn’t mean he accepted our hypothesis. It meant that he felt that our hypothesis had the potential to transform that particular field of paleoclimatic research, if proven correct.

Were we able to get papers published? Yes. As any scientist will tell you, this process is rarely easy. Even reviewers who basically support what you have to say will rarely hand out ‘easy-pass’ reviews. They add their own perspective, and they often point out useful improvements. A few reviews of the 30-some papers we have published during the last 11 years have come back with extremely negative reviews, seemingly from scientists who seem deeply opposed to anything that even hints at large early anthropogenic effects. While these uber-critical reviews are discouraging, I have learned to put them aside for a few days, give my spirits time to rebound, and then address the criticisms that are fair (that is, evidence-based), explain to the journal editor why other criticisms are unfair, and submit a revised (and inevitably improved) paper. Eventually, our views have always gotten published, although sometimes only after considerable effort.

The decade-long argument over large early anthropogenic effects continues, although recent syntheses of archeological and paleoecological data have been increasingly supportive. In any case, I continue to trust the scientific process to sort this debate out. I suggest that my experience is a good index of the way the system actually operates when new and controversial ideas emerge. I see no evidence that the system is muffling good new ideas.

Filed Under: Climate Science

Climate Oscillations and the Global Warming Faux Pause

26 Feb 2015 by mike

No, climate change is not experiencing a hiatus. No, there is not currently a “pause” in global warming.

Despite widespread such claims in contrarian circles, human-caused warming of the globe proceeds unabated. Indeed, the most recent year (2014) was likely the warmest year on record.

It is true that Earth’s surface warmed a bit less than models predicted it to over the past decade-and-a-half or so. This doesn’t mean that the models are flawed. Instead, it points to a discrepancy that likely arose from a combination of three main factors (see the discussion my piece last year in Scientific American). These factors include the likely underestimation of the actual warming that has occurred, due to gaps in the observational data. Secondly, scientists have failed to include in model simulations some natural factors (low-level but persistent volcanic eruptions and a small dip in solar output) that had a slight cooling influence on Earth’s climate. Finally, there is the possibility that internal, natural oscillations in temperature may have masked some surface warming in recent decades, much as an outbreak of Arctic air can mask the seasonal warming of spring during a late season cold snap. One could call it a global warming “speed bump”. In fact, I have.

Some have argued that these oscillations contributed substantially to the warming of the globe in recent decades. In an article my colleagues Byron Steinman, Sonya Miller and I have in the latest issue of Science magazine, we show that internal climate variability instead partially offset global warming.

We focused on the Northern Hemisphere and the role played by two climate oscillations known as the Atlantic Multidecadal Oscillation or “AMO” (a term I coined back in 2000, as recounted in my book The Hockey Stick and the Climate Wars) and the so-called Pacific Decadal Oscillation or “PDO” (we a use a slightly different term–Pacific Multidecadal Oscillation or “PMO” to refer to the longer-term features of this apparent oscillation). The oscillation in Northern Hemisphere average temperatures (which we term the Northern Hemisphere Multidecadal Oscillation or “NMO”) is found to result from a combination of the AMO and PMO.

In numerous previous studies, these oscillations have been linked to everything from global warming, to drought in the Sahel region of Africa, to increased Atlantic hurricane activity. In our article, we show that the methods used in most if not all of these previous studies have been flawed. They fail to give the correct answer when applied to a situation (a climate model simulation) where the true answer is known.

We propose and test an alternative method for identifying these oscillations, which makes use of the climate simulations used in the most recent IPCC report (the so-called “CMIP5” simulations). These simulations are used to estimate the component of temperature changes due to increasing greenhouse gas concentrations and other human impacts plus the effects of volcanic eruptions and observed changes in solar output. When all those influences are removed, the only thing remaining should be internal oscillations. We show that our method gives the correct answer when tested with climate model simulations.

2015-02-12-Sci15FigHuffPost.png
Estimated history of the “AMO” (blue), the “PMO (green) and the “NMO” (black). Uncertainties are indicated by shading. Note how the AMO (blue) has reached a shallow peak recently, while the PMO is plummeting quite dramatically. The latter accounts for the precipitous recent drop in the NMO.

Applying our method to the actual climate observations (see figure above) we find that the NMO is currently trending downward. In other words, the internal oscillatory component is currently offsetting some of the Northern Hemisphere warming that we would otherwise be experiencing. This finding expands upon our previous work coming to a similar conclusion, but in the current study we better pinpoint the source of the downturn. The much-vaunted AMO appears to have made relatively little contribution to large-scale temperature changes over the past couple decades. Its amplitude has been small, and it is currently relatively flat, approaching the crest of a very shallow upward peak. That contrasts with the PMO, which is trending sharply downward. It is that decline in the PMO (which is tied to the predominance of cold La Niña-like conditions in the tropical Pacific over the past decade) that appears responsible for the declining NMO, i.e. the slowdown in warming or “faux pause” as some have termed it.

Our conclusion that natural cooling in the Pacific is a principal contributor to the recent slowdown in large-scale warming is consistent with some other recent studies, including a study I commented on previously showing that stronger-than-normal winds in the tropical Pacific during the past decade have lead to increased upwelling of cold deep water in the eastern equatorial Pacific. Other work by Kevin Trenberth and John Fasullo of the National Center for Atmospheric Research (NCAR) shows that the there has been increased sub-surface heat burial in the Pacific ocean over this time frame, while yet another study by James Risbey and colleagues demonstrates that model simulations that most closely follow the observed sequence of El Niño and La Niña events over the past decade tend to reproduce the warming slowdown.

It is possible that the downturn in the PMO itself reflects a “dynamical response” of the climate to global warming. Indeed, I have suggested this possibility before. But the state-of-the-art climate model simulations analyzed in our current study suggest that this phenomenon is a manifestation of purely random, internal oscillations in the climate system.

This finding has potential ramifications for the climate changes we will see in the decades ahead. As we note in the last line of our article,

Given the pattern of past historical variation, this trend will likely reverse with internal variability, instead adding to anthropogenic warming in the coming decades.

That is perhaps the most worrying implication of our study, for it implies that the “false pause” may simply have been a cause for false complacency, when it comes to averting dangerous climate change.

Filed Under: Climate Science

  • Page 1
  • Page 2
  • Page 3
  • Interim pages omitted …
  • Page 5
  • Go to Next Page »

Primary Sidebar

Search

Search for:

Email Notification

get new posts sent to you automatically (free)
Loading

Recent Posts

  • Unforced variations: May 2025
  • Unforced Variations: Apr 2025
  • WMO: Update on 2023/4 Anomalies
  • Andean glaciers have shrunk more than ever before in the entire Holocene
  • Climate change in Africa
  • We need NOAA now more than ever

Our Books

Book covers
This list of books since 2005 (in reverse chronological order) that we have been involved in, accompanied by the publisher’s official description, and some comments of independent reviewers of the work.
All Books >>

Recent Comments

  • Tomáš Kalisz on Unforced variations: May 2025
  • Secular Animist on Unforced variations: May 2025
  • Secular Animist on Unforced variations: May 2025
  • Barry E Finch on Unforced variations: May 2025
  • Radge Havers on Unforced variations: May 2025
  • Barton Paul Levenson on Unforced variations: May 2025
  • jgnfld on Unforced variations: May 2025
  • jgnfld on Unforced variations: May 2025
  • zebra on Unforced variations: May 2025
  • Thessalonia on Unforced variations: May 2025
  • Mr. Know It All on Unforced variations: May 2025
  • Mr. Know It All on Unforced variations: May 2025
  • Mr. Know It All on Unforced variations: May 2025
  • Pedro Prieto on Unforced variations: May 2025
  • Pedro Prieto on Unforced variations: May 2025
  • Nigelj on Unforced variations: May 2025
  • Piotr on Unforced variations: May 2025
  • Piotr on Unforced variations: May 2025
  • Killian on Unforced variations: May 2025
  • Killian on Unforced variations: May 2025

Footer

ABOUT

  • About
  • Translations
  • Privacy Policy
  • Contact Page
  • Login

DATA AND GRAPHICS

  • Data Sources
  • Model-Observation Comparisons
  • Surface temperature graphics
  • Miscellaneous Climate Graphics

INDEX

  • Acronym index
  • Index
  • Archives
  • Contributors

Realclimate Stats

1,364 posts

11 pages

242,921 comments

Copyright © 2025 · RealClimate is a commentary site on climate science by working climate scientists for the interested public and journalists.