This month’s open thread for climate topics. Has anyone noticed how warm it’s been? Someone should probably look into that…
heatwaves
What is happening in the Atlantic Ocean to the AMOC?
For various reasons I’m motivated to provide an update on my current thinking regarding the slowdown and tipping point of the Atlantic Meridional Overturning Circulation (AMOC). I attended a two-day AMOC session at the IUGG Conference the week before last, there’s been interesting new papers, and in the light of that I have been changing my views somewhat. Here’s ten points, starting from the very basics, so you can easily jump to the aspects that interest you.
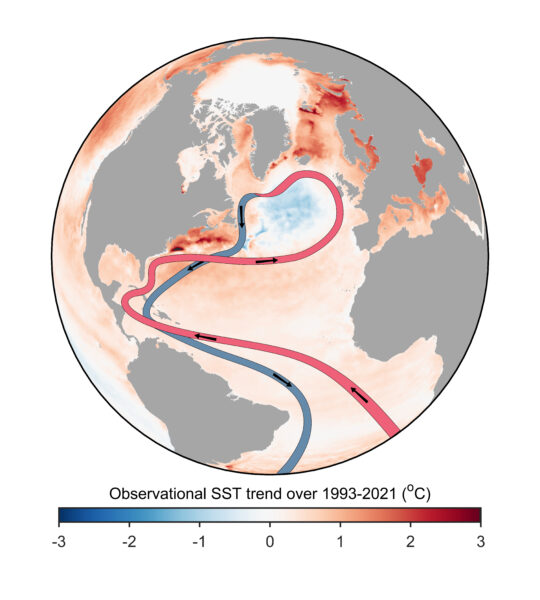
1. The AMOC is a big deal for climate. The Atlantic meridional overturning circulation (AMOC) is a large-scale overturning motion of the entire Atlantic, from the Southern Ocean to the high north. It moves around 15 million cubic meters of water per second (i.e. 15 Sverdrup). The AMOC water passes through the Gulf Stream along a part of its much longer journey, but contributes only the smaller part of its total flow of around 90 Sverdrup. The AMOC is driven by density differences and is a deep reaching vertical overturning of the Atlantic; the Gulf Stream is a near-surface current near the US Atlantic coast and mostly driven by winds. The AMOC however moves the bulk of the heat into the northern Atlantic so is highly relevant for climate, because the southward return flow is very cold and deep (heat transport is the flow multiplied by the temperature difference between northward and southward flow). The wind-driven part of the Gulf Stream contributes much less to the net northward heat transport, because that water returns to the south at the surface in the eastern Atlantic at a temperature not much colder than the northward flow, so it leaves little heat behind in the north. So for climate impact, the AMOC is the big deal, not the Gulf Stream.
2. The AMOC has repeatedly shown major instabilities in recent Earth history, for example during the Last Ice Age, prompting concerns about its stability under future global warming, see e.g. Broecker 1987 who warned about “unpleasant surprises in the greenhouse”. Major abrupt past climate changes are linked to AMOC instabilities, including Dansgaard-Oeschger-Events and Heinrich Events. For more on this see my Review Paper in Nature.
3. The AMOC has weakened over the past hundred years. We don’t have direct measurements over such a long time (only since 2004 from the RAPID project), but various indirect indications. We have used the time evolution of the ‘cold blob’ shown above, using SST observations since 1870, to reconstruct the AMOC in Caesar et al. 2018. In that article we also discuss a ‘fingerprint’ of an AMOC slowdown which also includes excessive warming along the North American coast, also seen in Figure 1. That this fingerprint is correlated with the AMOC in historic runs with CMIP6 models has recently been shown by Latif et al. 2022, see Figure 2.
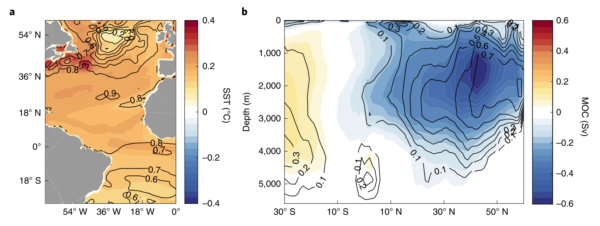
Others have used changes in the Florida Current since 1909, or changes in South Atlantic salinity, to reconstruct past AMOC changes – for details check out my last AMOC article here at RealClimate.
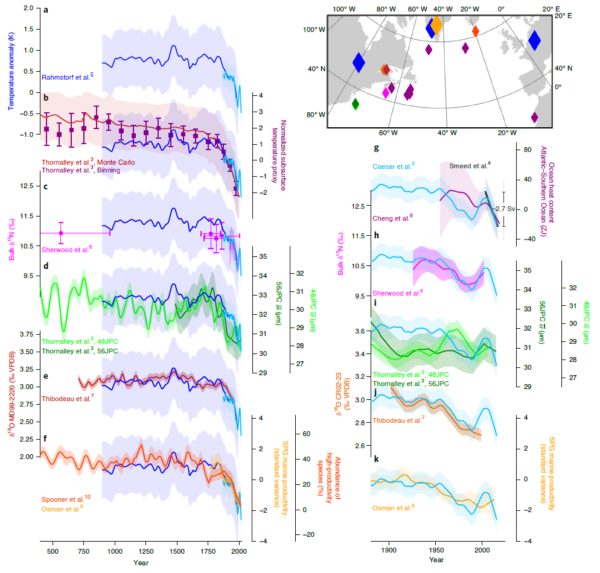
4. The AMOC is now weaker than any time in the past millennium. Several groups of paleoclimatologists have used a variety of methods to reconstruct the AMOC over longer time spans. We compiled the AMOC reconstructions we could find in Caesar et al. 2021, see Figure 3. In case you’re wondering how the proxy data reconstructions compare with other methods for the recent variability since 1950, that is shown in Caesar et al. 2022 (my take: quite well).
5. The long-term weakening trend is anthropogenic. For one, it is basically what climate models predict as a response to global warming, though I’d argue they underestimate it (see point 8 below). A recent study by Qasmi 2023 has combined observations and models to isolate the role of different drivers and concludes for the ‘cold blob’ region: “Consistent with the observations, an anthropogenic cooling is diagnosed by the method over the last decades (1951–2021) compared to the preindustrial period.”
In addition there appear to be decadal oscillations particularly after the mid-20th Century. They may be natural variability, or an oscillatory response to modern warming, given there is a delayed negative feedback in the system (weak AMOC makes the ‘cold blob’ region cool down, that increases the water density there, which strengthens the AMOC). Increasing oscillation amplitude may also be an early warning sign of the AMOC losing stability, see point 10 below.
The very short term SST variability (seasonal, interannual) in the cold blob region is likely just dominated by the weather, i.e. surface heating and cooling, and not indicative of changes in ocean currents.
6. The AMOC has a tipping point, but it is highly uncertain where it is. This tipping point was first described by Stommel 1961 in a highly simple model which captures a fundamental feedback. The region in the northern Atlantic where the AMOC waters sink down is rather salty, because the AMOC brings salty water from the subtropics to this region. If it becomes less salty by an inflow of freshwater (rain or meltwater from melting ice), the water becomes less dense (less “heavy”), sinks down less, the AMOC slows down. Thus it brings less salt to the region, which slows the AMOC further. It is called the salt advection feedback. Beyond a critical threshold this becomes a self-amplifying “vicious circle” and the AMOC grinds to a halt. That threshold is the AMOC tipping point. Stommel wrote: “The system is inherently frought with possibilities for speculation about climatic change.”
That this tipping point exists has been confirmed in numerous models since Stommel’s 1961 paper, including sophisticated 3-dimensional ocean circulation models as well as fully fledged coupled climate models. We published an early model comparison about this in 2005. The big uncertainty, however, is in how far the present climate is from this tipping point. Models greatly differ in this regard, the location appears to be sensitively dependent on the finer details of the density distribution of the Atlantic waters. I have compared the situation to sailing with a ship into uncharted waters, where you know there are dangerous rocks hidden below the surface that could seriously damage your ship, but you don’t know where they are.
7. Standard climate models have suggested the risk is relatively small during this century. Take the IPCC reports: For example, the Special Report on the Ocean and Cryosphere concluded:
The AMOC is projected to weaken in the 21st century under all RCPs (very likely), although a collapse is very unlikely (medium confidence). Based on CMIP5 projections, by 2300, an AMOC collapse is about
as likely as not for high emissions scenarios and very unlikely for lower ones (medium confidence).
It has long been my opinion that “very unlikely”, meaning less than 10% in the calibrated IPCC uncertainty jargon, is not at all reassuring for a risk we really should rule out with 99.9 % probability, given the devastating consequences should a collapse occur.
8. But: Standard climate models probably underestimate the risk. There are two reasons for that. They largely ignore Greenland ice loss and the resulting freshwater input to the northern Atlantic which contributes to weakening the AMOC. And their AMOC is likely too stable. There is a diagnostic for AMOC stability, namely the overturning freshwater transport, which I introduced in a paper in 1996 based on Stommel’s 1961 model. Basically, if the AMOC exports freshwater out of the Atlantic, then an AMOC weakening would lead to a fresher (less salty) Atlantic, which would weaken the AMOC further. Data suggest that the real AMOC exports freshwater, in most models it imports freshwater. This is still the case and was also discussed at the IUGG conference.
Here a quote from Liu et al. 2014, which nicely sums up the problem and gives some references:
Using oceanic freshwater transport associated with the overturning circulation as an indicator of the AMOC bistability (Rahmstorf 1996), analyses of present-day observations also indicate a bistable AMOC (Weijer et al. 1999; Huisman et al. 2010; Hawkins et al. 2011a,b; Bryden et al. 2011; Garzoli et al. 2012). These observational studies suggest a potentially bistable AMOC in the real world. In contrast, sensitivity experiments in CGCMs tend to show a monostable AMOC (Stouffer et al. 2006), indicating a model bias toward a monostable AMOC. This monostable bias of the AMOC in CGCMs, as first pointed out by Weber et al. (2007) and later confirmed by Drijfhout et al. (2011), could be related to a bias in the northward freshwater transport in the South Atlantic by the meridional overturning circulation.
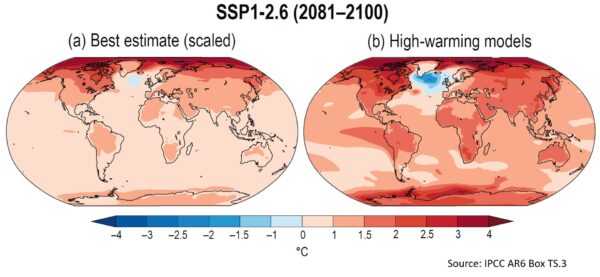
9. Standard climate models get the observed ‘cold blob’, but only later. Here is some graphs from the current IPCC report, AR6.

10. There are possible Early Warning Signals (EWS). New methods from nonlinear dynamics search for those warning signals when approaching tipping points in observational data, from cosmology to quantum systems. They use the critical slowing down, increasing variance or increasing autocorrelation in the variability of the system. There is the paper by my PIK colleague Niklas Boers (2021), which used 8 different data series (Figure 6) and concluded there is “strong evidence that the AMOC is indeed approaching a critical, bifurcation-induced transition.”

Another study, this time using 312 paleoclimatic proxy data series going back a millennium, is Michel et al. 2022. They argue to have found a “robust estimate, as it is based on sufficiently long observations, that the Atlantic Multidecadal Variability may now be approaching a tipping point after which the Atlantic current system might undergo a critical transition.”
And today (update!) a third comparable study by Danish colleagues has been published, Ditlevsen & Ditlevsen 2023, which expects the tipping point already around 2050, with a 95% uncertainty range for the years 2025-2095. Individual studies always have weaknesses and limitations, but when several studies with different data and methods point to a tipping point that is already quite close, I think this risk should be taken very seriously.
Conclusion
Timing of the critical AMOC transition is still highly uncertain, but increasingly the evidence points to the risk being far greater than 10 % during this century – even rather worrying for the next few decades. The conservative IPCC estimate, based on climate models which are too stable and don’t get the full freshwater forcing, is in my view outdated now. I side with the recent Climate Tipping Points report by the OECD, which advised:
Yet, the current scientific evidence unequivocally supports unprecedented, urgent and ambitious climate action to tackle the risks of climate system tipping points.
If you like to know more about this topic, you can either watch my short talk from the Exeter Tipping Points conference last autumn (where also Peter Ditlevsen first presented the study which was just published), or the longer video of my EPA Climate Lecture in Dublin Mansion House last April.
Watching the detections
The detection and the attribution of climate change are based on fundamentally different frameworks and shouldn’t be conflated.
We read about and use the phrase ‘detection and attribution’ of climate change so often that it seems like it’s just one word ‘detectionandattribution’ and that might lead some to think that it is just one concept. But it’s not.
[Read more…] about Watching the detectionsClimate adaptation should be based on robust regional climate information
Climate adaptation steams forward with an accelerated speed that can be seen through the Climate Adaptation Summit in January (see previous post), the ECCA 2021 in May/June, and the upcoming COP26. Recent extreme events may spur this development even further (see previous post about attribution of recent heatwaves).
To aid climate adaptation, Europe’s Climate-Adapt programme provides a wealth of resources, such as guidance, case studies and videos. This is a good start, but a clear and transparent account on how to use the actual climate information for adaptation seems to be missing. How can projections of future heatwaves or extreme rainfall help practitioners, and how to interpret this kind of information?
[Read more…] about Climate adaptation should be based on robust regional climate informationRapid attribution of PNW heatwave
Summary: It was almost impossible for the temperatures seen recently in the Pacific North West heatwave to have occurred without global warming. And only improbable with it.
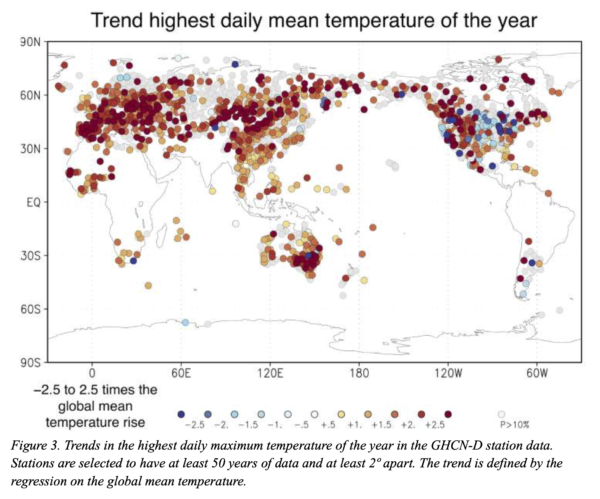
It’s been clear for at least a decade that global warming has been in general increasing the intensity of heat waves, with clear trends in observed maximum temperatures that match what climate models have been predicting. For the specific situation in the Pacific NorthWest at the end of June, we now have the first attribution analysis from the World Weather Attribution group – a consortium of climate experts from around the world working on extreme event attribution. Their preprint (Philip et al.) is available here.
IPCC Special Report on Land
Thread for discussions of the new special report. [Boosting a comment from alan2102].
Climate Change and Land
An IPCC special report on climate change, desertification, land degradation, sustainable land management, food security, and greenhouse gas fluxes in terrestrial ecosystems
Land degradation accelerates global climate change. Al Jazeera English
Published on Aug 8, 2019 New UN report highlights vicious cycle of climate change, land degradation. CNA
Published on Aug 8, 2019 New IPCC Report Warns of Vicious Cycle Between Soil Degradation and Climate Change. The Real News Network
Published on Aug 8, 2019
Climate Change and Extreme Summer Weather Events – The Future is still in Our Hands
Summer 2018 saw an unprecedented spate of extreme weather events, from the floods in Japan, to the record heat waves across North America, Europe and Asia, to wildfires that threatened Greece and even parts of the Arctic. The heat and drought in the western U.S. culminated in the worst California wildfire on record. This is the face of climate change, I commented at the time.
Some of the connections with climate change here are pretty straightforward. One of the simplest relationships in all of atmospheric science tells us that the atmosphere holds exponentially more moisture as temperatures increase. Increased moisture means potentially for greater amounts of rainfall in short periods of time, i.e. worse floods. The same thermodynamic relationship, ironically, also explains why soils evaporate exponentially more moisture as ground temperatures increase, favoring more extreme drought in many regions. Summer heat waves increase in frequency and intensity with even modest (e.g. the observed roughly 2F) overall warming owing to the behavior of the positive “tail” of the bell curve when you shift the center of the curve even a small amount. Combine extreme heat and drought and you get more massive, faster-spreading wildfires. It’s not rocket science.
But there is more to the story. Because what made these events so devastating was not just the extreme nature of the meteorological episodes but their persistence. When a low-pressure center stalls and lingers over the same location for days at a time, you get record accumulation of rainfall and unprecedented flooding. That’s what happened with Hurricane Harvey last year and Hurricane Florence this year. It is also what happened with the floods in Japan earlier this summer and the record summer rainfall we experienced this summer here in Pennsylvania. Conversely, when a high-pressure center stalls over the same location, as happened in California, Europe, Asia and even up into the European Arctic this past summer, you get record heat, drought and wildfires.
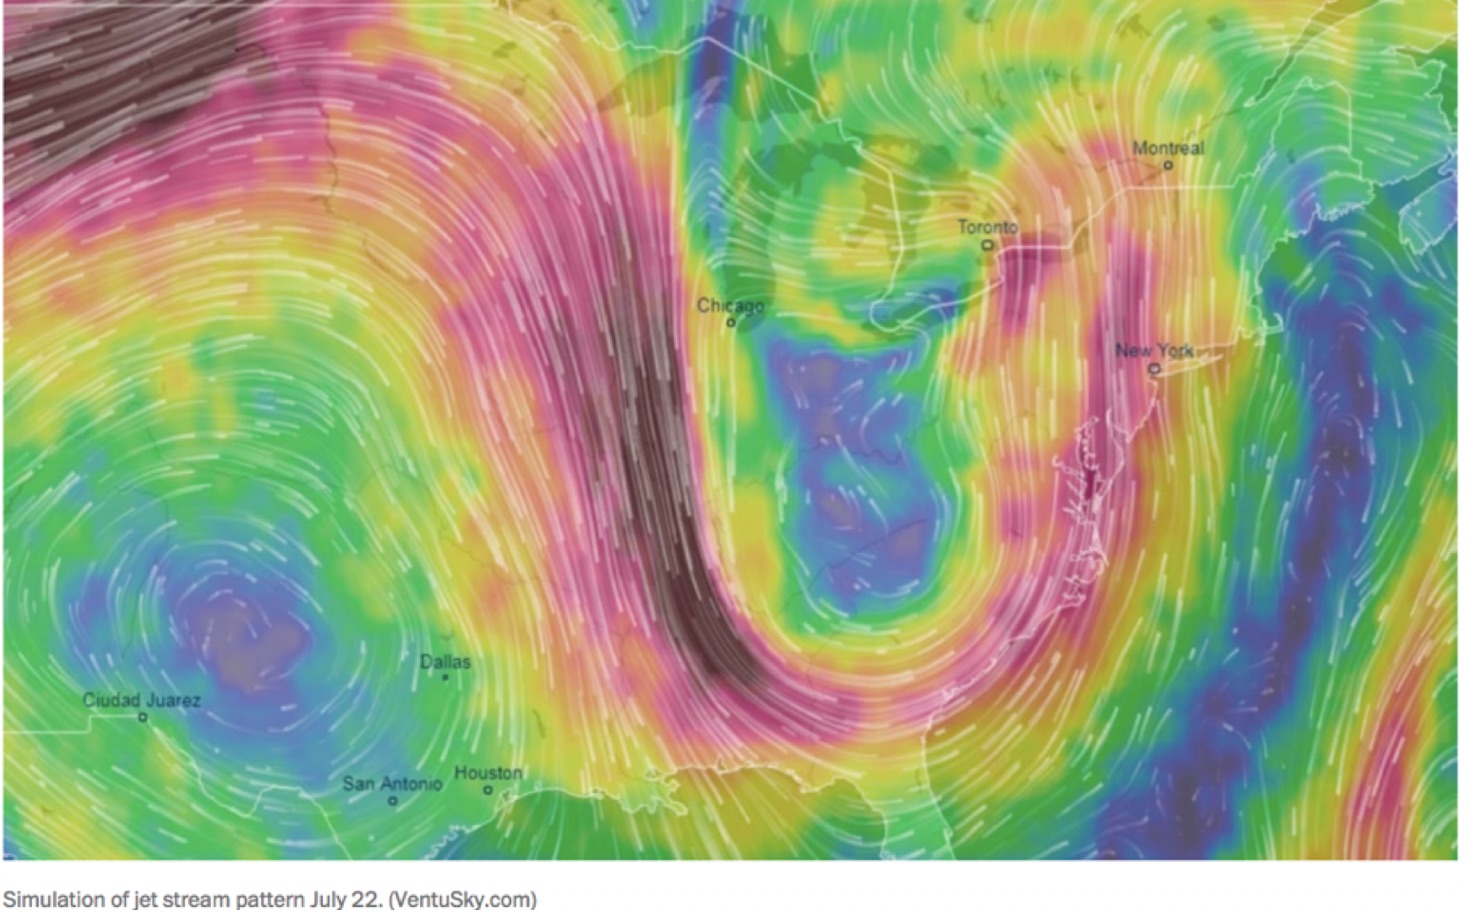
Scientists such as Jennifer Francis have linked climate change to an increase in extreme weather events, especially during the winter season when the jet stream and “polar vortex” are relatively strong and energetic. The northern hemisphere jet stream owes its existence to the steep contrast in temperature in the middle latitudes (centered around 45N) between the warm equator and the cold Arctic. Since the Arctic is warming faster than the rest of the planet due to the melting of ice and other factors that amplify polar warming, that contrast is decreasing and the jet stream is getting slower. Just like a river traveling over gently sloping territory tends to exhibit wide meanders as it snakes its way toward the ocean, so too do the eastward-migrating wiggles in the jet stream (known as Rossby waves) tend to get larger in amplitude when the temperature contrast decreases. The larger the wiggles in the jet stream the more extreme the weather, with the peaks corresponding to high pressure at the surface and the troughs low pressure at the surface. The slower the jet stream, the longer these extremes in weather linger in the same locations, giving us more persistent weather extremes.
Something else happens in addition during summer, when the poleward temperature contrast is especially weak. The atmosphere can behave like a “wave guide”, trapping the shorter wavelength Rossby waves (those that that can fit 6 to 8 full wavelengths in a complete circuit around the Northern Hemisphere) to a relatively narrow range of latitudes centered in the mid-latitudes, preventing them from radiating energy away toward lower and higher latitudes. That allows the generally weak disturbances in this wavelength range to intensify through the physical process of resonance, yielding very large peaks and troughs at the sub-continental scale, i.e. unusually extreme regional weather anomalies. The phenomenon is known as Quasi-Resonant Amplification or “QRA”, and (see Figure below).
Many of the most damaging extreme summer weather events in recent decades have been associated with QRA, including the 2003 European heatwave, the 2010 Russian heatwave and wildfires and Pakistan floods (see below), and the 2011 Texas/Oklahoma droughts. More recent examples include the 2013 European floods, the 2015 California wildfires, the 2016 Alberta wildfires and, indeed, the unprecedented array of extreme summer weather events we witnessed this past summer.
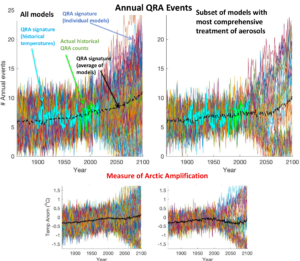
The increase in the frequency of these events over time is seen to coincide with an index of Arctic amplification (the difference between warming in the Arctic and the rest of the Northern Hemisphere), suggestive of a connection (see Figure below).
Last year we (me and a team of collaborators including RealClimate colleague Stefan Rahmstorf) published an article in the Nature journal Scientific Reports demonstrating that the same pattern of amplified Arctic warming (“Arctic Amplification”) that is slowing down the jet stream is indeed also increasing the frequency of QRA episodes. That means regional weather extremes that persist longer during summer when the jet stream is already at its weakest. Based on an analysis of climate observations and historical climate simulations, we concluded that the “signal” of human influence on QRA has likely emerged from the “noise” of natural variability over the past decade and a half. In summer 2018, I would argue, that signal was no longer subtle. It played out in real time on our television screens and newspaper headlines in the form of an unprecedented hemisphere-wide pattern of extreme floods, droughts, heat waves and wildfires.
In a follow-up article just published in the AAAS journal Science Advances, we look at future projections of QRA using state-of-the-art climate model simulations. It is important to note that that one cannot directly analyze QRA behavior in a climate model simulation for technical reasons. Most climate models are run at grid resolutions of a degree in latitude or more. The physics that characterizes QRA behavior of Rossby Waves faces a stiff challenge when it comes to climate models because it involves the second mathematical derivative of the jet stream wind with respect to latitude. Errors increase dramatically when you calculate a numerical first derivative from gridded fields and even more so when you calculate a second derivative. Our calculations show that the critical term mentioned above suffers from an average climate model error of more than 300% relative to observations. By contrast, the average error of the models is less than a percent when it comes to latitudinal temperature averages and still only about 30% when it comes to the latitudinal derivative of temperature.
That last quantity is especially relevant because QRA events have been shown to have a well-defined signature in terms of the latitudinal variation in temperature in the lower atmosphere. Through a well-established meteorological relationship known as the thermal wind, the magnitude of the jet stream winds is in fact largely determined by the average of that quantity over the lower atmosphere. And as we have seen above, this quantity is well captured by the models (in large part because the change in temperature with latitude and how it responds to increasing greenhouse gas concentrations depends on physics that are well understood and well represented by the climate models).
These findings, incidentally have broader implications. First of all, climate model-based studies used to assess the degree to which current extreme weather events can be attributed to climate change are likely underestimating the climate change influence. One model-based study for example suggested that climate change only doubled the likelihood of the extreme European heat wave this summer. As I commented at the time, that estimate is likely too low for it doesn’t account for the role that we happen to know, in this case, that QRA played in that event. Similarly, climate models used to project future changes in extreme weather behavior likely underestimate the impact that future climate changes could have on the incidence of persistent summer weather extremes like those we witnessed this past summer.
So what does our study have to say about the future? We find that the incidence of QRA events would likely continue to increase at the same rate it has in recent decades if we continue to simply add carbon dioxide to the atmosphere. But there’s a catch: The future emissions scenarios used in making future climate projections must also account for factors other than greenhouse gases. Historically, for example, the use of old coal technology that predates the clean air acts produced sulphur dioxide gas which escapes into the atmosphere where it reacts with other atmospheric constituents to form what are known as aerosols.
These aerosols caused acid rain and other environmental problems in the U.S. before factories in the 1970s were required to install “scrubbers” to remove the sulphur dioxide before it leaves factory smokestacks. These aerosols also reflect incoming sunlight and so have a cooling effect on the surface in the industrial middle-latitudes where they are produced. Some countries, like China, are still engaged in the older, dirtier-form of coal burning. If we continue with business-as-usual burning of fossil fuels, but countries like China transition to more modern “cleaner” coal burning to avoid air pollution problems, we are likely to see a substantial drop in aerosols over the next half century. Such an assumption is made in the Intergovernmental Panel on Climate Change (IPCC)’s “RCP 8.5” scenario—basically, a “business as usual” future emissions scenario which results in more than a tripling of carbon dioxide concentrations relative to pre-industrial levels (280 parts per million) and roughly 4-5C (7-9F) of planetary warming by the end of the century.
As a result, the projected disappearance of cooling aerosols in the decades ahead produces an especially large amount of warming in middle-latitudes in summer (when there is the most incoming sunlight to begin with, and, thus, the most sunlight to reflect back to space). Averaged across the various IPCC climate models there is even more warming in mid-latitudes than in the Arctic—in other words, the opposite of Arctic Amplification i.e. Arctic De-amplification (see Figure below). Later in the century after the aerosols disappear greenhouse warming once again dominates and we again see an increase in QRA events.
So, is there any hope to avoid future summers like the summer of 2018? Probably not. But in the scenario where we rapidly move away from fossil fuels and stabilize greenhouse gas concentrations below 450 parts per million, giving us a roughly 50% chance of averting 2C/3.6F planetary warming (the so-called “RCP 2.6” IPCC scenario) we find that the frequency of QRA events remains roughly constant at current levels.
While we will presumably have to contend with many more summers like 2018 in the future, we could likely prevent any further increase in persistent summer weather extremes. In other words, the future is still very much in our hands when it comes to dangerous and damaging summer weather extremes. It’s simply a matter of our willpower to transition quickly from fossil fuels to renewable energy.
Are the heatwaves caused by climate change?
I get a lot of questions about the connection between heatwaves and climate change these days. Particularly about the heatwave that has affected northern Europe this summer. If you live in Japan, South Korea, California, Spain, or Canada, you may have asked the same question.
[Read more…] about Are the heatwaves caused by climate change?
