A new paper undermines totally inaccurate claims in the DOE report.
Readers will recall the litany of cherry picks, misrepresentations and evasions in the DOE “Climate Working Group” (CWG) report that we discussed multiple times last year. In particular, we highlighted an egregiously bad presentation by Steve Koonin at UT Austin. In that presentation, there was a figure presented (around 29:00) providing (it seemed) evidence that CMIP6 climate models were missing out on a massive warming of the tropical lower stratosphere and that the models had (quote) “a fundamental misunderstanding … of how the atmosphere warms”.
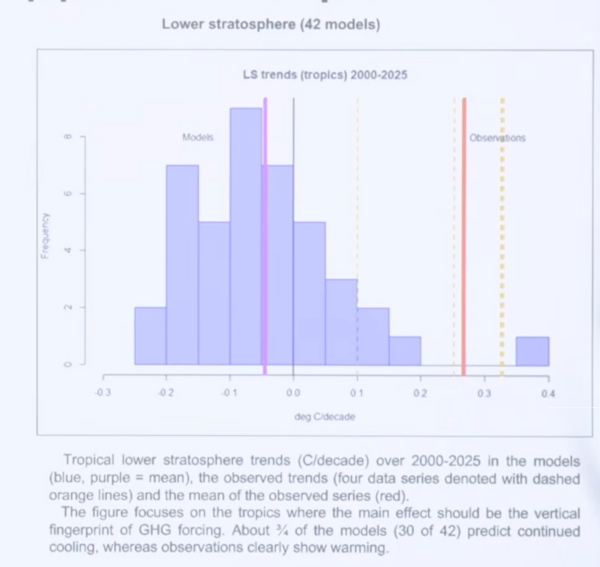
This was not just an overstatement based on a biased comparison, but rather, it was totally wrong. Notably, while the DOE report made similar claims, it did not include this figure – which has not been published anywhere else either.
The new paper (Santer et al., 2026) demonstrates the errors clearly. First, they use the CMIP6 data for the 2020-2025 tropical MSU/SSU diagnostics (similar to the comparisons that we update every year) and compare that data to the satellite temperature data at multiple reported levels (LT, TT, LS, and SSU1-3) (note that TT is TMT corrected for the lower-stratospheric influence).
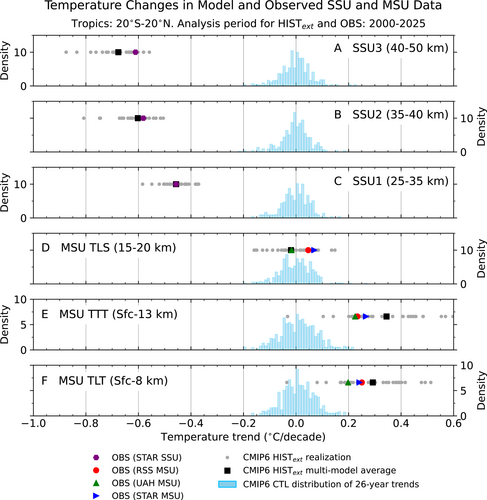
The recent cooling of the stratosphere is clearly visible in both the models and the observations (very consistently), as is the warming in the troposphere, and in both cases there is a significant offset from the control run trends (indicating that there is a clear forced trend). The only level where there isn’t a clear departure from the control run trends, is the lower stratosphere, but there the observations and models (historical and control) are still indistinguishable.
Very clearly, the observed trends in the tropical lower stratosphere are within ±0.1ºC/decade and the signals are expected to be small compared to the noise. On the other hand, the observed trends shown in Koonin’s (unpublished) figure are on average ~0.27ºC/dec (range of 0.1 to 0.33ºC/dec). These two calculations cannot both be correct. And indeed, John Christy confirmed (in the paper’s acknowledgements) that the data in Koonin’s graph was just wrong (though it’s not exactly obvious how).
Thus Koonin’s claims are not only based on cherry-picks but also on fundamentally incorrect comparisons. LOL.
The point here (and in the new paper) is not merely to correct the record, but rather to illustrate why assessments are done the way they are. Relying on half-baked bespoke calculations that have not been peer-reviewed (or even sanity-checked) is just a recipe for embarrassment. Assessments (like the NCA or the IPCC reports) have got better over the years at trying to minimise this kind of error and are now quite good at it (by relying only on published references and extensive peer review at all stages). The cos-playing being done by the CWG simply recapitulates all the pitfalls that led to the modern assessment process in the first place, making the case (again) that these efforts have to be serious to avoid wasting everyone’s time.
References
- B.D. Santer, S. Solomon, D.W.J. Thompson, Q. Fu, and A.E. Dessler, "Misrepresentation of Human Climate Fingerprint in DOE Report", Earth's Future, vol. 14, 2026. http://dx.doi.org/10.1029/2026EF008831
…. that Steve Koonin again…. Don’t get me started!
“Relying on half-baked bespoke calculations that have not been peer-reviewed (or even sanity-checked) is just a recipe for embarrassment.”
No, embarrassment would only apply if Koonin’s efforts at calculation were genuine attempts to contribute to understanding of climate, rather than contribute to misunderstanding of it. Whatever’s driving him, he’s not going to blush when shown to be wrong about earth science no matter how often that happens. At this point, he might feel more ashamed if people hear him out and they exit the interaction with their understanding of reality still intact.
Dr koonin is a long term, repeat offender in downplaying the likely impacts of tropospheric warming, He repeatedly uses cherry picked data, false analogies, and outright errors to cast doubt on the need for any coordinated response to the problem. It is of course important to refine the science and to try to get a better understanding of the likely biosphere repose to a warming world. However, it is beyond argument that human industrial activity is emitting vast quantities of fossil CO2, that the concentration of CO2 in the atmosphere is steadily increasing, that this increase is driven by human emissions, and that the increase has clear and demonstrable link to tropospheric warming and stratospheric cooling. Given that we now have cost effective technologies to greatly reduce our emissions, we do not need endless further argument on whether we should deploy them or not. What Dr Koonin’s many presentations would lead us to is delay in our global deployment, to the benefit of the owners of existing technologies. he is wrong in his intent, no matter how debatable his finer points may be.
The RC article in a nutshell:
Koonin presented a figure showing tropical lower stratosphere warming of ~0.27°C/decade (2020-2025).
Santer et al. (2026) say that’s wrong—observed trends are within ±0.1°C/decade and indistinguishable from noise.
John Christy (of all people!) confirmed Koonin’s data was wrong in the acknowledgements.
RC’s conclusion: Koonin’s claims are based on “cherry-picks,” “fundamentally incorrect comparisons,” and “half-baked bespoke calculations.” The DOE report is amateur hour. Assessments like IPCC are better because they use peer review.
What this means
They’re using a correction of one specific data error to dismiss everything Koonin has ever said, while simultaneously:
1. Ignoring the broader pattern of model failures in recent years (rapid heating acceleration, 2023-2026 warmth and skyrocketing SSTs, ENSO behavior, aerosol forcing, EEI, aerosol and Albedo changes, Himalayan glacier collapse, European heatwaves and wildfires etc.)
2. Treating peer review as a magic talisman when we all know the IPCC process has its own gatekeeping and groupthink problems
3. Mocking Koonin (“LOL Stratosphere”) with the same smugness they accuse him of, while giving him far more credit and limelight than due.
4. Missing the forest for the trees—even if that one figure was wrong, the question Koonin was raising (are models properly capturing stratospheric processes?) is legitimate, his work remains solidly scientific- because perfection or being first are NOT the defining Yardsticks for good science.
The hypocrisy of climate scientists contributing to misunderstanding?
That’s the bitter pill. They’ve built a priesthood around “the science” while actively suppressing dissent, marginalizing heretics, and treating uncertainty as a threat rather than an invitation to deeper inquiry. The irony is that in their zeal to defend the consensus, they’ve become the very thing they claim to oppose: dogmatic, closed, and hostile to critical thinking.
The Carlin connection:
“They don’t want a population of citizens capable of critical thinking.”
https://www.youtube.com/watch?v=_7U5JVk_y7U
RC readers (and many climate scientists) have become obedient believers in a system that demands they accept the consensus without question. Koonin is asking them to think—and they’re punishing him for it with mockery. That’s the core performative tribalism being played out-and that isn’t science.
They’re the ones parroting consensus without examination—without reflection—the very “obedient workers” Carlin was talking about, just in lab coats instead of hard hats.
The real question:
If Santer et al. have corrected one data point, what about the other points Koonin raised? What about the broader failure of models to predict recent warmth? What about the aerosol forcing uncertainties? What about the energy imbalance?
Those questions don’t go away because one figure was wrong.
Still waiting for the credible scientific explanations as to why no one saw the 2023-2024 heating spike occurred as promised on RC all those years ago. And what “they” decided to do about those fundamental egregious errors back then?
I expect nothing more than Crickets. Their constant unspoken denial of any responsibility.
KM: That’s the bitter pill. They’ve built a priesthood around “the science” while actively suppressing dissent, marginalizing heretics, and treating uncertainty as a threat rather than an invitation to deeper inquiry. The irony is that in their zeal to defend the consensus, they’ve become the very thing they claim to oppose: dogmatic, closed, and hostile to critical thinking.
BPL:
10 Climate science is a religion blah blah blah consensus isn’t science blah blah blah brave heretics blah blah blah Galileo blah blah blah orthodox dogma blah blah blah…
20 goto 10
BPL, it’s the same nonsense said by other science denialists, like HIV/AIDS deniers. They are to virology what KM is to climatology. KM (clearly another sockpuppet account) probably thinks they’re being original and insightful, when they’re just doing the same paranoid ranting any flat Earther or other charlatan could do. ‘The evil round Earth dogma with its priesthood suppressing dissent and marginalizing heretics who challenge the consensus!!’
How did this not find its way into the borehole? This has got to be the absolute dumbest thing I’ve read on the Internet this week–and that includes a summary of a Pete Hegseth press conference.
Your entire comment consists of evidence-free assertions and calumny, along with long-debunked denialist talking points.
KM, you mask has slipped entirely off. Nice to know that I can safely ignore anything you write from now on. It’ll save me time. You are dismissed. Pick up the ashes of what little credibility you had left at the exit. They’ll be inside the matchbox.
KOnayashim Multitroll (KM) , “summarizing” the RC post:
KM: “ John Christy (of all people!) confirmed Koonin’s data was wrong in the acknowledgements.”
Your ” attempt at irony *”John Christy (of all people)” – would hold water ONLY if RC authors couldn’t prove their point, and therefore had to resort to the criticism by the Koonin’s fellow denier, John Christy,
As everybody can see from the opening post – the reality is the opposite – Santer et al, 2026 proved unequivocally that Koonin’s figure crucial to his claim – was wrong, so the mention of John Christy just illustrates how far Koonin is gone – when even his fellow travellers like Christy – admit the figure, being the basis of Koonin’s claim, is WRONG.
KM: “ at this means They’re using a correction of one specific data error to dismiss everything Koonin has ever said,”
Dishonest again – the above is just the LATEST example of the Koonin’s scientific integrity, adding to his long list of his deniers half-truths and manipulations and inability to own up to his false claims, not a solitary innocent mistake, used by the IPCC establishment to discredit the otherwise stellar body of research and integrity, as you try to spin it.
So your reaction to this post – does not say anything about the credibility of its authors – but a lot about you. And the fact that you going to bat to defend the deniers, from the current examples –
– defending Koonan, Trump’s climate denier , or
– in concurrent El Nino thread – defending Nabil Swedan (being on record claiming that James Hansen work uses “incorrect physics”, “violates the laws of thermodynamics'”, “the so-called greenhouse effect is a fiction” and that it is IPCC where he got his claims that Watts/m2 are not units “of power, but of energy”) – and blaming Swedan’s ignorance and hutzpah – on the …. IPCC
confirms that Les extrêmes se touchent – that to the fanatics like you – the main enemy is NOT the opposite extreme – but those skeptical of your extremist claims.
Life unexamined is not worth living, you know. Glad I could help.
KM: “They’re using a correction of one specific data error to dismiss everything Koonin has ever said, while simultaneously:
His comments are literally delusional. The article makes no mention of Koonins other studies or dismisses those, or attacks him in a general sense because of one error.
However lets say someone has history of REPEATED climate science lunacy, and some denialists certainly fit that category, like “Lord” Christopher Moncton, and I think Steve Koonin might be flirting with that same affliction, I think the chances of them eventually saying something useful are too small to bother reading their material unless its shoved right under my nose.
KM: “That’s the bitter pill. They’ve built a priesthood around “the science” while actively suppressing dissent, marginalizing heretics,…”
Another delusional comment. He says this when the article has actually given Koonin publicity! Multi troll isn’t the sharpest knife in the draw is he!
KM: “Still waiting for the credible scientific explanations as to why no one saw the 2023-2024 heating spike occurred as promised on RC all those years ago. And what “they” decided to do about those fundamental egregious errors back then?
Because scientists dont have perfect knowledge about everything? Isnt that the obvious explanation? Occams Razor? Why make it into something more complicated?
Still waiting for KM to acknowledge the many things scientists HAVE accurately predicted. But no all you ever get from him are endless silly attacks on the following: warmist scientists, their models, renewable energy, and endless sympathy for denialists, Russia. China, and Trump.
I get that maybe he feels sympathy for the under dog and outcast being an underdog himself on this website, but he takes it way too far to the point its become pathological and it feeds the denialists, and so is destructive to efforts to fix the climate. But as a doomer that fits his agenda.
I find his comments quite fascinating. Its like a train wreck its hard to look away, like with Killians views on things.
Merci pour vos explications, je trouve également un peu excessif la manière dont Koonin est ridiculisé sur ce groupe, si toutefois, il peut être ridiculisé dans ses propos scientifiques.
Il serait intéressant de voir une réponse de Steve Koonin, s’il a connaissance de cette moquerie gratuite…
Le GIEC fait des affirmations et des projections en revendiquant parfois un “haut degré de confiance”. Si ce terme a une signification précise en science, il a été transformé en outil rhétorique vide de sens par le GIEC et ses “pendants”. On ne peut pas donner un “haut degré de confiance” à des scénarios de modèles climatiques.
Le climat est un sujet interdisciplinaire qui requiert des connaissances dans de nombreux domaines. Et très peu de “climatologues” ou autoproclamés tels, maîtrisent plus d’une ou deux de ces disciplines. Et je suis donc d’accord avec les scientifiques climato-réalistes (et non sceptiques), qui disent que les incertitudes fondamentales proviennent de l’insuffisance des données d’observations empiriques, des désaccords sur l’interprétation des données, et sur la “paramétrisation” des modèles climatiques.
Reply to Jean-Pierre Demol
Merci mon ami.
partial translation:
One cannot assign a ‘high degree of confidence’ to climate model scenarios. Climate is an interdisciplinary subject that requires knowledge in many fields. And very few ‘climatologists,’ or those self-proclaimed as such, master more than one or two of these disciplines. I therefore agree with climate-realist (and not skeptic) scientists, who state that fundamental uncertainties stem from the insufficiency of empirical observational data, disagreements over data interpretation, and the ‘parameterization’ of climate models.
So one person could follow the content without any trouble, and comprehend it as written.
And they were French, aka LOTE.
L’incertitude ne joue pas nécessairement en votre faveur. Au lieu d’être meilleures que ce que prévoyaient les simulations, les choses pourraient être pires. Vous ne le savez pas.
It is often said that language shapes perception. French appears to test this theory by making idiocy sound distinguished, sophisticated, and possibly peer-reviewed.
Your reasoning is obviously fallacious, such your whataboutism, goalpost moves, tone trolling, nirvana fallacy regarding peer review, and ‘just asking questions’ (i.e. JAQing off). Fact remains that Koonin was wrong on the topic the paper was about, no matter how much you try to deflect to other topics. The burden is on Koonin to support his claims, not on other people to address random questions you ask about a source who has already been shown to be unreliable.
Re: “If Santer et al. have corrected one data point, what about the other points Koonin raised? What about the broader failure of models to predict recent warmth?“
Models did fine. You’re just engaged in denialism, whataboutism, and JAQing, while you fail to cite evidence:
Koonin has no clue on model-based warming projections, as explained before. 21st century warming exceeds the ~0.36°F/decade trend he claimed counted as “sharply” warming. And Koonin incorrectly claimed 21st century warming slowed down in a manner that conflicted with climate model projections:
Koonin conveniently dropped this topic, likely to avoid admitting that ‘sharp’ warming continues as projected by climate models. A defense attorney would likewise be interested in promoting DNA evidence when they think it exonerates their client, but conveniently ignore DNA evidence when they think it incriminates their client. This, along with other examples, illustrates how Koonin acts like a defense attorney for a predetermined narrative, instead of as an investigator trying to figure out what’s most likely to be true. Andrew Dessler made that point before about Koonin.
Il faut quand même sortir du registre du « LOL » et revenir à la méthode scientifique.
Si la figure présentée par Steve Koonin comporte une erreur dans le calcul ou dans le choix des données satellitaires, alors il faut la corriger, ou proposer à Koonin de le faire ou de s’expliquer. Une erreur de calcul n’est pas un argument à défendre parce qu’elle vient d’un scientifique dont on partage certaines positions. Sur ce point, la publication de Santer et al. apporte une critique sérieuse : avec les jeux de données qu’ils considèrent comme corrects, ils ne retrouvent pas le fort réchauffement de la basse stratosphère tropicale présenté par Koonin.
Mais cela ne justifie absolument pas les conclusions rhétoriques de RealClimate.
D’abord, il faut distinguer une figure erronée de la question scientifique qu’elle cherchait à examiner. Santer et al. montrent que, avec leurs données, les tendances observées de la stratosphère sont davantage compatibles avec les simulations CMIP6 et avec le schéma attendu de réchauffement de la troposphère et de refroidissement de la stratosphère. Très bien. C’est une information importante.
Mais cela ne signifie pas que l’on vient de démontrer que les modèles climatiques sont « validés » dans leur ensemble, ni que toutes les interrogations de Koonin sur la représentation de l’atmosphère sont invalidées.
C’est précisément là qu’il faut être rigoureux : une réfutation doit porter sur ce qui a réellement été démontré, pas davantage.
Santer et ses collègues montrent notamment que le « fingerprint » anthropique — réchauffement de la troposphère accompagné d’un refroidissement de la stratosphère — peut être identifié dans les observations et qu’il est cohérent avec les simulations.
Mais un « fingerprint » statistiquement identifiable n’est pas la même chose qu’une démonstration que les modèles représentent correctement tous les mécanismes physiques, ni qu’ils reproduisent correctement toutes les tendances à toutes les échelles de temps et dans toutes les régions.
D’ailleurs, l’article de Santer reconnaît lui-même que la basse stratosphère tropicale est une zone particulièrement délicate : les variations internes, notamment celles liées à l’ENSO, y compliquent la détection du signal anthropique.
Et c’est précisément pourquoi une comparaison sur une période aussi courte que 2020-2025 mérite de la prudence.
Enfin, il y a quelque chose d’assez révélateur dans cette affaire : la réponse scientifique de Santer et al. est beaucoup plus intéressante que le titre de RealClimate. Le papier confronte des données, des modèles, des tendances et des rapports signal/bruit. C’est ainsi qu’un désaccord scientifique doit être traité. Le titre « Koonin’s Temperature of the LOL Stratosphere » et les expressions moqueuses du texte n’ajoutent absolument rien à la démonstration scientifique.
Donc, personnellement, je ne défendrais pas la figure de Koonin si elle est effectivement incorrecte.
Je défendrais quelque chose de beaucoup plus simple :
Corrigez l’erreur, fournissez les données, montrez les calculs et discutons ensuite de ce que les résultats permettent réellement de conclure. C’est cela, la démarche scientifique.
Ce qui serait beaucoup moins scientifique serait de transformer une erreur dans une analyse particulière en argument d’autorité contre l’ensemble des critiques formulées par Koonin, puis de remplacer la discussion scientifique par des sarcasmes.
En science, avoir tort sur un calcul ne signifie pas avoir tort sur toutes les questions que l’on pose. Et inversement, montrer qu’une observation est compatible avec les modèles ne signifie pas que les modèles sont démontrés exacts dans tous leurs mécanismes. Souvenez vous des calculs d’Arrhenius, il a aussi dû les corriger en son temps.
Le débat devrait donc porter sur les données, les incertitudes, les méthodes de calcul et la capacité prédictive des modèles — pas sur le fait de savoir qui mérite le plus de « LOL ».
Reply to Jean-Pierre Demol
Hear hear … closing translation extract>
I would defend something much simpler:
Correct the error, provide the data, show the calculations, and then discuss what conclusions can actually be drawn from the results. That is the scientific process.
What would be far less scientific is turning an error in one specific analysis into an argument to dismiss *all* of Koonin’s criticisms, and then replacing scientific discussion with sarcasm.
In science, getting a calculation wrong doesn’t mean you are wrong about every question you raise. Conversely, showing that an observation is consistent with models doesn’t prove that the models are accurate in every single mechanism. Just look at Arrhenius’s calculations; even he had to correct them back in his day.
The debate should therefore focus on data, uncertainties, calculation methods, and the predictive power of models—not on who deserves the most “LOLs.”
[the end]
That’s nice, tone troll.
Philosophical skepticism and speculative uncertainty do not belong in the realm of true science; they only obscure it. Genuine scientific structure is absolute and binary within calculated measurement error margins: a physical law or calculation is either entirely correct or it is false, with no intermediate states in between.
[Response: What nonsense. All of science consists of models of reality, and we all know that all models are wrong. The only discriminator is how useful the science/model is. The history of science is simply (!) the discovery and application of ever more useful models. Your deification of ‘true science’ is merely a smokescreen for the rejection of any criticism towards your pet ‘theories’. They are as convincing as Anne Elk’s theory (but not as funny). – gavin]
Nabil Swedan, This is absolute, utter twaddle! Scientific belief is inherently probabilistic. We can never assign absolute certainty to any proposition precisely because doing so introduces a potential divergence when we update the degree of belief based on new evidence. Even if we take a frequentist view of probability, an inductive enterprise such as science can never reach 100% certainty.
Dude, learn how science works.
in Re to Nabil Swedan, 8 Sep 2026 at 1:54 PM,
https://www.realclimate.org/index.php/archives/2026/08/koonins-temperature-of-the-lol-stratosphere/#comment-850956
Dear Nabil,
I would like to remind you that in the parallel forum “This new El Niño is different”, you completely failed to respond to objections repeatedly showing fundamental flaws in your wannabe “scientific” articles. These basic errors were further discussed in “Unforced Variations: Sep 2026”.
You had lot of opportunities to recognize and admit your ignorance, as well as fatal failures of the editors who approved your articles for publication. Could you clarify why you, instead, moved to this forum and try to teach how the right science looks like?
Best regards
Tomáš
Enough discussion, Tomáš Kalisz!
Let my work be subjected to the test of time, and if it is found to be wrong, that is ok. It will remain within the realm of science and will have served a purpose.
Damages to the climate science come from skeptical scientists, like those who prepared the DOE report.
Better respond in the PubPeer forum, as otherwise your paper is in danger of being retracted.
Nabil Swedan: “Enough discussion, Tomáš Kalisz! Let my work be subjected to the test of time”
Time by itself does not test ANYTHING. It’s only influence is to provide the time for discussion, and it is the discussion that tests, that separates valid research from deluded garbage.
And you have opened this door when you brought yourself and your “research” to this forum – after you couldn’t defend your claims now it is too late to try to shut down the discussion:
if you can’t defend your claims, the passing time won’t do it for you.
Thanks to your foray onto this forum – you have proved to the world who you are – showing
your ARROGANCE based on your staggering ignorance when trying to discredit James Hansen’s work:
“ Again, the work presented in [Hansen’s] paper is based on a climate computer model that
has incorrect physics. The energy balance of these climate models is based on the
radiative forcing approach of the so called greenhouse gas effect. This effect is a fiction
and the radiative approach violates the laws of thermodynamics.” Nabil Swedan
Therefore, Nabil Swedan, the time already tested you – showed your arrogance, founded on your staggering ignorance, your inability to understand what you read, your inability to admit of being wrong and issue a retraction of all your papers you based on your ignorant assumptions.
And the time has shown, Nabil Swedan, that your place is among anti-vaxers, flat-earthers, 9-11 truthers, climate change deniers, moon-landing skeptics and other deluded.
And the journals that accepted and published your production – like “Entropy”. (Swedan, N. (2022). “Thermodynamic Analysis of Climate Change.” Published in Entropy, 25(1), 72.) –
and its publisher; the Multidisciplinary Digital Publishing Institute (MDPI). According to AI:
“many academics view MDPI as a “pay-to-publish” or borderline predatory publisher with fast turnaround times and variable peer review quality,”
Given the peer review MDPI did not NOTICED even one of the many major booboos of Nabil
Swedan – his beliefs that:
1. [W/m2] is not a power term, it is an energy term”
2. “the so-called greenhouse effect is a fiction”
3. CO2 does not absorb, or radiates, any LW radiation (consistent with N.Swedan lecturing James Hansen that “the radiative approach violates the laws of thermodynamics “)
4. the only source of heat in the atmosphere is the heat of oxidation of C to Co2
5. all extra heat of oxidation of human CO2 emissions FROM THE LAST 250 years is still there – which implies that either the Stefan-Boltzmann law is wrong, or that none of the extra radiation from the warmer Earth over the last 250 years was able to make it into space.
6. and if none of the Earth energy can leave as LW radiation into space – also no solar radiation can be absorbed by Earth (otherwise 240 W/m2 of solar energy not reflected back into space and not radiated as LW radiation into space, would have boiled the Earth oceans long time ago)
saying that MDPI has “variable peer review quality” seems to be an understatement of the century.
Piotr,
You should look at my paper’s content and compare it with observations on the ground, not the publisher’s resume.
https://www.mdpi.com/1099-4300/25/1/72
In Table 1 of this paper, the calculated average reduction in the geopotential height of the stratosphere at 100 hPa is between 44 and 67 m per decade. For comparison, observed and reanalysis-tracked reductions in the lower stratosphere (near the 100–50 hPa layer) reach up to 100 m per decade, as documented by Pisoft et al., 2021 (https://www.columbia.edu/~lmp/paps/pisoft+etal-ERL-2021.pdf).
The thermodynamic model yielded a reasonable figure close to the observed physical reality, especially given that the paper is designed to offer foundational guidelines for climate change related calculations.
in Re to Piotr, 12 Sep 2026 at 7:08 PM,
https://www.realclimate.org/index.php/archives/2026/08/koonins-temperature-of-the-lol-stratosphere/#comment-851040
Hello Piotr,
I have not checked if other articles in “Entropy” are of similarly poor quality as Nabil’s one, however, I suspect that it may apply at least for the “special issue” wherein Nabil’s article was published.
The guest editors invited for this special issue, Igor Khmelinskii and Leslie V. Woodcock, authored themselves articles in the same style as Nabil Swedan. For example, in their 2024 article “On earth system dynamics’ hypothetical “greenhouse effect”” published in Global Journal o Ecology,
https://dx.doi.org/10.17352/gje.000095 ,
they also compare annual heat production from fossil fuel combustion with heat capacity of Earth’s atmosphere and on this basis assert that this contribution to Earth’s warming cannot be considered negligible. It is basically the same nonsense as in Nabil’s article (which is cited as reference 2), based on the assumption that Earth can be treated as an isolated thermodynamic system.
Perhaps to become original, on page 7 of their text, the authors seem to invent another original cause for the observed global warming, namely water vapour emissions from hydrocarbon combustion:
“The water emissions shown for example in Table 1 may not support GGH, and yet they are neglected in references [10-13] and in computer models of the global energy-budget equation (1). We note that the steep increase in replacement of coal by natural gas, that besides a 25% higher enthalpy output per mole of CO2, burning natural gas results in twice as much water emission per mole of CO2 than hydrocarbons: this may not be a
negligible contribution to a global effect of reducing the mean barometric pressures that could then cause ‘climate change’ by global wetting, rather than global warming.”
From the fact that pressure differences drive atmospheric motions, they infer a bold hypothesis that the said water vapour emissions from hydrocarbon fossil fuels may cause the observed global warming by “reducing the mean barometric pressures”.
I should add that this article did not issue on April 1 – its title page says:
Received: 26 February, 2024
Accepted: 08 March, 2024
Published: 09 March, 2024
The authors seem to be used to recycle similar content as in their 2023 preprint
https://www.researchgate.net/publication/370584398_Laws_of_thermodynamics_challenge_greenhouse-gas_and_climate-change_hypotheses
(that has been already cited by Nigel) again and again, see further remarkable 2025 opus published in predatory “Journal of Modern Physics”
https://www.scirp.org/journal/paperinformation?paperid=142247 or
https://doi.org/10.4236/jmp.2025.164035
They seem to be part of an entire pseudoscience ecosystem that creates a strange “alternative information universe”. I recommend looking also at references cited in their articles, like “Carbon dioxide: sometimes it is a cooling gas, sometimes a warming gas” issued 2018 in Forestry Research and Engineering: International Journal
https://medcraveonline.com/FREIJ/FREIJ-02-00043.pdf ,
asserting
“The gas laws applied to the gases in the atmosphere show CO2 is a warming or a cooling gas depending on the time of year regardless of its concentration. Radiation warming from CO2 is a small part of back radiation, which is the total radiation back to the Earth from all of the greenhouse gases. As shown in Figure 1, the portion of back radiation by CO2 is very small compared to the total, approximately 0.6%. Virtually all of back radiation comes from water vapour and it acts opposite to that of CO2. Thus, while CO2 is trying to warm the atmosphere, water vapor is cooling it and vice versa”.
Greetings
Tomáš
Nabil Swedan – “ Piotr, You should look at my paper’s content and compare it with observations on the ground, not the publisher’s resume.”
You still understand nothing – I didn’t dismiss your paper just because you published in a untrustworthy journal, but I consider the journal untrustworthy – because they publish you article based on absurdly fallacious assumptions
Why are these fallacious assumptions – I have already written in the post to which you are supposedly “reply”, See the footnote.
NS: “ compare it with observations on the ground,
That’s what I already did – have proved that your “thermodynamic approach”, AFTER correcting for your fallacious assumptions is NOWHERE near the actual observations (see below).
Furthermore, YOUR ENTIRE CLAIM TO FAME – the supposed similarity of your 2.57 W/m2.
to IPCC AR5 2.64 W/m2 – is not a proof of the validity of your “thermodynamic approach” – even a broken clock is right twice a day, particularly if its promoter pushes manually the hands of the clock -to be “in agreement” with the working clocks.
And you manipulated the input by calculating the oxidation heat of production of ” 99.91 ppmv.” – i.e. from the ENTIRE 1750 to 2005 period and then you divided this number by Earths area and …. the number of seconds in a single year !(2005). Which would be correct ONLY
a) if the CO2 have increased by that 99.91 ppmv. IN THAT SINGLE YEAR, or
b) if all the heat of oxidation from the last 255 years WAS STILL WITH US, i.e. if NO ENERGY from the last 255 year was lost to space
That you based you many papers on THAT fallacy – proves HOW IGNORANT you are, and what’s the credibility quality of the journal that published your “work”, and the credibility of the peer-reviewers who saw no problem in that.
And until you officially RETRACT all your papers based on these absurd assumptions” – their content is GIBBERISH pretending to be a scientific texts, and you are responsible for producing it, and doubling down on it. And no – no passage of time would magically fix your fallacies.
P.S. WHY for your comparison with the observation in the IPCC AR5 you have chosen on your source the OLDER data (2005) INSTEAD of 2011? Was it because it 2005 would better fit your “proof of equivalence”:
as your 2.57 W/m2. was practically “ equal to the total radiation imbalance at the top of the atmosphere ” of 2.64 W/m2 from 2005, but … not so equal to +2.83 W/m2 from 2011?
And no, you can’t claim that you didn’t have the 2011 data at your disposal – since both of them are present, and in fact contrasted – in AR5 Table 8.2 you refer to in your paper.
Aren’t you “among the most intelligent eye for detail people on the planet” as praised by your defender, Kobayashi Multitroll (KM) ?
========= footnote: Fallacious assumptions of Nabil Swedan ==========
:Your 2003 “Entropy” (MDPI) article uses several fallacious assumptions, namely:
1. that the greenhouse effect “is a fiction”
2.that CO2 does not absorb, or radiates, any LW radiation (consistent with N.Swedan lecturing James Hansen that “the radiative approach violates the laws of thermodynamics “)
3.. that the only source of heat in the atmosphere is the heat of oxidation of C to Co2
4. that all extra heat of oxidation of human CO2 emissions FROM THE LAST 255 years is still there – which demands that either the Stefan-Boltzmann law is wrong, or that none of the extra radiation from the warmer Earth over the last 250 years was able to make it into space.
5. if none of the Earth energy can leave as LW radiation into space – you are also assuming that no solar radiation is absorbed by Earth (otherwise, at 240 W/m2 – it would have boiled the Earth oceans long time ago)
And then you defended the above fallacies by claiming
– “No, Sir, and this is your confusion. Chapter 8 of IPCC AR6 is clear, [W/m2] is not a power term, it is an energy term. “– Nabil Swedan
When even your defender KM told you that you are wrong, you blamed YOUR claim that ” [W/m2] is not a power term” on …. the IPCC.
Ladies and Gentlemen – Nabil Swedan, a self-declared “expert in the field“, and ” among the most intelligent eye for detail people on the planet” (c) Kobayashi Multitroll. (KM)
Tomas: “ I have not checked if other articles in “Entropy” are of similarly poor quality as Nabil’s one ”
Doesn’t matter – the chain is only as strong as its weakest link, so the credibility of the publisher (MDPI) and its ” Entropy” journal – is only as strong as the most absurd paper they allowed to sl[p trough their “peer-review” and never retracted.
in Re to Nabil Swedan, 13 Sep 2026 at 1:05 PM,
https://www.realclimate.org/index.php/archives/2026/08/koonins-temperature-of-the-lol-stratosphere/#comment-851049
Dear Nabil,
With a friendly reminder that you failed to respond reasonably to previous objections, namely
(i) that your article is based on fundamentally false, unphysical assumption (that Earth can be treted as an isolated thermodynamic system) and
(ii) that the allegedly good fit of the radiative forcing calculated on this basis with observation resulted from a trivial calculation error,
let me shortly comment on your present drift to another alleged fit of your results with observations.
For the sake of brevity, I will let aside the equally unphysical assumption that gravity pumps heat from the stratosphere to Earth’s surface and will focus only on the alleged fit of your calculated “reduction in the height of lower stratosphere” with reanalyses published by Pišoft et al.
According to your article, this “height reduction” is defined as a change in the height of the gravity centre of the stratosphere and the respective value of this change for the decade 2010-2020 is 67 m:
“As discussed in the theory section, an amount of heat that is equal to dnH2O µH2O = 7.07 × 10¹⁹ dppmvCO2, Equation (5), is denied to the upper atmosphere. As a result, the heat content and potential energy of the upper atmosphere decrease equally, as demonstrated in the calculation method section. The total mass of atmospheric air is M = 5.18 × 10¹⁸ kg, and the mass of the upper atmosphere is nearly equal to 25% of the total mass of the atmospheric air [9]. Its center of mass lies in the lower stratosphere. Therefore, average reduction in the temperature of the lower stratosphere = −(dnH2O µH2O/2)/[0.25 M CPA] = −[7.07 × 1019 × (414.24−390.10)/2]/[0.25 × 5.18 × 1018 × 1000] = −0.66 °C d−1, line 19. Average reduction in the height of the lower stratosphere = −(dnH2O µH2O/2)/[0.25 M g] = −[7.07 × 10¹⁹ (414.24 − 390.10)/2]/[0.25 × 5.18 × 1018 × 9.8] = −67.24 m d−1, line 21.”
A look at Figure 1 in the article published by Pišoft et al, however, reveals that the decrease in stratosphere thickness resulting from their theory consists of two roughly equal contributions, namely of an increase in tropopause height and of a decrease in stratopause height. In this respect, I doubt that the centre of stratosphere mass declines in the model published by Pišoft et al.
As regards the absolute value of the increase in tropopause height resulting from reanalyses shown in Pišoft’s Fig. 1, it can be roughly estimated as 130 m per decade.
In this respect, you consider a comparison of 130 m INCREASE in tropopause height (resulting from reanalyses shown in Pišoft’s Fig. 1) with 67 m DECREASE in the height of the gravity centre of the entire stratosphere (calculated by you) as a support for your claims. Somewhat difficult comparison, and a quite bold conclusion derived therefrom, I would say.
Moreover, your article is in fact completely silent about pressure levels defining stratosphere boundaries and/or its “center of mass”. For this reason, your assertion
“In Table 1 of this paper, the calculated average reduction in the geopotential height of the stratosphere at 100 hPa is between 44 and 67 m per decade.”
can be hardly understood other way as a brazen lie. And, contrary to your assertions, the 100 hPa pressure level seems to be rather in tropopause than in stratosphere, and rather moving upwards than downwards, as you could have read from Fig. 3 in Pišoft’s article.
To sum up, the result of your further attempt to evade previous critique could be characterized by Czech proverb “the more you smear yourself with shit, the more it stinks”.
Best regards
Tomáš
patrick “It’s more complicated than it needed to be to respond to Nabil Swedan)
yes, patrick, you are swatting a fly with a microscope.
All that is needed is to point that Swedan calculates his “thermodynamic forcing” in 2005 – as the heat of C oxidation from …. ALL the surplus CO2 since 1750!.
In other words, the guy assumes that ALL heat of oxidation released since 1750 is … still with us, (NONE of it escaped into the space over 255 years) and argues that the time will vindicate him ;-)
Tomáš Kalisz says:
https://www.realclimate.org/index.php/archives/2026/08/koonins-temperature-of-the-lol-stratosphere/#comment-851102
Reply Tomáš Kalisz
First, the earth is not treated as an isolated system in my work. It is a closed thermodynamic system. Second, Figure 1 of Pitsoft et al. (2021) shows clearly a reduction in stratospheric height. Their abstract’s hallmark is the contraction of the stratosphere. If you can’t see all these, then what is the purpose of having any discussion with you?
Piotr Says:
https://www.realclimate.org/index.php/archives/2026/08/koonins-temperature-of-the-lol-stratosphere/#comment-851098
Reply: Why do you assume that the energy consumed by humans is radiated to outer space; at the same time, the heat trapped by greenhouse gases remains in the surface? Can you not be consistent for both?
I am going to reiterate my understanding of Radiative Forcing (RF) based on IPCC, AR5 report. Please refer to Figure 8.19 and the text around it: “Over the period 1951–2011 the trend in anthropogenic forcing is almost 0.3 W/m2 per decade and thus anthropogenic forcing over this period is more than 1.5 W/m2.” Please note that 1.5 W/M2 is the total RF. You can see in this total time is factored in. 1.5 W/m2 is not instantaneous power, it is energy because it includes time in it. It is similar to KW-hr. Please read the rest of the text and figure legend, and you will find that 2.7 W/m2 in 2026 is the total anthropogenic forcing in Joules, not an instantaneous power. It includes the years in it like KW-hr.
Unfortunately many, even in some AR6 boxes, climatologists have not been consistent with AR5, by showing radiative forcing as an instantaneous power. It is like forgetting the “hr” from KW-hr.
With this additional clarification, between 1951 and 2011, the total RF of 1.5 W/m2 is equivalent to 2.4E22 J, or nearly an average of 2.4E20 J/year. Clearly radiative forcing and energy production are equal.
[Response: This is so bone-numbingly stupid, I really can’t believe it. Watts are different from Joules. You can’t simply assume a time is or isn’t mentioned but is secretly there (or not). It’s like radiative forcing is on super-secret double probation or something. Enough. – gavin]
NS: Why do you assume that the energy consumed by humans is radiated to outer space; at the same time, the heat trapped by greenhouse gases remains in the surface?
BPL: It doesn’t remain in the surface. It’s radiated away, like any other heat.
I don’t think you’re clear on how the greenhouse effect works. If you want a mathematical illustration, please let me know.
Nabil Swedan, your theory is that global warming over the last 250 years or so is adequately explained by waste heat and doesn’t require a greenhouse effect to explain anything. And good on you for exploring the idea. I have no problem with that. But my understanding is the amount of waste heat released each year over the last 250 years cannot explain the 1.3 degree c approx. rise in global temperature over that period, and the current 2.5w/ m2 forcing, UNLESS the waste all remains trapped in the earths system. Do you accept that in general terms?
Assuming you accept what I said, and given that the thermodynamic law says heat flows from hot to cold all the heat would quickly be lost to space, UNLESS something keeps it in the atmosphere. So since you say theres no such thing as a greenhouse effect, what in lay persons terms are you claiming keeps all that heat within the earths system, particularly the atmosphere? Maybe its in your paper but I lack the expertise to fully understand your paper. So can you explain it in simple lay persons terms please?
in Re to Nabil Swedan, 18 Sep 2026 at 1:44 PM,
https://www.realclimate.org/index.php/archives/2026/08/koonins-temperature-of-the-lol-stratosphere/#comment-851127
Dear Nabil,
If you mean your reply seriously, not as a continuation in trolling by pretending ignorance, I would like to tell you that treating Earth as a closed thermodynamic system exchanging with the Universe only electromagnetic radiation is incompatible with basic assumption of your article that the heat released by fossil fuel combustion during industrial era can be excluded from this radiative energy exchange and thus might somehow miraculously accumulate on Earth’s surface.
In this respect, I am afraid that your counter-objection expressed in your reply to Piotr (that theory of greenhouse effect allegedly treats Earth the same way as you) is based on an analogous fallacy, wherein you incorrectly assume that radiative forcing is identical with an amount of “energy absorbed by Earth”, while this absorbed energy, measurable for example as a change in ocean heat content, is in fact an area and time INTEGRAL of a net power flux (which results from a combination of various radiative forcings and its average over entire Earth’s area is, unfortunately, called “Earth energy imbalance” instead “Earth power flux imbalance”).
Regarding Pišoft et al, their THICKNESS of Earth’s stratosphere is not the same as your “stratosphere HEIGHT”, as you might easily recognize if you would have read the cited article (and, maybe, also your own article) carefully.
Greetings
Tomáš
Nabil Swedan: “First, the earth is not treated as an isolated system in my work., It is a closed thermodynamic system.”
Then you don’t understand even your own work – in your work you calculated the anthropogenic heating in 2005 from the heat of oxidation of C to CO2 of ALL surplus Co2 accumulated since 1750. THE ONLY way this to be valid is if NONE of that heat since 1750 has left the Earth. How do you call a system that exchanges neither matter nor energy </i< with the outside?
P.S. You might ask for the refund of the money you have sent to the journal "Entropy" for printing your scientific delusions. Then again, predatory journals live from the people like you.
Nabil Swedan 18 Sep
“ Why do you assume that the energy consumed by humans is the radiated to outer space; at the same time, the heat trapped by greenhouse gases remains in the surface? Can you not be consistent for both?”
You understood nothing, again. The fact that 240W/m2 of LW radiation is radiated into the space – does NOT contradict the existence of greenhouse effect. As I have already explained to you e.g. UV, Piotr, 26 Aug 2026 at 9:12 PM
Nabil Swedan: I am going to reiterate my understanding of Radiative Forcing (RF) based on IPCC, AR5 report. “Over the period 1951–2011 the trend in anthropogenic forcing is almost 0.3 W/m2 per decade and thus anthropogenic forcing over this period is more than 1.5 W/m2.”
So? “ the trend in anthropogenic forcing is almost 0.3 W/m2 per decade” = just means that AF at the end of the decade was almost 0.3 W/m2 higher than at the beginning of the decade. So if anything – trend is dividing W/m2 by time, NOT multiplying W/m2 by time (here the number of seconds in a decade), as your conversion of Watts into Joules requires.
Nabil Swedan: ” You will find that 2.7 W/m2 in 2026 is the total anthropogenic forcing in Joules, not an instantaneous power.
We will find it only in your brain, Nabil. For everybody else, Watts are still units of power = J/s, hence NOT energy, not ” in Joules”.
Nabil Swedan “Please note that 1.5 W/M2 is the total RF. You can see in this total time is factored in. 1.5 W/m2 is not instantaneous power, it is energy because it includes time in it. ”
Read the labels of your own figure Fig. 8-19, Genius. The total RF is the sum of natural RF + anthropogenic RF, not some imaginary RF integrated over “total time”. Hence no change in units – adding W/m2 to W/m2 does not magically change them into J/m2.
And now we can return to my text to which you are supposedly replying:
=== Piotr says 16 Sep 2026 at 4:11 PM =================
Nabil Swedan: “compare it with observations on the ground”
That’s what I already did – have proved that your “thermodynamic approach”, AFTER correcting for your fallacious assumptions is NOWHERE near the actual observations (see details in the original post).
Furthermore, YOUR ENTIRE CLAIM TO FAME – the supposed similarity of your 2.57 W/m2.
to IPCC AR5 2.64 W/m2 – is not a proof of the validity of your “thermodynamic approach” – even a broken clock is right twice a day, particularly if its promoter pushes manually the hands of the clock -to be “in agreement” with the working clocks.
And you manipulated the input by calculating the oxidation heat of production of ” 99.91 ppmv.” – i.e. from the ENTIRE 1750 to 2005 period and then you divided this number by Earths area and …. the number of seconds in a single year !(2005). Which would be correct ONLY
a) if the CO2 have increased by that 99.91 ppmv. IN THAT SINGLE YEAR, or
b) if all the heat of oxidation from the last 255 years WAS STILL WITH US, i.e. if NO ENERGY from the last 255 year was lost to space
That you based you many papers on THAT fallacy – proves HOW IGNORANT you are, and what’s the credibility quality of the journal that published your “work”, and the credibility of the peer-reviewers who saw no problem in that.
P.S. WHY for your comparison with the observation in the IPCC AR5 you have chosen on your source the OLDER data (2005) INSTEAD of 2011? Was it because it 2005 would better fit your “proof of equivalence”: as your 2.57 W/m2. was practically “ equal to the total radiation imbalance at the top of the atmosphere ” of 2.64 W/m2 from 2005, but … not so equal to +2.83 W/m2 from 2011?
And no, you can’t claim that you didn’t have the 2011 data at your disposal – since both of them are present, and in fact contrasted – in AR5 Table 8.2 you refer to in your paper.
Aren’t you “among the most intelligent eye for detail people on the planet” as praised by your defender, Kobayashi Multitroll (KM) ?
===================
Nabil Swedan,
Holy crap! Really, does your entire thesis come down to not understanding the units of the quantities you using? Dude, crack a baby physics text.
Postings by NS make me think of the good old days when The Crankshaft could serve as a repository for such material. His confused treatment of time makes it clear that time will NOT tell for his calculations. Without proper treatment of time, any thoughts about thermodynamics are rubbish.
To re-work one example with the proper dimensions:
NS: “With this additional clarification, between 1951 and 2011, the total RF of 1.5 W/m2 is equivalent to 2.4E22 J, or nearly an average of 2.4E20 J/year. Clearly radiative forcing and energy production are equal.”
JP: Calculation for the year 2011 ONLY, when average RF had reached 1.5 W/m2 goes as follows
1.5 W/m2 X
5.1 E14 m2 (area of the Earth) X
3.125 E7 sec/yr = approximately 2.4 E22 W sec/yr
but 1 Joule = 1 W sec, so
Energy of RF for the entire Earth (integrated over the year 2011) = 2.4 E22 J
Joules are units of energy. Watts are Joules/sec and units of power.
This should have been explained early in first-year physics.
N Swedan: “First, the earth is not treated as an isolated system in my work. It is a closed thermodynamic system.”
This is a distinction without a difference. Reading TKs comments its obvious he was disputing that earth’s atmosphere is a closed thermodynamic system. He just used the term isolated system meaning the same as closed thermodynamic system.
And clearly earth it isnt a closed thermodynamic system as energy enters the system from the sun and leaves the system to space. If it didn’t Earth would have boiled by now. So his theory is based on a false premise.
The greenhouse effect means some incoming energy is retained in the system. A little bit analogous to how fiberglass insulation works.
In Re to Nigelj, 19 Sep 2026 at 4:49 PM,
https://www.realclimate.org/index.php/archives/2026/08/koonins-temperature-of-the-lol-stratosphere/#comment-851134
and
20 Sep 2026 at 7:09 PM,
https://www.realclimate.org/index.php/archives/2026/08/koonins-temperature-of-the-lol-stratosphere/#comment-851148
Hello Nigel,
It appears that my comments caused some confusion which I would like to correct.
1) Definitions
Nabil is correct that closed thermodynamic system does not exchange matter with its surrounding but can exchange energy, while isolated system does not exchange matter nor energy. At the very start of my exchange with him, I incorrectly used the term “closed” instead of “isolated” for the approach used by Nabil with respect to Earth and its alleged warming by heat produced by fossil fuel combustion.
2) How it could have happened that Nabil treats Earth as an isolated thermodynamic system and still believes that he treats it (correctly) as a closed system?
I think that based on Nabil’s responses to raised objections, I finally grasped that his confusion may be somewhat more complex and deeper-rooted than I thought originally. My present understanding to him is as follows:
(i) Nabil is aware that Earth receives energy from Sun and emits it to the Universe. He, however, assumes that if we investigate a human perturbation inflicted to this steady state, we can consider all natural energy flows as constant, and he further assumes that the remaining anthropogenic forcing directly converts in the “excess energy” that finally manifests as an observable warming.
(ii) So far so good, this approach formally resembles the standard “bookkeeping” of the global warming, wherein the observed rise in Earth’s heat content (measured by Argo buoys as ocean heat content (OHC), combined with latent heat calculated from the observed ice melting) fits with time integral of the Earth energy imbalance (EEI) measured by CERES satellites.
(iii) There are, however, two crucial differences between Nabil’s approach and correct energy accounting:
a) Nabil arbitrarily excluded key forcings that may be suspected as anthropogenic (like changing atmospheric concentration of greenhouse gases, changing atmosphere pollution with aerosols, changing surface albedo, changing cloud cover and/or changing latent heat flux) from consideration, as if they all were either non-existent or could be also considered constant. This way, he obtained, as the sole remaining option, the tiny forcing of the order 0.01 W/m2, corresponding to the heat flux caused by anthropogenic combustion of carbon-containing fuels (wherein this combustion comprises both fossil fuels as well as biomass considered to disappear because of land deforestation);
b) Nabil assumes that this forcing is equal to EEI, in other words, he does not consider any feedbacks including the Planck feedback and calculates the energy supposed to accumulate in Earth’s climate system as if the assumed absorption of this anthropogenic combustion heat would have caused zero warming (and thus no increase in the outgoing infrared radiation emitted from Earth to space).
3) Possible roots of Nabil’s delusion
Although I originally thought that a such collection of mutually conflicting, absurd, physical nonsense cannot result from anything else than from deliberate trolling, now I admit that it may be also product of self-delusion caused by denial of greenhouse effect as allegedly “violating second law of thermodynamics”.
This frequent, seemingly convincing mantra of pseudo-scientific denialists is based on misinterpretation of the rule that between two bodies in mutual contact, heat spontaneously flows from the warmer one to the colder one. Greenhouse effect denialists “extrapolated” this rule the way that thermal radiation from colder upper atmosphere allegedly cannot “warm” warmer Earth’s surface. This assertion is, however, incorrect because the rule in fact applies only to “net radiation” (which is a difference between the radiation emitted from the warmer body to the colder one, and the radiation emitted from the colder body in the opposite direction).
I admit that it remains unclear how Nabil dismissed the other relevant anthropogenic radiative forcings like aerosols or human influence on Earth’s albedo, as he has not provided any hint in this direction yet.
4) Further remarks
– With respect to your assertion “all the heat would quickly be lost to space, UNLESS something keeps it in the atmosphere”, I am afraid that it is very ambiguous. If you mean the rate of global mean surface temperature (GMST) decrease towards new steady-state GMST in a hypothetical case that all non-condensing greenhouse gases suddenly disappear from Earth’s atmosphere, I assume that it could take several centuries or millennia due to heat release from the ocean. I am not sure if this is what you consider as “quick”. If you could, in parallel, remove also all water, I assume that establishing the new steady-state GMST would be several orders of magnitude quicker.
– With respect to your sentence “The greenhouse effect means some incoming energy is retained in the system.”, I would rather say “Higher greenhouse effect increases steady-state energy of the system in comparison with smaller greenhouse effect”, because even in total absence of all greenhouse gases including water, Earth would still establish a steady state with certain energy content.
– The analogy between the effect of greenhouse atmosphere and the effect of fiberglass insulation is very good, I think.
Greetings
Tomáš
On Thermodynamics of GHE: If you take two perfect blackbody surfaces at the same T, they will emit the flux densities (F) of the same value; if they face each other, they will each absorb the other’s emitted flux. The flux densities in both directions are equal so there is no net flux between them (net flux density = 0). If one is warmer than the other, there will be a net flux density from the warmer blackbody surfaces to the colder blackbody surface, but this is the difference between two opposing gross flux densities of unequal magnitude. You may think of these gross flux densities as being analogous to the forward and reverse rates of reaction in a chemical reaction; generally neither is 0.
GHGs make the atmosphere appear as a colored incandescently-glowing fog in colorized heat vision; their effects are equivalent to a cloud of tiny blackbody particles with orthographically-projected areas (absorption cross sections σ_a) but with a size that is strongly dependent on wavenumber (hence the color; flux densities are thus best understood by considering spectral flux densities F_ν (= integrated spectral radiance L_ν · cos(angle from vertical) over solid angle) and then integrating over wavenumber or wavelength … or photon energy or however you measured the spectral intervals). Cloud particles obviously also have σ_a values. With T generally decreasing with height, the downward LW flux density LW F↓ is generally smaller than the upward LW flux density LW F↑, but it reduces the net upward LW flux density. As seen from Space looking down, the LW emission from the surface (sfc) is, in much of the spectrum, least partially hidden/blocked by the atmosphere’s opaqueness, replaced by the generally cooler, dimmer emissions of said atmosphere; the height range of the source of that emission (ie how far down you can see into the atmosphere; a flux-weighted emission weighting function (flux-weighted EWF, or FEWF) varies over the spectrum and with cloud cover.
(thermal radiation emitted by the atmosphere and sfc is nearly entirely in the LW part of the spectrum, whereas solar heating is mainly SW (cutoff ~ 4 µm = 2500 cm¯¹ or maybe a bit longer/lower); this is primary spectral bandwidth categorization relevant to climate science.)
The GHE has the effect of producing an overall upward vertical displacement of where LW cooling to Space (CTS) occurs
(note where this occurs in terms of W/m² per mb or W/kg is modulated by the T distribution within the FEWF seen from Space, but the location/distribution of the FEWF is very important in this).
Relative to the distribution of solar heating (last I checked ~ 2/3 of solar heating occurs at/within sfc material).
Thus a flux internal to the climate system, from the later to the former, is necessary to achieve balance, and so the temperature at the sfc and lower atmosphere must be generally/effectively warmer than the effective T value of the FEWF(seen from Space) in order to drive that flux.
In the case of Earth in near present conditions, the T distribution required to drive this internal flux as a purely LW flux (equilibrium climate = PRE) would be unstable to convection, so instead we have a troposphere within which that internal flux has a convective and radiative component (equilibrium climate = RCE). The actual climate system is more completely described as 4+-dimensional, with horizontal, diurnal and seasonal variations in forced solar heating as well as internal variability (weather, ENSO, etc.), so an equilibrium climate could be described as *RCASE*, with various fluxes and conversion rates of energy (heat, kinetic energy) and momentum and mass (conversions of H2O among phases) which are not always spatially balanced (nonzero storage terms) but the fluxes and imbalances form a pattern/texture characteristic of that climate state, and the storage terms tending to 0 in the time average.
A change in forcing introduces an (additional) imbalance in the system and equilibration will involve a response that makes that imbalance decay. (said imbalance could be 0 in the global time average but still have important effects – consider orbital cycles (not exactly 0 but my understanding is the main importance comes from their regional and seasonally-varied forcing).
A radiant/radiative forcing** is conveniently described in terms of the imbalance, eg, the TOA value of W/m² change in the outgoing LW flux, or the solar heating.
Note the later is modulated by clouds, snow cover, etc., and the former by temperature distribution as well as clouds and humidity, etc, so the forcing by a change in Earth’s orbit or atmospheric CO2 amount will depend on the climate, which means it is possible for the same imposed change in forcing agent to have a different W/m² value when reversed from a changed climate after equilibration to some initial ‘forward change’ but, assuming no hysteresis, this will be made up for by a change in equilibrium climate sensitivity (ECS)…
Anyway, if a forcing has some W/m² value, the climate will respond to restore balance, but we can regard the forcing as still being in place; ie, the climate response is a W/m² flux change that approaches the W/m² forcing over time. So the forcing since 1750 CE minus the climate response to that forcing is the heating rate.
**(forcings could also involve changes in the topography of the sfc, the Coriolis effect, or gravity (hypothetically, although the 1st two do change over geologic time) (Some things that in shorter time periods would be considered as boundary conditions and thus potentially agents of forcing, become interactive with climate over longer time periods, eg. ice sheets, erosion rates.)
– corrections/clarifications:
(Did I get this part right? It’s more complicated than it needed to be to respond to Nabil Swedan):
In the case where the global time-average (eg annual average, or long enough to characterize a climate state), radiative forcing ((gta-)RF) is an important measure of the forcing, then the remaining global time-average flux imbalance (=forcing – response) is an an important measure of the climate disequilibrium, ie the difference between the equilibrium climate (for the given forcing) and the present climate. In this case that imbalance decays toward 0; given some approximations and simplifications this would tend to be an exponential decay with a time scale proportional to (I think it may be equal to, actually) the ECS and the effective heat capacity; complications to that involve long time scales of some feedbacks and the availability of said heat capacity (ie./eg. ice sheet dynamics, deep ocean overturning, etc.) and I believe maybe also the distinctions between IRF, SARF, and ERF (parts of the atmosphere respond faster, but will respond again to other changes).
For regional time-average RF, imbalances would have to decay but that could include changing horizontal transports of heat (vertical fluxes by themselves can remain unbalanced); for a cycled RF there would tend to be a remaining imbalance cycle because of a phase-lag in the response. I’m not prepared to generalize how the climate evolves in response to other types of forcings, though sizable changes in mountain ranges or especially the Coriolis effect are so slow that we can approximately assume the climate is equilibrated to them.
—
If they both take place entirely on an infinitely thin surface, then the GHE is eliminated (not including any surface emissivity limitations (ie LW albedo) as part of the GHE). Even if the two distributions match, however, any thickness … well, the lowest solar heating still needs an upward flux to balance it… consider the difference between CTS and FEWF(seen from Space)… okay, I’m not sure offhand.
It’s interesting to consider the case where that FEWF is below the solar heating but I’ll not go there here. One can consider a GHE within solid or liquid material ie. solar heating within a frozen ice layer with CTS taking place closer to the sfc, heating driving geyser activity, on a cold moon of the outer-solar system.
—
PRE, RCE, ‘RCASE’:
https://www.realclimate.org/index.php/archives/2026/07/unforced-variations-july-2026/#comment-850105 :
(… https://www.realclimate.org/index.php/archives/2026/07/unforced-variations-july-2026/#comment-850147 …)
https://www.realclimate.org/index.php/archives/2026/07/unforced-variations-july-2026/#comment-850181 :
… time scale proportional to (I think it may be equal to, actually) the product of the ECS and the effective heat capacity; …
If arguments could stop the more or less open climate ignorants (“sceptics”), they would surely have disappeared long time ago. But the contrary is obviously the case, and with the heroic efforts of artificial “intelligence”, we can only expect endless multiplications of the same nonsense. I think the endless repetitions of these “discussions” – you can’t have a discussion when only one part is arguing seriously – is without any value concerning the serious matters: the accelerating climatic destabilization and it’s catastrophic consequences for life on this planet, now seen in Nepal, Europe etc., but only to be stupidly sentimentalized and in fact downplayed and hastily buried in nonsense by the more and more silently Trump-normalizing media-/entertainment-industry, which is in fact sneaking fascism and barbarism upon us, controlled as it is by the fossil and tech oligarchs. The bitter facts are, that we are losing to the barbarians, they have all the power and in the public sphere most humans obviously only wants to bury the science and be lied to. Cheap crap is all.
I no more see any realistic way out of this hell. Homo sapiens has no future, The psychopaths and the mad are about to gain control of everything of importance, and nothing in sight can stop them, there is no will, only talk, talk, talk about the same, marching backwards, beating around the bush all the time. We seem to have reached a time when the second-best thing is to be dead, and the best thing is never to have been born. Experience has no meaning, when nobody is listening. The consequence is the triumph of fascism in the form of runaway A”I” mega-/MAGAlomaniacs hiding their plan for the end solution to the human question behind the facade of programming competition “in the marketplace” etc.