• Skip to primary navigation
  • Skip to main content
  • Skip to primary sidebar
  • Skip to footer

RealClimate

Climate science from climate scientists...

  • Start here
  • Model-Observation Comparisons
  • Miscellaneous Climate Graphics
  • Surface temperature graphics
You are here: Home / Archives for rasmus

About Rasmus Benestad

I am a senior scientist working at the Norwegian Meteorological Institute with a background from physics. My scientific career started with a degree in Physics with Electronics at UMIST in Manchester (UK), cloud micro-physics at New Mexico Tech (USA), and ocean physics at Atmospheric Oceanic and Planetary Physics (AOPP) at Oxford University (UK). Since then, I have also got heavily involved in the field of statistics, thanks to exciting collaborations with several statisticians.

My primary focus at the Norwegian Meteorological Institute has been towards climate change adaptation, empirical-statistical downscaling and anthropogenic climate change, but I have also worked on problems relating to natural climate variations connected to changes in the sun. I have authored two text books on these topics: Solar Activity and Earth's climate (Praxis/Springer) and Empirical-Statistical Downscaling (World Scientific Publishers).

My experience from the climate science community includes several roles: a contributing author on two past IPCC assessment reports, a person of contact (POC) for World Climate Research Programme's (WCRP) CORDEX project, a coordinating lead author on Arctic Monitoring and Assessment Programme's (AMAP) report Adapting Actions in a Changing Arctic (AACA, 2017), a councilor for the European Meteorological society (EMS), a member of the EMS communication and media committee, and part of the advisory board for Oxford Research Encyclopedia on climate. I also chair the professional network within the Norwegian trade union for engineer and natural scientists Tekna Klima, dealing with a diverse range of climate solutions.

An update on the Arctic sea-ice

26 Aug 2012 by rasmus

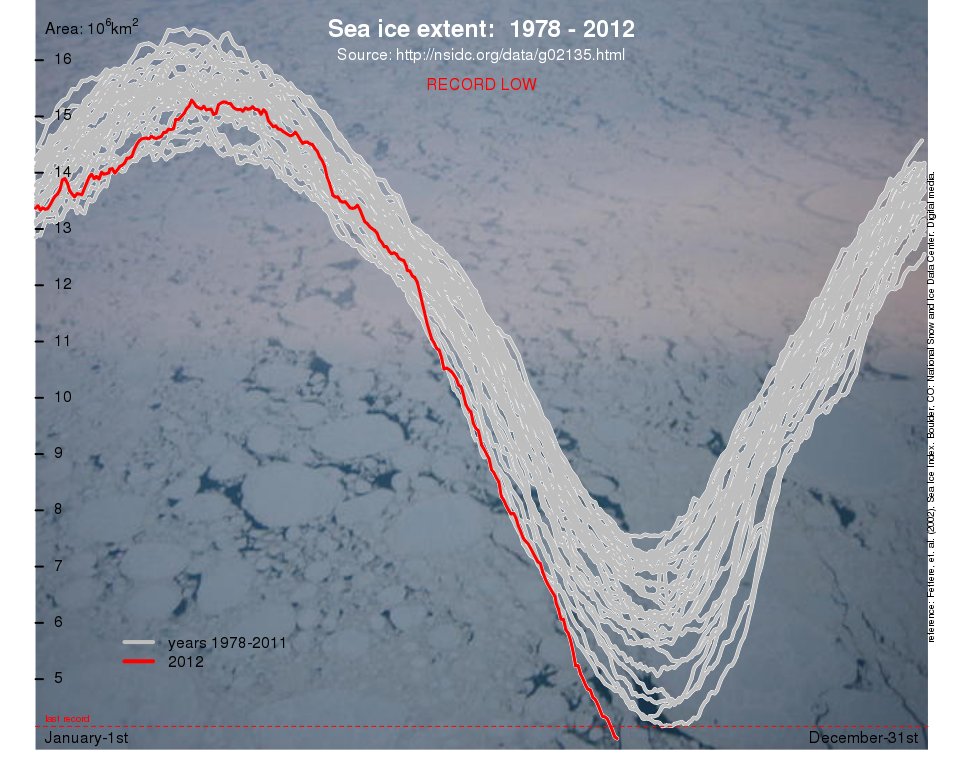
We noted earlier that the Artic sea-ice is approaching a record minimum. The record is now broken, almost a month before the annual sea-ice minima usually is observed, and there is probably more melting in store before it reaches the minimum for 2012 – before the autumn sea-ice starts to form.

The figure shows annual variations in the area of sea-ice extent, and the x-axis marks the time of the year, starting on January 1st and ending on December 31st (for the individual years). The grey curves show the Arctic sea-ice extent in all previous years, and the red curve shows the sea-ice area for 2012.

(The figure is plotted with an R-script that takes the data directly from NSIDC; the R-environment is available from CRAN)

UPDATE on the update The National Snow and Ice Data Center announced today (August 27th, 2012) that the 2007 record has now been broken by their more conservative 5-day running average criterion. They also note that “The six lowest ice extents in the satellite record have occurred in the last six years (2007 to 2012).”

Filed Under: Climate Science

Real Video

25 May 2012 by rasmus

Guest post by Kelly Levin, WRI; Paul Higgins, AMS; Brian Helmuth, University of South Carolina; and Andy Dessler, Texas A&M

Scientists have made massive progress in understanding the climate system and how human activities are altering it. Despite that progress, decision makers continue to struggle with climate change risk management.

RealClimate and other initiatives have shown that new media can be effective in enhancing communication of climate science. The speed by which new information can be transmitted has increased significantly, and new media has provided new learning opportunities, including discussion, debate, and links to further information.

This month, WRI, supported by google.org, launched a pilot project to further build the capacity of the scientific community to more effectively relay their recent scientific findings. The project stemmed from the Google Science Communication Fellow program, which aims to foster more accessible, open, and transparent scientific dialogue.

The project assesses whether video can be a compelling way for a scientist to describe his/her discoveries and, if so, which type of video works best. Imagine video being embedded one day into journal websites and Google scholar, not only offering the option of downloading a recent publication but also a video associated with the publication. Imagine videos sitting alongside newspaper and magazine articles, where you can hear about findings directly from the scientist in his or her own words. Like RealClimate, the project aims to connect viewers to the scientists themselves.

This project has the potential to improve scientific communication and enhance the public understanding of science. Ultimately, if done right scientific communication can help shape the public debate and lead to more informed decisions. That’s critical because societal decisions have the greatest chance to benefit the public when they are grounded in the best available knowledge and understanding. We need RealClimate’s reader’s help.

Please assist us in identifying the most effective means for communicating the latest findings of climate science via video. Go to http://www.wri.org/communicating-climate-science to watch the three videos.

Three scientists (also Google Fellows) — Andy Dessler from Texas A&M University; Brian Helmuth from University of South Carolina; and Paul Higgins from the American Meteorological Society – participated, and the videos showcase one of their recent studies that is either in production or recently published:

Dessler’s paper (Science, Vol. 330., http://geotest.tamu.edu/userfiles/216/dessler10b.pdf) focused on quantifying the cloud feedback. Using the ENSO to study changing cloud patterns during climatic variability, he found that the feedback is likely positive, consistent with the feedback that climate models yield.

Helmuth’s paper (Ecology Letters, forthcoming) examined the impact of variations in water and aerial temperatures on predator-prey interactions between sea stars and mussels in the intertidal zone. He and his colleagues found that predation rates decreased during non-coincident interactions between the two temperature stressors. Their paper underscores the need for taking into account temporal fluctuations in environmental stress, which can be ignored in experiments and models.

Higgins focuses on his recent research (Journal of Climate, in press) to more fully quantify the potential range in the terrestrial carbon cycle response to climate warming. This research suggests that plants and soils could release large amounts of carbon dioxide as global climate warms. That would push GHG concentrations higher and lead to even more climate warming. This is important because we’ve been counting on plants and soils to soak up and store some of the carbon we’re releasing.

Three videos were produced for each of the abovementioned papers:

  • The first is comprised of a slideshow of relevant images with a voiceover of the scientist discussing his finding.
  • For the second video, Dessler, Helmuth and Higgins filmed their own videos.
  • For the third video, Dessler, Helmuth and Higgins each came into WRI’s offices, and were filmed conducting a white board talk describing their findings.
  • Which video do you think works best? Click here to cast your vote and tell us about why you think it is most effective. Your votes will inform any scaling up of this project in the future.

    Filed Under: Climate Science

    Another fingerprint

    20 May 2012 by rasmus

    When my kids were younger, they asked me why the ocean was blue. I would answer that the ocean mirrors the blue sky. However, I would not think much more about it, even though it is well-known that the oceans represent the most important source for atmospheric moisture. They also play an important role for many types of internal variations, such as the El Nino Southern Oscillation. Now a new study by Durack et al. (2012) has been published in Science that presents the relationship between the oceans and the atmosphere.

    [Read more…] about Another fingerprint

    References

    1. P.J. Durack, S.E. Wijffels, and R.J. Matear, "Ocean Salinities Reveal Strong Global Water Cycle Intensification During 1950 to 2000", Science, vol. 336, pp. 455-458, 2012. http://dx.doi.org/10.1126/science.1212222

    Filed Under: Climate modelling, Climate Science, hydrological cycle, Oceans

    The legend of the Titanic

    3 May 2012 by rasmus

    It’s 100 years since the Titanic sank in the North Atlantic, and it’s still remembered today. It was one of those landmark events that make a deep impression on people. It also fits a pattern of how we respond to different conditions, according to a recent book about the impact of environmental science on the society (Gudmund Hernes Hot Topic – Cold Comfort): major events are the stimulus and the change of mind is the response.

    Hernes suggests that one of those turning moments that made us realize our true position in the universe was when we for the first time saw our own planet from space.

    [Read more…] about The legend of the Titanic

    Filed Under: Climate Science, Communicating Climate

    The IPCC SREX: the report is finally out.

    29 Mar 2012 by rasmus

    Some of us have been waiting quite a while now, especially since the ‘road tour’ meant to present the Special Report on Managing the Risks of Extreme Events and Disasters to Advance Climate Change Adaptation starting in Oslo on January 24th this year. The summary for policymakers (SPM) was released already in 18 November 2011 (Kampala) and now the report is finally available (link).

    [Read more…] about The IPCC SREX: the report is finally out.

    Filed Under: Climate Science, RC Forum, Reporting on climate, Reviews, statistics

    Data presentation: A trend lesson

    23 Mar 2012 by rasmus

    I just came across an interesting way to eliminate the impression of a global warming. A trick used to argue that the global warming had stopped, and the simple recipe is as follows:

  • Cut off parts of the measurements and only keep the last 17 years.
  • Plot all the months of these 17 years to get plenty of data points.
  • A good idea is to show a streched plot with longer time axis.
  • [Read more…] about Data presentation: A trend lesson

    Filed Under: Climate Science, Communicating Climate, Instrumental Record, Scientific practice, skeptics

    Free speech and academic freedom

    12 Feb 2012 by rasmus

    Update: Some related concerns from deepclimate.org, if these claims can be verified.

    In a recent interview for a Norwegian magazine (Teknisk Ukeblad, 0412), the IPCC chair Rajendra Kumar Pachauri told the journalist that he had received death threats in connection with his role as a head for the IPCC. There have also been recent reports of threats and harassment of climate scientists for their stance on climate change (Kerry Emanuel. Katharine Hayhoe, Australian climate scientists, Phil Jones, Barton campaign, and Inhofe’s black list).

    [Read more…] about Free speech and academic freedom

    Filed Under: Communicating Climate, RC Forum, skeptics

    The dog is the weather

    17 Jan 2012 by rasmus

    Update January 27: There is also another recent dog-based animations from Victoria (southeast Australia) explaining some of the key drivers of our climate and how some are changing.

    A TV series that ran on Norwegian TV (NRK) last year included a simple and fun cartoon that demonstrates some important concepts relative to weather and climate:

    In the animation, the man’s path can be considered as analogous to a directional climatic change, while the path traced by his dog’s whimsical movements represent weather fluctuations, as constrained by the man’s path, the leash, and the dog’s moment-by-moment decisions of what seems important to investigate in his small world. What might the leash length represent? The man’s momentary pause? The dog’s exact route relative to concepts of random variation? The messages in this animation are similar to the recent results of Grant Foster and Stefan Rahmstorf in ERL (see post here).

    We’d also like to praise the TV-series ‘Siffer‘, hosted by an enthusiastic statistician explaining how most things in our world relate to mathematics. The series covers a range of subjects, for instance gambling theory, the Tragedy of the Commons, anecdotes about mathematical riddles, medical statistics, and construction design; it even answers why champagne from a large bottle tastes better than that from a smaller one. There is also an episode devoted to weather forecasting and climate.

    Success in understanding our universe often depends on how the ‘story’ about it is told, and a big part of that often involves how mental images are presented. Mathematics and statistics can describe nature in great detail and “elegance”, but they are often difficult and inaccessible to the average person. Conversely, the man-and-dog animation is intuitive and easy to comprehend. Similarly, Hans Rosling’s Fun with Stats provides some very nice demonstrations of how to convey meaning via the creative display of numbers.

    Filed Under: Climate impacts, Communicating Climate, El Nino, Greenhouse gases, Tutorials

    Curve-fitting and natural cycles: The best part

    15 Dec 2011 by rasmus


    It is not every day that I come across a scientific publication that so totally goes against my perception of what science is all about. Humlum et al., 2011 present a study in the journal Global and Planetary Change, claiming that most of the temperature changes that we have seen so far are due to natural cycles.

    They claim to present a new technique to identify the character of natural climate variations, and from this, to produce a testable forecast of future climate. They project that

    the observed late 20th century warming in Svalbard is not going to continue for the next 20–25 years. Instead the period of warming may be followed by variable, but generally not higher temperatures for at least the next 20–25 years.

    However, their claims of novelty are overblown, and their projection is demonstrably unsound.

    [Read more…] about Curve-fitting and natural cycles: The best part

    References

    1. O. Humlum, J. Solheim, and K. Stordahl, "Identifying natural contributions to late Holocene climate change", Global and Planetary Change, vol. 79, pp. 145-156, 2011. http://dx.doi.org/10.1016/j.gloplacha.2011.09.005

    Filed Under: Arctic and Antarctic, Climate Science, Instrumental Record, Scientific practice, skeptics, Sun-earth connections, Tutorials

    The IPCC report on extreme climate and weather events

    19 Nov 2011 by rasmus

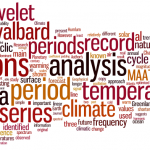
    The IPCC recently released the policy-maker’s summary (SREX-SPM) on extreme weather and climate events. The background for this report is a larger report that is due to be published in the near future, and one gets a taste of this in the ‘wordle‘ figure below. By the way, the phrase ‘ET’ in this context does not refer ‘extra-terrestrial’, and ‘AL’ is not a person, but these refer to the way of citing many scholars: ‘et al.‘

    Fig. 1. The text analysis according to http://www.wordle.net/

    [Read more…] about The IPCC report on extreme climate and weather events

    Filed Under: Climate Science, Communicating Climate, Hurricanes, IPCC, Reporting on climate

    • « Go to Previous Page
    • Page 1
    • Interim pages omitted …
    • Page 7
    • Page 8
    • Page 9
    • Page 10
    • Page 11
    • Interim pages omitted …
    • Page 17
    • Go to Next Page »

    Primary Sidebar

    Search

    Search for:

    Email Notification

    get new posts sent to you automatically (free)
    Loading

    Recent Posts

    • The most recent climate status
    • Unforced variations: May 2025
    • Unforced Variations: Apr 2025
    • WMO: Update on 2023/4 Anomalies
    • Andean glaciers have shrunk more than ever before in the entire Holocene
    • Climate change in Africa

    Our Books

    Book covers
    This list of books since 2005 (in reverse chronological order) that we have been involved in, accompanied by the publisher’s official description, and some comments of independent reviewers of the work.
    All Books >>

    Recent Comments

    • Piotr on Unforced variations: May 2025
    • William on The most recent climate status
    • Mr. Know It All on Unforced variations: May 2025
    • Piotr on The most recent climate status
    • Nigelj on Unforced variations: May 2025
    • Kevin McKinney on Unforced variations: May 2025
    • Kevin McKinney on The most recent climate status
    • Kevin McKinney on The most recent climate status
    • Kevin McKinney on The most recent climate status
    • Mr. Know It All on The most recent climate status
    • K on Unforced variations: May 2025
    • Tomáš Kalisz on Unforced variations: May 2025
    • Tomáš Kalisz on Unforced variations: May 2025
    • Piotr on Unforced variations: May 2025
    • Piotr on Unforced variations: May 2025
    • Susan Anderson on Unforced variations: May 2025
    • Ken Towe on The most recent climate status
    • Keith Woollard on The most recent climate status
    • Dan on Unforced variations: May 2025
    • Nigelj on The most recent climate status

    Footer

    ABOUT

    • About
    • Translations
    • Privacy Policy
    • Contact Page
    • Login

    DATA AND GRAPHICS

    • Data Sources
    • Model-Observation Comparisons
    • Surface temperature graphics
    • Miscellaneous Climate Graphics

    INDEX

    • Acronym index
    • Index
    • Archives
    • Contributors

    Realclimate Stats

    1,365 posts

    11 pages

    243,185 comments

    Copyright © 2025 · RealClimate is a commentary site on climate science by working climate scientists for the interested public and journalists.