In the lead up to the 4th Assessment Report, all the main climate modelling groups (17 of them at last count) made a series of coordinated simulations for the 20th Century and various scenarios for the future. All of this output is publicly available in the PCMDI IPCC AR4 archive (now officially called the CMIP3 archive, in recognition of the two previous, though less comprehensive, collections). We’ve mentioned this archive before in passing, but we’ve never really discussed what it is, how it came to be, how it is being used and how it is (or should be) radically transforming the comparisons of model output and observational data.
[Read more…] about The IPCC model simulation archive
IPCC
Global dimming and global warming
Readers might remember a minor kerfuffle in EOS (the AGU house journal) in February this year in which Gerald Stanhill claimed to find a paradox in the contemporaneous effects of global warming and global dimming (a long term reduction of surface solar radiation, mainly due to aerosols and clouds). The article attracted attention mainly because the paradox was claimed to “pose [a challenge] to the consensus explanation of climate change”.
Rather than point out the subtle confusions (between surface and tropospheric forcing, and local and global signals) here, I and two co-authors wrote a comment to the journal. After a number of avoidable and unavoidable delays, this comment (along with another one and a reply) have all now appeared in EOS (Nov 6 edition). By now of course, the original piece has been long forgotten and so the point in having the correspondence printed is unclear, but still…
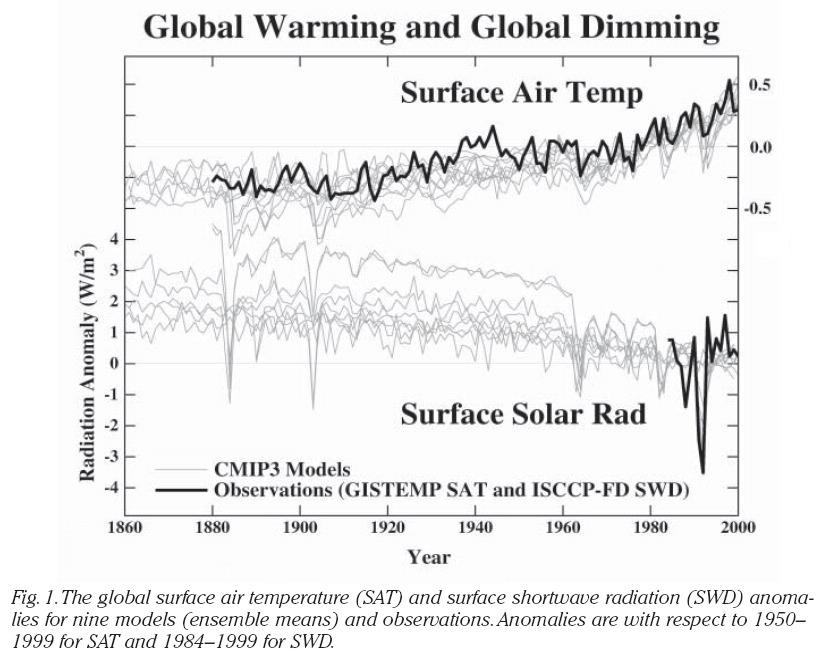
For those that care, I’ll link our comment once it’s been posted on the GISS website (now available here), but the bottom line is clearly seen in the following figure:

That is, if you take all of the IPCC AR4 models (now called the CMIP3 ensemble), then over the twentieth century all of them show varying degrees of global warming, while at the same time they show significant global dimming. An earlier paper of ours had pointed to the aerosols (unsurprisingly) being the dominant cause for long term changes in dimming, but that changes in clouds on a decadal basis were responsible for much of the shorter term variability. Thus there doesn’t appear to be much ‘paradox’ left to worry about – both dimming and warming are seen in models and in observations.
Apologies for appearing to push my own papers here (not something we like to do particularly), but the published comment would have been better done as a blog post in February. There may be a lesson there….
CO2 equivalents
There was a minor kerfuffle in recent days over claims by Tim Flannery (author of “The Weather Makers”) that new information from the upcoming IPCC synthesis report will show that we have reached 455 ppmv CO2_equivalent 10 years ahead of schedule, with predictable implications. This is confused and incorrect, but the definitions of CO2_e, why one would use it and what the relevant level is, are all highly uncertain in many peoples’ minds. So here is a quick rundown.
Definition: The CO2_equivalent level is the amount of CO2 that would be required to give the same global mean radiative forcing as the sum of a basket of other forcings. This is a way to include the effects of CH4 and N2O etc. in a simple way, particularly for people doing future impacts or cost-benefit analysis. The equivalent amount is calculated using the IPCC formula for CO2 forcing:
Total Forcing = 5.35 log(CO2_e/CO2_orig)
where CO2_orig is the 1750 concentration (278 ppmv).
Usage: There are two main ways it is used. Firstly, it is often used to group together all the forcings from the Kyoto greenhouse gases (CO2, CH4, N2O and CFCs), and secondly to group together all forcings (including ozone, sulphate aerosols, black carbon etc.). The first is simply a convenience, but the second is what matters to the planet. Many stabilisation scenarios, such as are being discussed in UNFCCC negotiations are based on stabilising total CO2_e at 450, 550 or 750 ppmv.
Magnitude The values of CO2_e (Kyoto) and CO2_e (Total) can be calculated from Figure 2.21 and Table 2.12 in the IPCC WG1 Chapter 2. The forcing for CO2, CH4 (including indirect effects), N2O and CFCs is 1.66+0.48+0.07+0.16+0.34=2.71 W/m2 (with around 0.3 W/m2 uncertainty). Using the formula above, that gives CO2_e (Kyoto) = 460 ppmv. However, including all the forcings (some of which are negative), you get a net forcing of around 1.6 W/m2, and a CO2_e (Total) of 375 ppmv with quite a wide error bar. This is, coincidently, close to the actual CO2 level.
Implications The important number is CO2_e (Total) which is around 375 ppmv. Stabilisation scenarios of 450 ppmv or 550 ppmv are therefore still within reach. Claims that we have passed the first target are simply incorrect, however, that is not to say they are easily achievable. It is even more of a stretch to state that we have all of a sudden gone past the ‘dangerous’ level. It is still not clear what that level is, but if you take a conventional 450 ppmv CO2_e value (which will lead to a net equilibrium warming of ~ 2 deg C above pre-industrial levels), we are still a number of years from that, and we have (probably) not yet committed ourselves to reaching it.
Finally, the IPCC synthesis report is simply a concise summary of the three separate reports that have already come out. It therefore can’t be significantly different from what is already available. But this is another example where people are quoting from draft reports that they have neither properly read nor understood and for which better informed opinion is not immediately available. I wish journalists and editors would resist the temptation to jump on leaks like this (though I know it’s hard). The situation is confusing enough without adding to it unintentionally.
Regional Climate Projections
Regional Climate Projections in the IPCC AR4
How does anthropogenic global warming (AGW) affect me? The answer to this question will perhaps be one of the most relevant concerns in the future, and is discussed in chapter 11 of the IPCC assessment report 4 (AR4) working group 1 (WG1) (the chapter also has some supplementary material). The problem of obtaining regional information from GCMs is not trivial, and has been discussed in a previous post here at RC and the IPCC third assessment report (TAR) also provided a good background on this topic.
The climate projections presented in the IPCC AR4 are from the latest set of coordinated GCM simulations, archived at the Program for Climate Model Diagnosis and Intercomparison (PCMDI). This is the most important new information that AR4 contains concerning the future projections. These climate model simulations (the multi-model data set, or just ‘MMD’) are often referred to as the AR4 simulations, but they are now officially being referred to as CMIP3.
One of the most challenging and uncertain aspects of present-day climate research is associated with the prediction of a regional response to a global forcing. Although the science of regional climate projections has progressed significantly since last IPCC report, slight displacement in circulation characteristics, systematic errors in energy/moisture transport, coarse representation of ocean currents/processes, crude parameterisation of sub-grid- and land surface processes, and overly simplified topography used in present-day climate models, make accurate and detailed analysis difficult.
I think that the authors of chapter 11 over-all have done a very thorough job, although there are a few points which I believe could be improved. Chapter 11 of the IPCC AR4 working group I (WGI) divides the world into different continents or types of regions (e.g. ‘Small islands’ and ‘Polar regions’), and then discusses these separately. It provides a nice overview of the key climate characteristics for each region. Each section also provides a short round up of the evaluations of the performance of the climate models, discussing their weaknesses in terms of reproducing regional and local climate characteristics.
Transparency of the IPCC process
Recently, a Financial Times op-ed criticised the IPCC for having contributors and peers drawn from a narrow professional circle. I don’t think this is fair, unless one regards a whole discipline as ‘narrow’. Furthermore, recent public disclosure of both comments and response suggests a different story to the allegations in the FT op-ed of ‘refusing to disclose data and methods’. The IPCC has no control over the independent publication, but the disclosure of the comments and response at least enhances the openness for the synthesis of the report.
Green and Armstrong’s scientific forecast
There is a new critique of IPCC climate projections doing the rounds of the blogosphere from two ‘scientific forecasters’, Kesten Green and Scott Armstrong, who claim that since the IPCC projections are not ‘scientific forecasts’ they must perforce be wrong and that a naive model of no change in future is likely to be more accurate that any IPCC conclusion. This ignores the fact that IPCC projections have already proved themselves better than such a naive model, but their critique is novel enough to be worth a mention.
[Read more…] about Green and Armstrong’s scientific forecast
Start here
[Note this is page is updated regularly. Please notify us of any dead links. Last update: 10 May 2022.]
We’re often asked to provide a one stop link for resources that people can use to get up to speed on the issue of climate change, and so here is a selection. Unlike our other postings, we’ll amend this as we discover or are pointed to new resources. Different people have different needs and so we will group resources according to the level people start at.
For complete beginners:
NCAR: Weather and climate basics
Center for Climate and Energy Solutions: Climate basics
Wikipedia: Global Warming
NASA: Global Warming
National Academy of Science: America’s Climate Choices (2011)
Encyclopedia of Earth: Climate Change
Global Warming: Man or Myth? (Scott Mandia, SUNY Suffolk)
Open Learn: The Basics of Climate Prediction
There is a booklet on Climate Literacy from multiple agencies (NOAA, NSF, AAAS) available here (pdf).
The UK Govt. had a good site on The Science of Climate Change (archived).
The portal for climate and climate change of the ZAMG (Zentralaanstalt für Meteorologie und Geodynamik, Vienna, Austria). (In German) (added Jan 2011).
Those with some knowledge:
The IPCC Frequently Asked Questions are an excellent start (AR4 version here , updates were provided in the 5th Assessment report (pdf) and again for AR6).
The UK Royal Society and US National Academies of Science produced a joint Q&A on climate change in 2014, and an update in 2017.
RealClimate: Start with our index.
Informed, but in need of more detail:
Science: You can’t do better than the IPCC reports themselves (AR6 2021, AR5 2013, AR4 2007, TAR 2001). Also the Climate Science Special Report for the US National Climate Assessment.
History: Spencer Weart’s “Discovery of Global Warming” (AIP)
Informed, but seeking serious discussion of common contrarian talking points:
All of the below links have indexed debunks of most of the common points of confusion:
- Coby Beck’s How to talk to Global Warming Skeptic
- New Scientist: Climate Change: A guide for the perplexed
- RealClimate: Response to common contrarian arguments
- NERC (UK): Climate change debate summary (archived)
- UK Met Office: Climate Science
- Brian Angliss A Thorough Debunking
- John Cook Skeptical Science
- The Global Warming Debate (Presentations from around 2010 resurrected)
Please feel free to suggest other suitable resources, particularly in different languages, and we’ll try to keep this list up to date.
A Slovak translation is available here
Tłumaczenie na polski dostępne jest tutaj
A Bulgarian translation is available here (via Ivan Boreev).
Full IPCC AR4 report now available
The complete WG1 IPCC 4th Assessment report (AR4) is now available online. It’s missing the index and some supplemental data, but all should be available by May 7.
Over the next few weeks we’ll try and go through the report chapter by chapter, but since this is likely to the key reference for a number of years, we can take a little time to do it properly. Happy reading!
The IPCC sea level numbers


The sea level rise numbers published in the new IPCC report (the Fourth Assessment Report, AR4) have already caused considerable confusion. Many media articles and weblogs suggested there is good news on the sea level issue, with future sea level rise expected to be a lot less compared to the previous IPCC report (the Third Assessment Report, TAR). Some articles reported that IPCC had reduced its sea level projection from 88 cm to 59 cm (35 inches to 23 inches) , some even said it was reduced from 88 cm to 43 cm (17 inches), and there were several other versions as well (see “Broad Irony”). These statements are not correct and the new range up to 59 cm is not the full story. Here I will try to clarify what IPCC actually said and how these numbers were derived. (But if you want to skip the details, you can go straight to the critique or the bottom line).
[Read more…] about The IPCC sea level numbers
Aerosols: The Last Frontier?


Guest commentary from Juliane Fry, UC Berkeley
The recently released IPCC 2007 Fourth Assessment Report Summary for Policymakers reminds us that aerosols remain the least understood component of the climate system. Aerosols are solid or liquid particles suspended in the atmosphere, consisting of (in rough order of abundance): sea salt, mineral dust, inorganic salts such as ammonium sulfate (which has natural as well as anthropogenic sources from e.g. coal burning), and carbonaceous aerosol such as soot, plant emissions, and incompletely combusted fossil fuel. As should be apparent from this list, there are many natural sources of aerosol, but changes have been observed in particular, in the atmospheric loading of carbonaceous aerosol and sulphates, which originate in part from fossil fuel burning. While a relatively minor part of the overall aerosol mass, changes in the anthropogenic portion of aerosols since 1750 have resulted in a globally averaged net radiative forcing of roughly -1.2 W/m2, in comparison to the overall average CO2 forcing of +1.66 W/m2.
[Read more…] about Aerosols: The Last Frontier?