Climate Science
On arguing by analogy
Climate blogs and comment threads are full of ‘arguments by analogy’. Depending on what ‘side’ one is on, climate science is either like evolution/heliocentrism/quantum physics/relativity or eugenics/phrenology/Ptolemaic cosmology/phlogiston. Climate contrarians are either like flat-earthers/birthers/moon-landing hoaxers/vaccine-autism linkers or Galileo/stomach ulcer-Helicobacter proponents/Wegener/Copernicus. Episodes of clear misconduct or dysfunction in other spheres of life are closely parsed only to find clubs with which to beat an opponent. Etc. Etc.
While the users of these ‘arguments’ often assume that they are persuasive or illuminating, the only thing that is revealed is how the proposer feels about climate science. If they think it is generally on the right track, the appropriate analogy is some consensus that has been validated many times and the critics are foolish stuck-in-the-muds or corporate disinformers, and if they don’t, the analogy is to a consensus that was overturned and where the critics are the noble paradigm-shifting ‘heretics’. This is far closer to wishful thinking than actual thinking, but it does occasionally signal clearly who is not worth talking to. For instance, an article pretending to serious discussion on climate that starts with a treatise about Lysenkoism in the Soviet Union is not to be taken seriously.
Since the truth or falsity of any scientific claim can only be evaluated on it’s own terms – and not via its association with other ideas or the character of its proponents – this kind of argument is only rhetorical. It gets no-one closer to the truth of any particular matter. The fact is that many, many times, mainstream science has survived multiple challenges by ‘sceptics’, and that sometimes (though not at all often), a broad consensus has been overturned. But knowing which case is which in any particular issue simply by looking for points of analogy with previous issues, but without actually examining the data and theory directly, is impossible. The point being that arguments by analogy are not persuasive to anyone who doesn’t already agree with you on the substance.
Given the rarity of a consensus-overturning event, the only sensible prior is to assume that a consensus is probably valid absent very strong evidence to the contrary, which is incidentally the position adopted by the arch-sceptic Bertrand Russell. The contrary assumption implies there are no a priori reasons to think any scientific body of work is credible which, while consistent, is not one that I have ever found anyone professing in practice. Far more common is a selective rejection of science dependent on other reasons and that is not a coherent philosophical position at all.
Analogies do have their place of course – usually to demonstrate that a supposedly logical point falls down completely when applied to a different (but analogous) case. For instance, an implicit claim that all correct scientific theories are supported by a unanimity of Nobel Prize winners/members of the National Academies, is easily dismissed by reference to Kary Mullis or Peter Duesberg. A claim that CO2 can’t possibly have a significant effect solely because of its small atmospheric mixing ratio, can be refuted as a general claim by reference to other substances (such as arsenic, plutonium or Vitamin C) whose large effects due to small concentrations are well known. Or if a claim is made that all sciences except climate science are devoid of uncertainty, this is refuted by reference to, well, any other scientific field.
To be sure, I am not criticising the use of metaphor in a more general sense. Metaphors that use blankets to explaining how the greenhouse effect works, income and spending in your bank account to stand in for the carbon cycle, what the wobbles in the Earth’s orbit look like if the planet was your head, or conceptualizing the geologic timescale by compressing it to a day, for instance, all serve useful pedagogic roles. The crucial difference is that these mappings don’t come dripping with over-extended value judgements.
Another justification for the kind of analogy I’m objecting to is that it is simply for amusement: “Of course, I’m not really comparing my opponents to child molesters/food adulterers/mass-murderers – why can’t you take a joke?”. However, if you need to point out to someone that a joke (for adults at least) needs to have more substance than just calling someone a poopyhead, it is probably not worth the bother.
It would be nice to have a moratorium on all such analogical arguments, though obviously that is unlikely to happen. The comment thread here can assess this issue directly, but most such arguments on other threads are ruthlessly condemned to the bore-hole (where indeed many of them already co-exist). But perhaps we can put some pressure on users of these fallacies by pointing to this post and then refusing to engage further until someone actually has something substantive to offer. It may be pointless, but we can at least try.
Unforced variations: September 2014
This month’s open thread. People could waste time rebunking predictable cherry-picked claims about the upcoming Arctic sea ice minimum, or perhaps discuss a selection of 10 climate change controversies from ICSU… Anything! (except mitigation).
IPCC attribution statements redux: A response to Judith Curry
I have written a number of times about the procedure used to attribute recent climate change (here in 2010, in 2012 (about the AR4 statement), and again in 2013 after AR5 was released). For people who want a summary of what the attribution problem is, how we think about the human contributions and why the IPCC reaches the conclusions it does, read those posts instead of this one.
The bottom line is that multiple studies indicate with very strong confidence that human activity is the dominant component in the warming of the last 50 to 60 years, and that our best estimates are that pretty much all of the rise is anthropogenic.
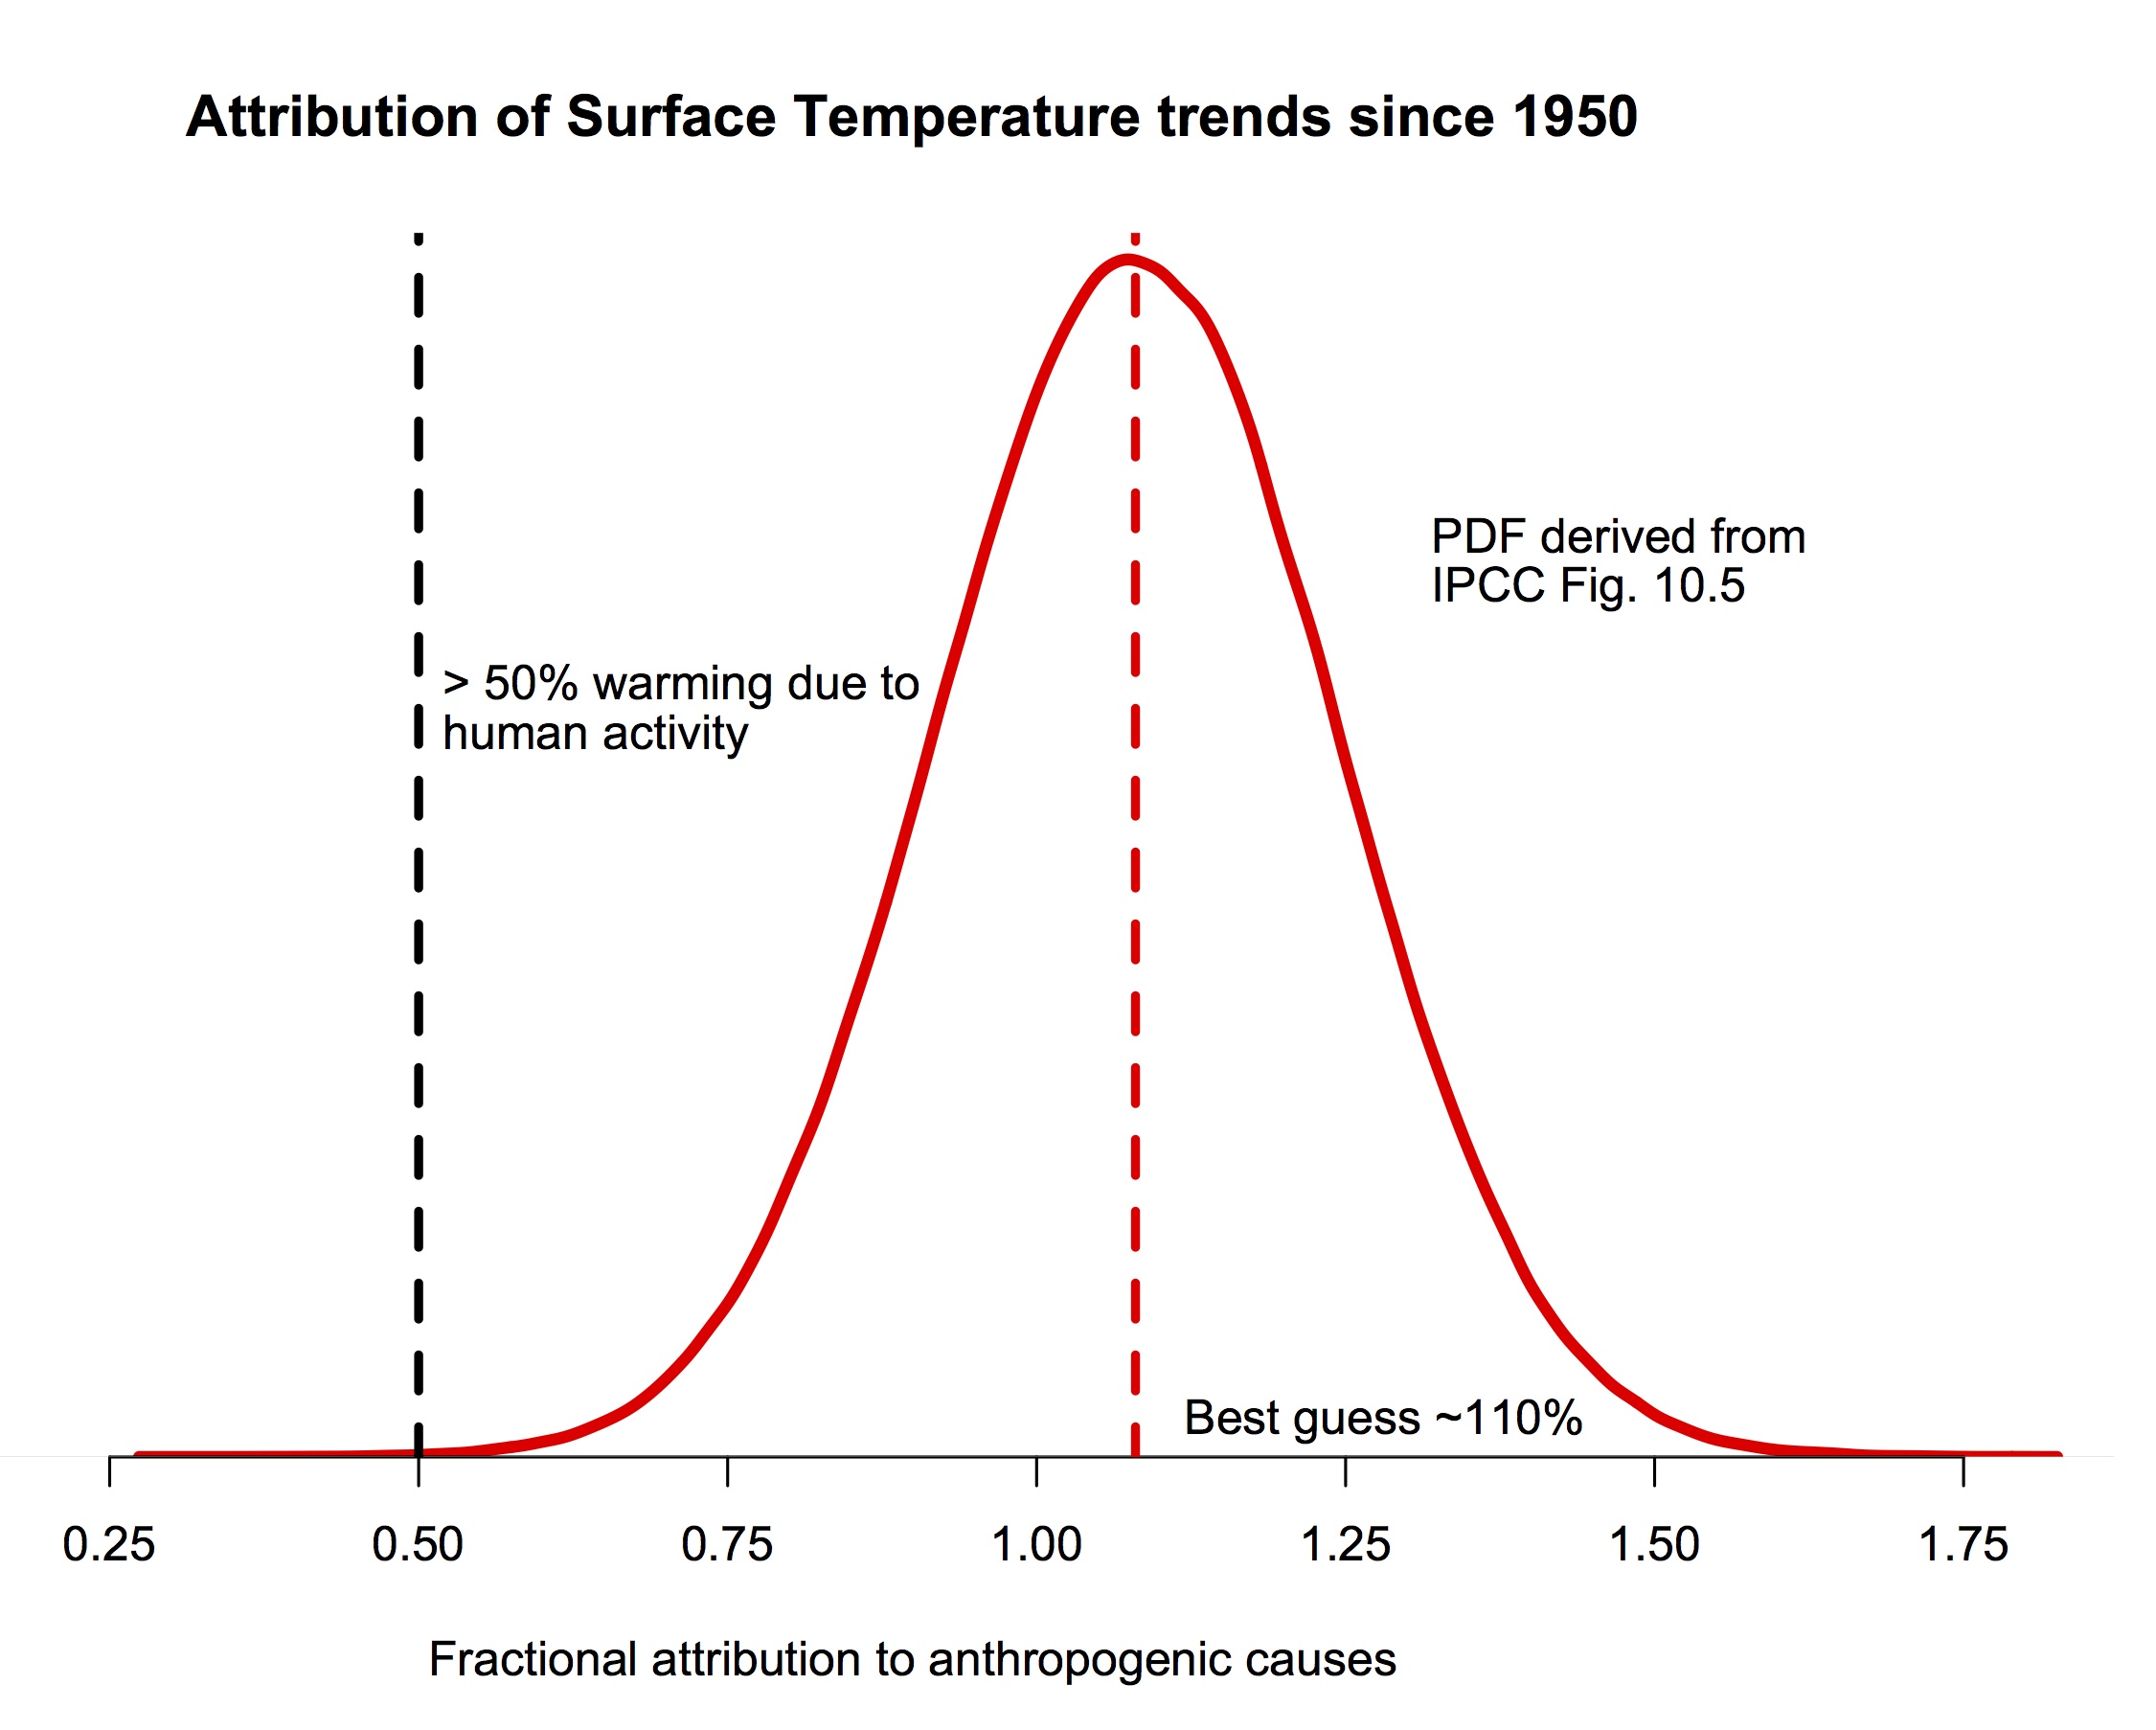
The probability density function for the fraction of warming attributable to human activity (derived from Fig. 10.5 in IPCC AR5). The bulk of the probability is far to the right of the “50%” line, and the peak is around 110%.
If you are still here, I should be clear that this post is focused on a specific claim Judith Curry has recently blogged about supporting a “50-50” attribution (i.e. that trends since the middle of the 20th Century are 50% human-caused, and 50% natural, a position that would center her pdf at 0.5 in the figure above). She also commented about her puzzlement about why other scientists don’t agree with her. Reading over her arguments in detail, I find very little to recommend them, and perhaps the reasoning for this will be interesting for readers. So, here follows a line-by-line commentary on her recent post. Please excuse the length.
[Read more…] about IPCC attribution statements redux: A response to Judith Curry
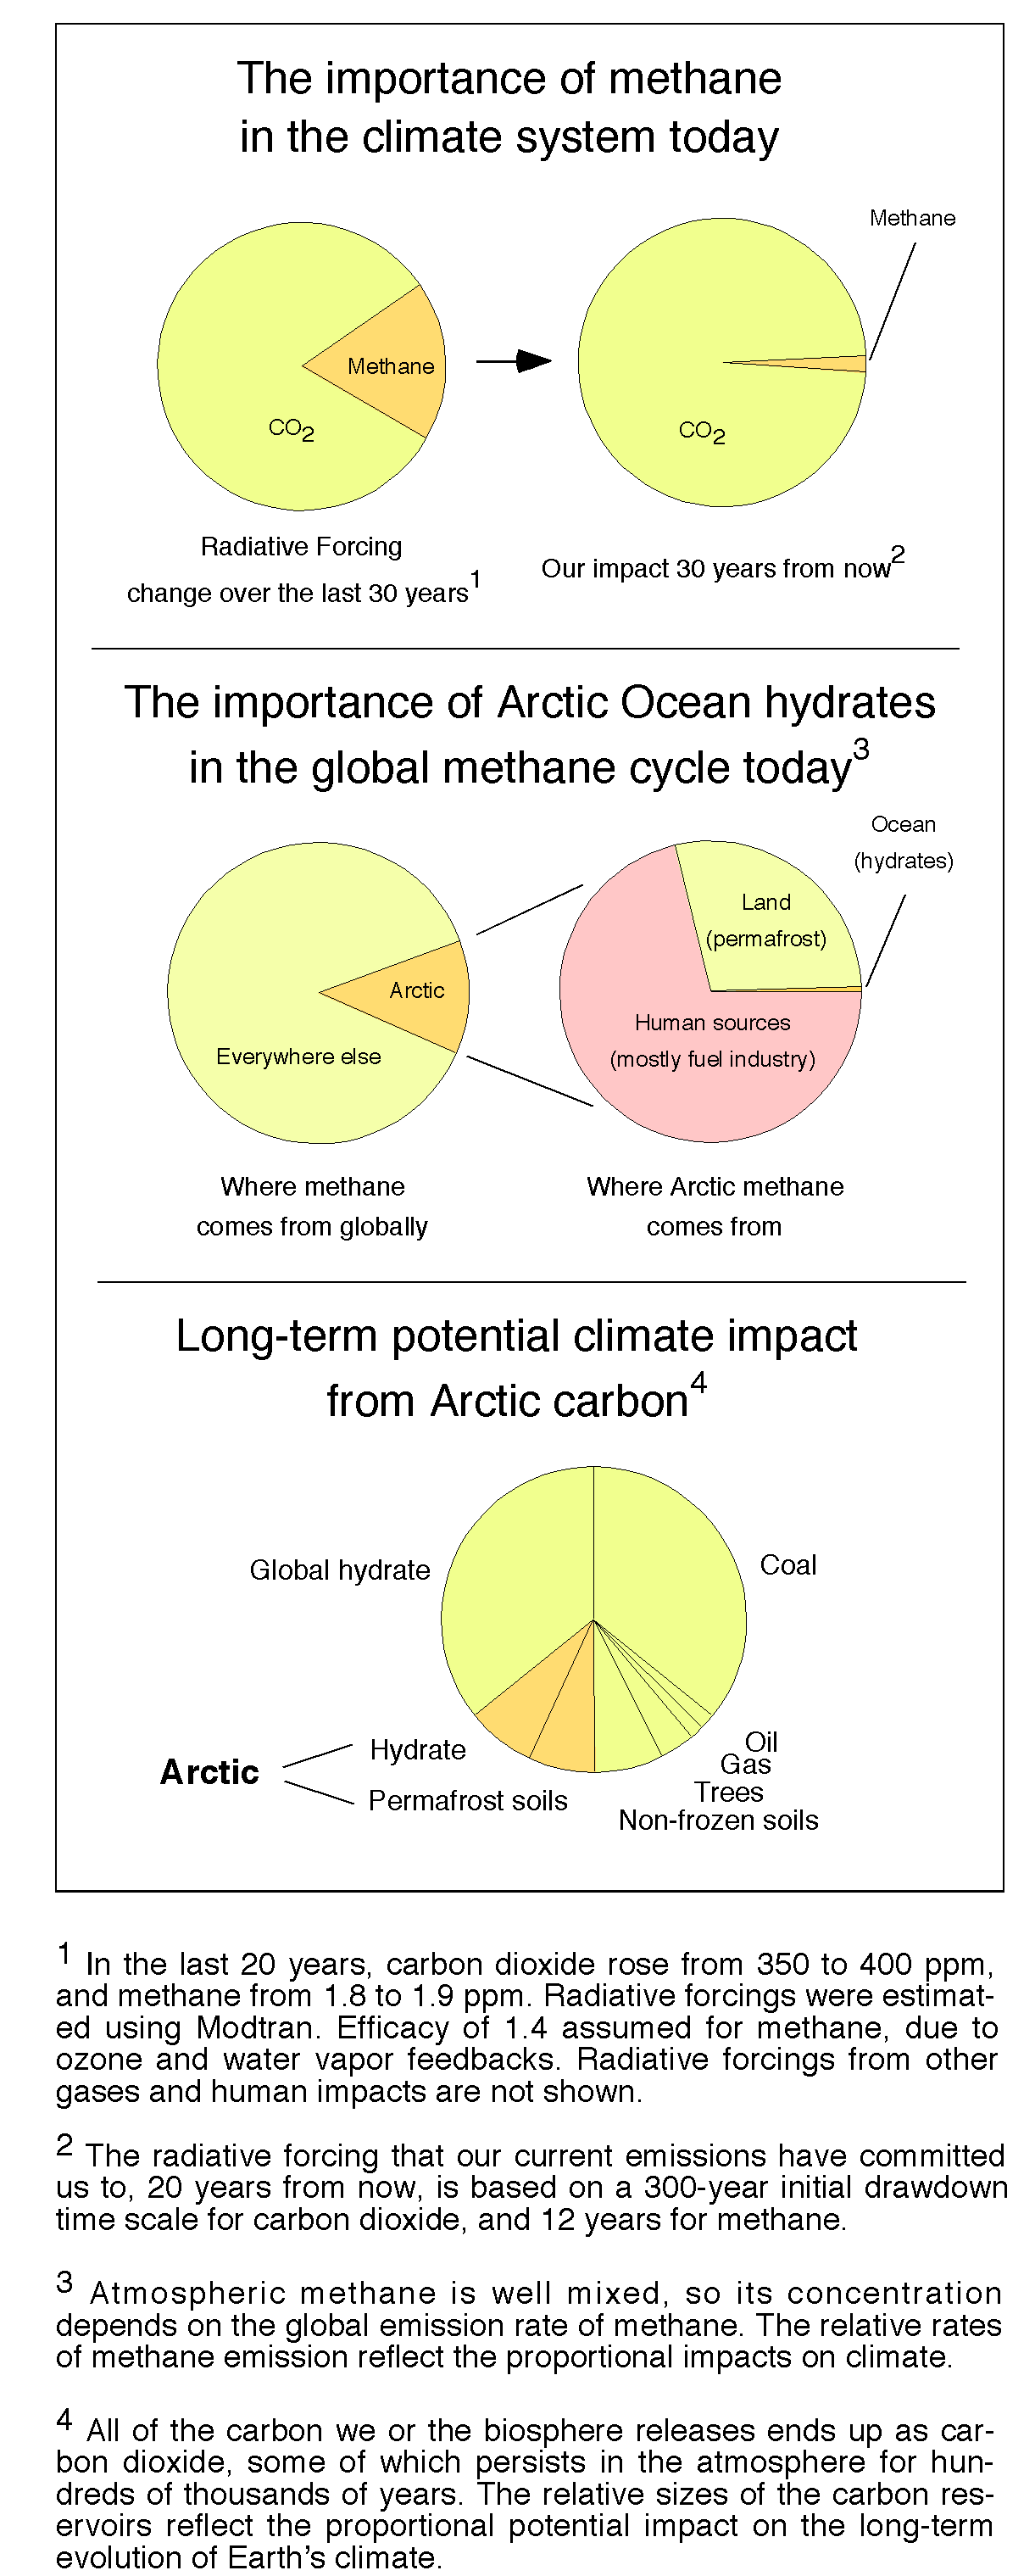
How much methane came out of that hole in Siberia?
Siberia has explosion holes in it that smell like methane, and there are newly found bubbles of methane in the Arctic Ocean. As a result, journalists are contacting me assuming that the Arctic Methane Apocalypse has begun. However, as a climate scientist I remain much more concerned about the fossil fuel industry than I am about Arctic methane. Short answer: It would take about 20,000,000 such eruptions within a few years to generate the standard Arctic Methane Apocalypse that people have been talking about. Here’s where that statement comes from:
[Read more…] about How much methane came out of that hole in Siberia?
Unforced variations: Aug 2014
This month’s open thread. Keeping track of the Arctic sea ice minimum is interesting but there should be plenty of other climate science topics to discuss (if people can get past the hype about the Ebola outbreak or imaginary claims about anomalous thrusting). As with last month, pleas no discussion of mitigation strategies – it unfortunately does not bring out the best in the commentariat.
Rossby waves and surface weather extremes
A new study by Screen and Simmonds demonstrates the statistical connection between high-amplitude planetary waves in the atmosphere and extreme weather events on the ground.
Guest post by Dim Coumou
There has been an ongoing debate, both in and outside the scientific community, whether rapid climate change in the Arctic might affect circulation patterns in the mid-latitudes, and thereby possibly the frequency or intensity of extreme weather events. The Arctic has been warming much faster than the rest of the globe (about twice the rate), associated with a rapid decline in sea-ice extent. If parts of the world warm faster than others then of course gradients in the horizontal temperature distribution will change – in this case the equator-to-pole gradient – which then could affect large scale wind patterns.
Several dynamical mechanisms for this have been proposed recently. Francis and Vavrus (GRL 2012) argued that a reduction of the north-south temperature gradient would cause weaker zonal winds (winds blowing west to east) and therefore a slower eastward propagation of Rossby waves. A change in Rossby wave propagation has not yet been detected (Barnes 2013) but this does not mean that it will not change in the future. Slowly-traveling waves (or quasi-stationary waves) would lead to more persistent and therefore more extreme weather. Petoukhov et al (2013) actually showed that several recent high-impact extremes, both heat waves and flooding events, were associated with high-amplitude quasi-stationary waves. [Read more…] about Rossby waves and surface weather extremes
References
- J.A. Francis, and S.J. Vavrus, "Evidence linking Arctic amplification to extreme weather in mid‐latitudes", Geophysical Research Letters, vol. 39, 2012. http://dx.doi.org/10.1029/2012GL051000
- E.A. Barnes, "Revisiting the evidence linking Arctic amplification to extreme weather in midlatitudes", Geophysical Research Letters, vol. 40, pp. 4734-4739, 2013. http://dx.doi.org/10.1002/grl.50880
- V. Petoukhov, S. Rahmstorf, S. Petri, and H.J. Schellnhuber, "Quasiresonant amplification of planetary waves and recent Northern Hemisphere weather extremes", Proceedings of the National Academy of Sciences, vol. 110, pp. 5336-5341, 2013. http://dx.doi.org/10.1073/pnas.1222000110
Release of the International Surface Temperature Initiative’s (ISTI’s) Global Land Surface Databank, an expanded set of fundamental surface temperature records
Guest post by Jared Rennie, Cooperative Institute for Climate and Satellites, North Carolina on behalf of the databank working group of the International Surface Temperature Initiative
In the 21st Century, when multi-billion dollar decisions are being made to mitigate and adapt to climate change, society rightly expects openness and transparency in climate science to enable a greater understanding of how climate has changed and how it will continue to change. Arguably the very foundation of our understanding is the observational record. Today a new set of fundamental holdings of land surface air temperature records stretching back deep into the 19th Century has been released as a result of several years of effort by a multinational group of scientists.
The International Surface Temperature Initiative (ISTI) was launched by an international and multi-disciplinary group of scientists in 2010 to improve understanding of the Earth’s climate from the global to local scale. The Databank Working Group, under the leadership of NOAA’s National Climatic Data Center (NCDC), has produced an innovative data holding that largely leverages off existing data sources, but also incorporates many previously unavailable sources of surface air temperature. This data holding provides users a way to better track the origin of the data from its collection through its integration. By providing the data in various stages that lead to the integrated product, by including data origin tracking flags with information on each observation, and by providing the software used to process all observations, the processes involved in creating the observed fundamental climate record are completely open and transparent to the extent humanly possible.
Databank Architecture
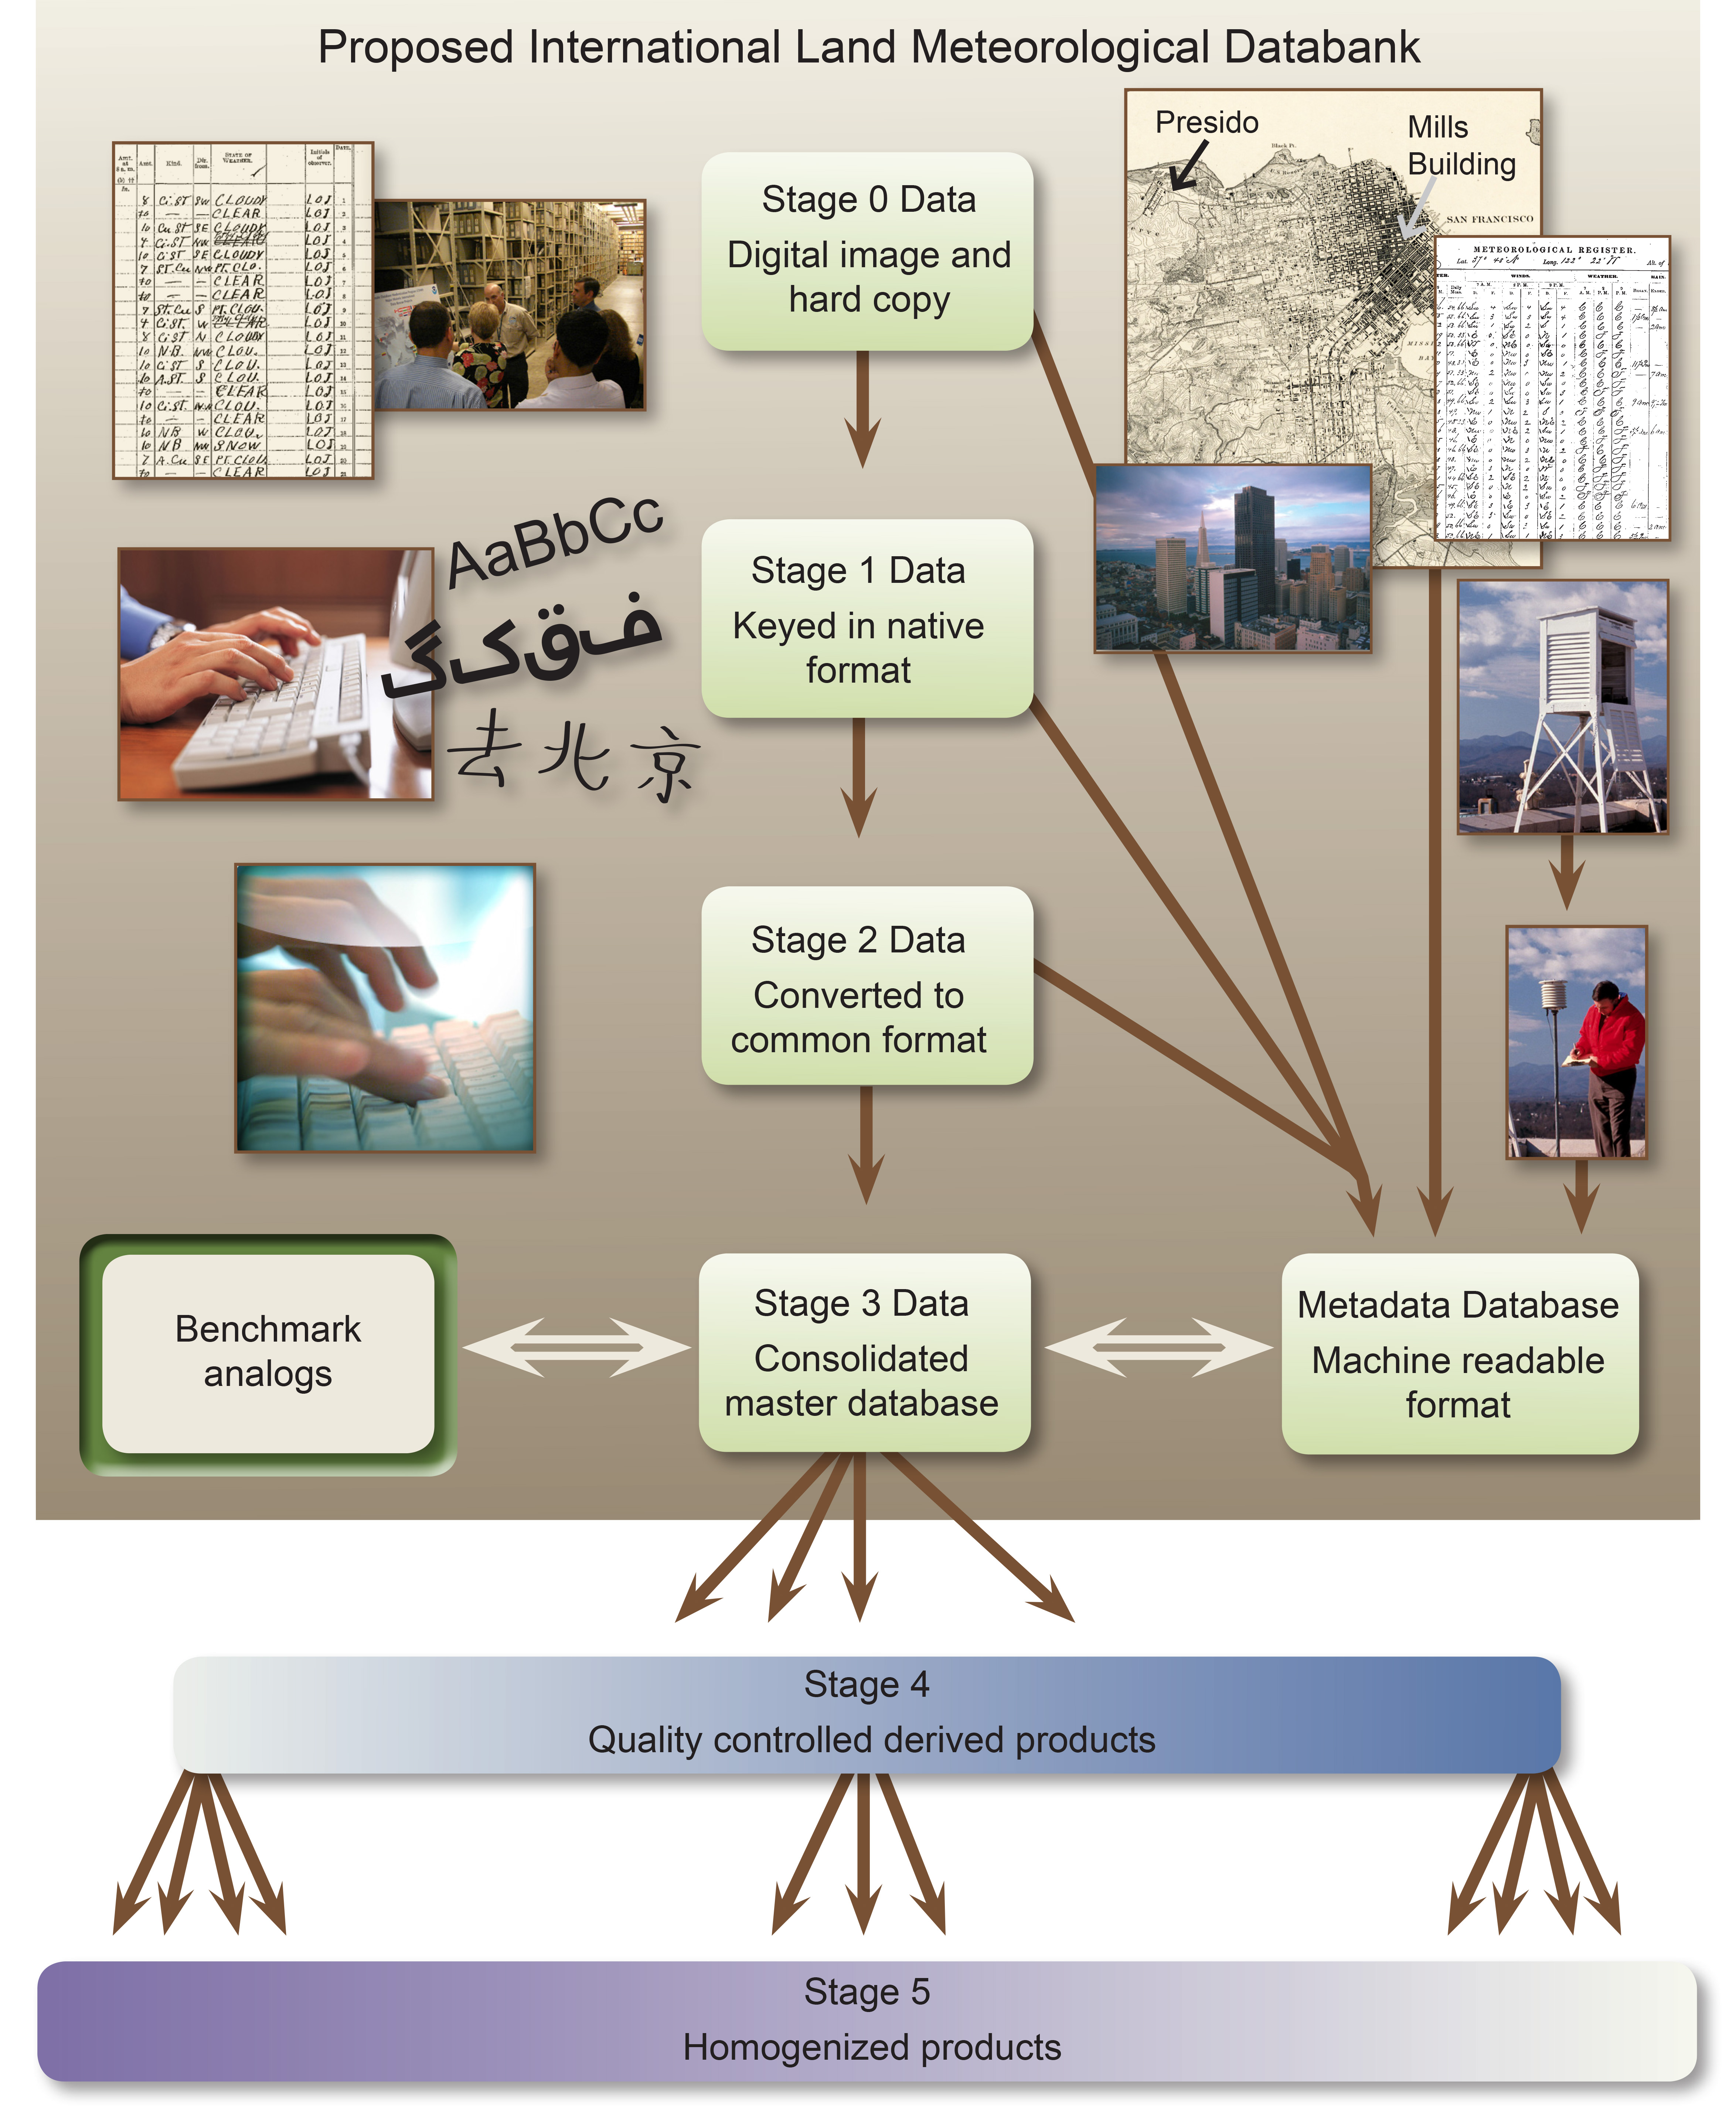
The databank includes six data Stages, starting from the original observation to the final quality controlled and bias corrected product (Figure 1). The databank begins at Stage Zero holdings, which contain scanned images of digital observations in their original form. These images are hosted on the databank server when third party hosting is not possible. Stage One contains digitized data, in its native format, provided by the contributor. No effort is required on their part to convert the data into any other format. This reduces the possibility that errors could occur during translation. We collated over 50 sources ranging from single station records to holdings of several tens of thousands of stations.
Once data are submitted as Stage One, all data are converted into a common Stage Two format. In addition, data provenance flags are added to every observation to provide a history of that particular observation. Stage Two files are maintained in ASCII format, and the code to convert all the sources is provided. After collection and conversion to a common format, the data are then merged into a single, comprehensive Stage Three dataset. The algorithm that performs the merging is described below. Development of the merged dataset is followed by quality control and homogeneity adjustments (Stage Four and Five, respectively). These last two stages are not the responsibility of Databank Working Group, see the discussion of broader context below.
Merge Algorithm Description
The following is an overview of the process in which individual Stage Two sources are combined to form a comprehensive Stage Three dataset. A more detailed description can be found in a manuscript accepted and published by Geoscience Data Journal (Rennie et al., 2014).
The algorithm attempts to mimic the decisions an expert analyst would make manually. Given the fractured nature of historical data stewardship many sources will inevitably contain records for the same station and it is necessary to create a process for identifying and removing duplicate stations, merging some sources to produce a longer station record, and in other cases determining when a station should be brought in as a new distinct record.
The merge process is accomplished in an iterative fashion, starting from the highest priority data source (target) and running progressively through the other sources (candidates). A source hierarchy has been established which prioritizes datasets that have better data provenance, extensive metadata, and long, consistent periods of record. In addition it prioritizes holdings derived from daily data to allow consistency between daily holdings and monthly holdings. Every candidate station read in is compared to all target stations, and one of three possible decisions is made. First, when a station match is found, the candidate station is merged with the target station. Second, if the candidate station is determined to be unique it is added to the target dataset as a new station. Third, the available information is insufficient, conflicting, or ambiguous, and the candidate station is withheld.
Stations are first compared through their metadata to identify matching stations. Four tests are applied: geographic distance, height distance, station name similarity, and when the data record began. Non-missing metrics are then combined to create a metadata metric and it is determined whether to move on to data comparisons, or to withhold the candidate station. If a data comparison is deemed necessary, overlapping data between the target and candidate station is tested for goodness-of-fit using the Index of Agreement (IA). At least five years of overlap are required for a comparison to be made. A lookup table is used to provide two data metrics, the probability of station match (H1) and the probability of station uniqueness (H2). These are then combined with the metadata metric to create posterior metrics of station match and uniqueness. These are used to determine if the station is merged, added as unique, or withheld.
Stage Three Dataset Description
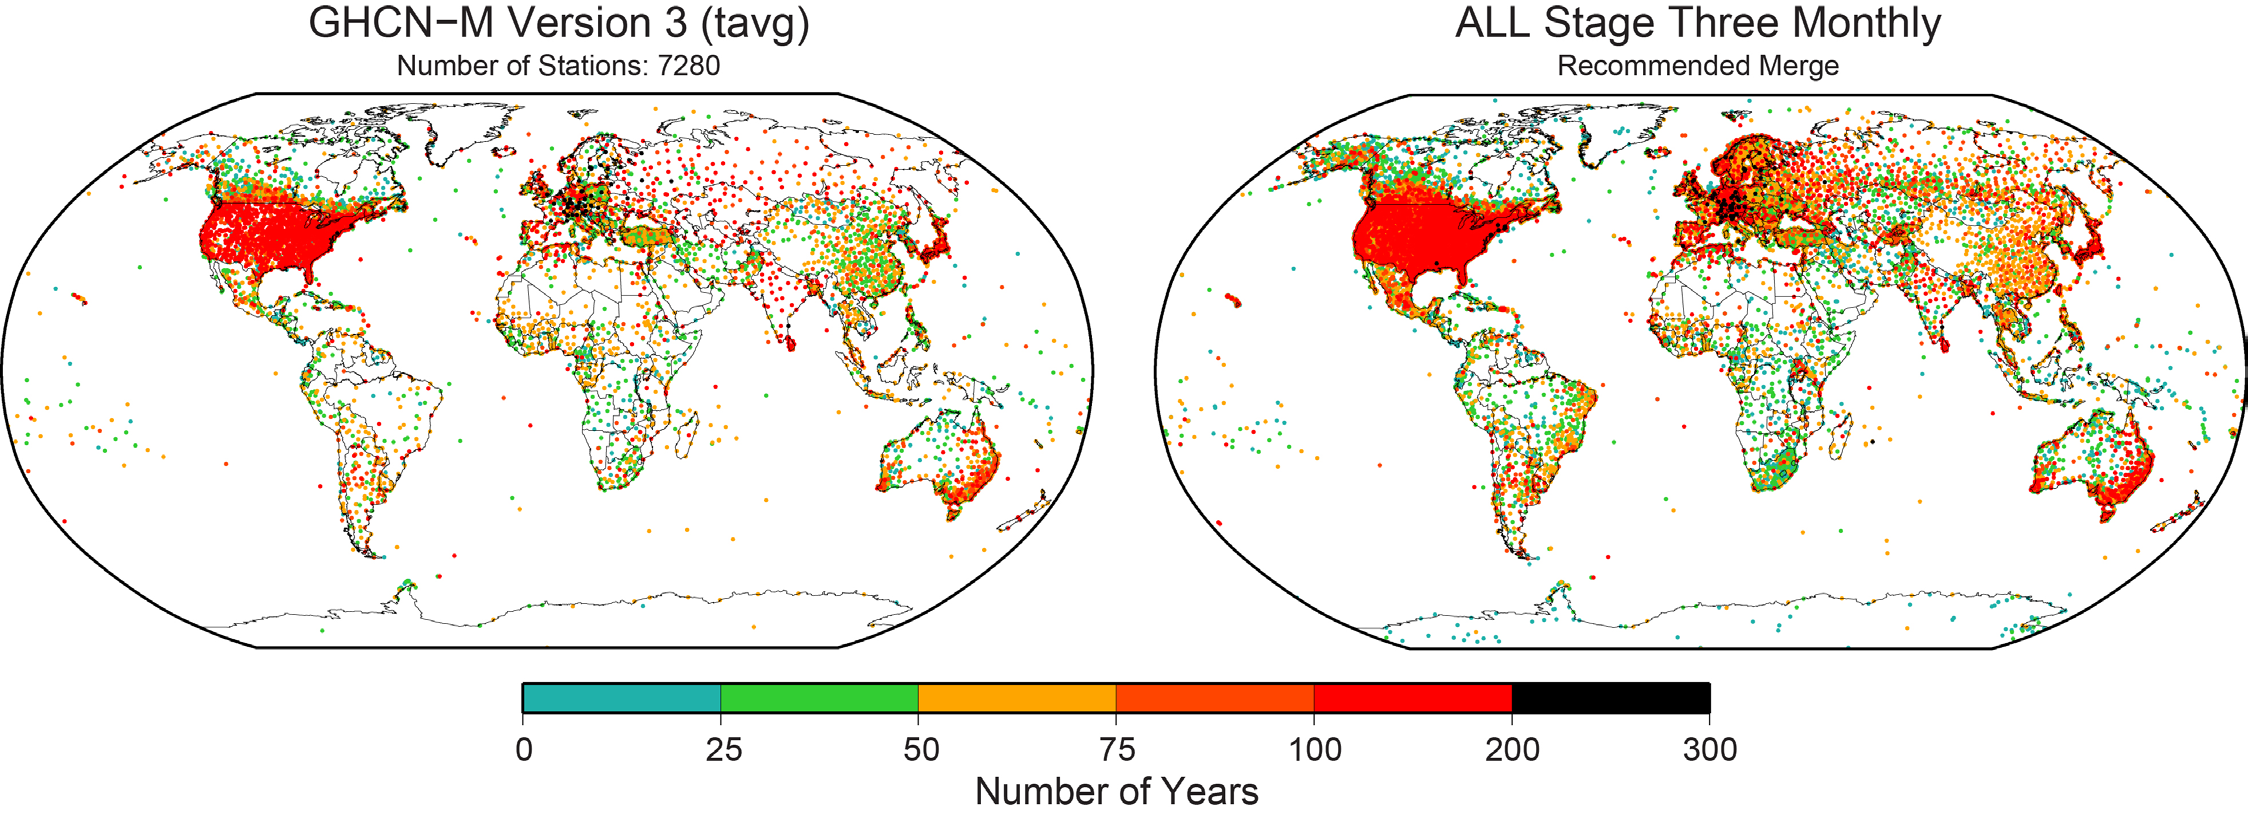
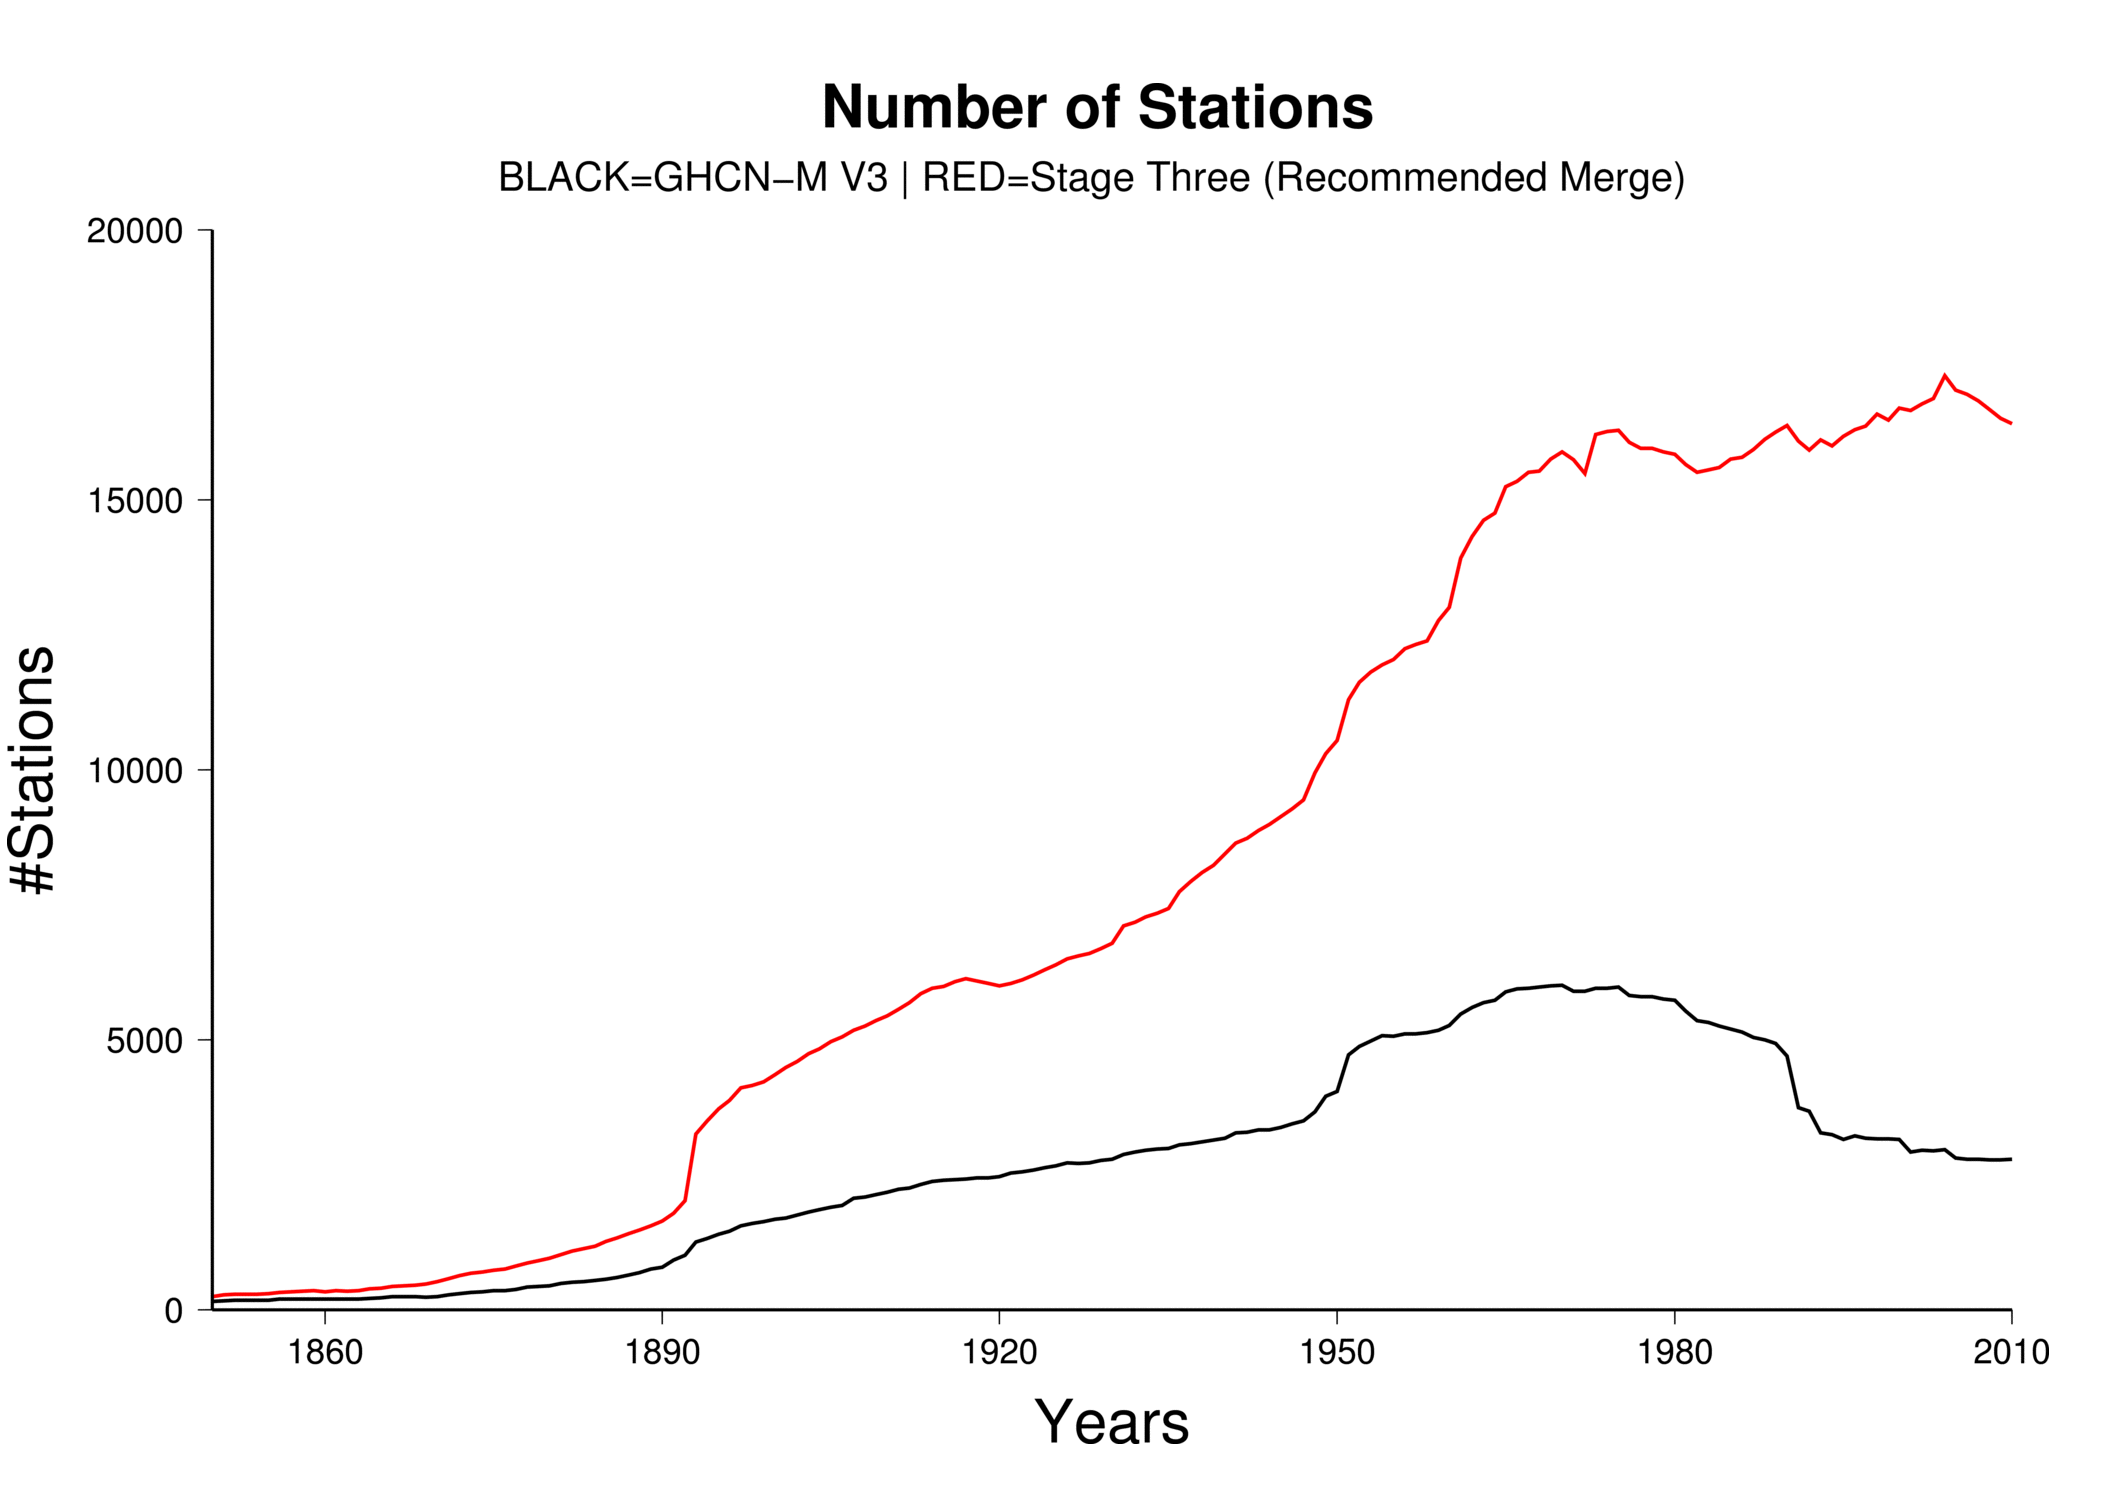
The integrated data holding recommended and endorsed by ISTI contains over 32,000 global stations (Figure 2), over four times as many stations as GHCN-M version 3. Although station coverage varies spatially and temporally, there are adequate stations with decadal and century periods of record at local, regional, and global scales. Since 1850, there consistently are more stations in the recommended merge than GHCN-M (Figure 3). In GHCN-M version 3, there was a significant drop in stations in 1990 reflecting the dependency on the decadal World Weather Records collection as a source, which is ameliorated by many of the new sources which can be updated much more rapidly and will enable better real-time monitoring.
Many thresholds are used in the merge and can be set by the user before running the merge program. Changing these thresholds can significantly alter the overall result of the program. Changes will also occur when the source priority hierarchy is altered. In order to characterize the uncertainty associated with the merge parameters, seven different variants of the Stage Three product were developed alongside the recommended merge. This uncertainty reflects the importance of data rescue. While a major effort has been undertaken through this initiative, more can be done to include areas that are lacking on both spatial and temporal scales, or lacking maximum and minimum temperature data.
Data Access
Version 1.0.0 of the Global Land Surface Databank has been released and data are provided from a primary ftp site hosted by the Global Observing Systems Information Center (GOSIC) and World Data Center A at NOAA NCDC. The Stage Three dataset has multiple formats, including a format approved by ISTI, a format similar to GHCN-M, and netCDF files adhering to the Climate and Forecast (CF) convention. The data holding is version controlled and will be updated frequently in response to newly discovered data sources and user comments.
All processing code is provided, for openness and transparency. Users are encouraged to experiment with the techniques used in these algorithms. The programs are designed to be modular, so that individuals have the option to develop and implement other methods that may be more robust than described here. We will remain open to releases of new versions should such techniques be constructed and verified.
ISTI’s online directory provides further details on the merging process and other aspects associated with the full development of the databank as well as all of the data and processing code.
We are always looking to increase the completeness and provenance of the holdings. Data submissions are always welcome and strongly encouraged. If you have a lead on a new data source, please contact data.submission@surfacetemperatures.org with any information which may be useful.
The broader context
It is important to stress that the databank is a release of fundamental data holdings – holdings which contain myriad non-climatic artefacts arising from instrument changes, siting changes, time of observation changes etc. To gain maximum value from these improved holdings it is imperative that as a global community we now analyze them in multiple distinct ways to ascertain better estimates of the true evolution of surface temperatures locally, regionally, and globally. Interested analysts are strongly encouraged to develop innovative approaches to the problem.
To help ascertain what works and what doesn’t the benchmarking working group are developing and will soon release a set of analogs to the databank. These will share the space and time sampling of the holdings but contain a set of known (to the originators) data issues that require removing. When analysts apply their methods to the analogs we can infer something meaningful about their methods. Further details are available in a discussion paper under peer review [Willett et al., submitted].
More Information
www.surfacetemperatures.org
ftp://ftp.ncdc.noaa.gov/pub/data/globaldatabank
References
Rennie, J.J. and coauthors, 2014, The International Surface Temperature Initiative Global Land Surface Databank: Monthly Temperature Data Version 1 Release Description and Methods. Accepted, Geoscience Data Journal.
Willett, K. M. et al., submitted, Concepts for benchmarking of homogenisation algorithm performance on the global scale. http://www.geosci-instrum-method-data-syst-discuss.net/4/235/2014/gid-4-235-2014.html
Unforced variations: July 2014
This month’s open thread. Topics of potential interest: The successful OCO-2 launch, continuing likelihood of an El Niño event this fall, predictions of the September Arctic sea ice minimum, Antarctic sea ice excursions, stochastic elements in climate models etc. Just for a change, no discussion of mitigation efforts please!
Unforced variations: June 2014
June is the month when the Arctic Sea Ice outlook gets going, when the EPA releases its rules on power plant CO2 emissions, and when, hopefully, commenters can get back to actually having constructive and respectful conversations about climate science (and not nuclear energy, impending apocalypsi (pl) or how terrible everyone else is). Thanks.