The weirdest millennium
Much research effort over the past years has gone into reconstructing the temperature history of the last millennium and beyond. The new IPCC report compiles a dozen reconstructions for the temperature of the Northern Hemisphere (including of course the original “hockey stick” reconstruction, despite opposite claims by the Wall Street Journal). Lack of data does not permit robust reconstructions for the Southern Hemisphere. Without exception, the reconstructions show that Northern Hemisphere temperatures are now higher than at any time during the past 1,000 years (Figure 1), confirming and strengthening the conclusions drawn in the previous IPCC report of 2001.
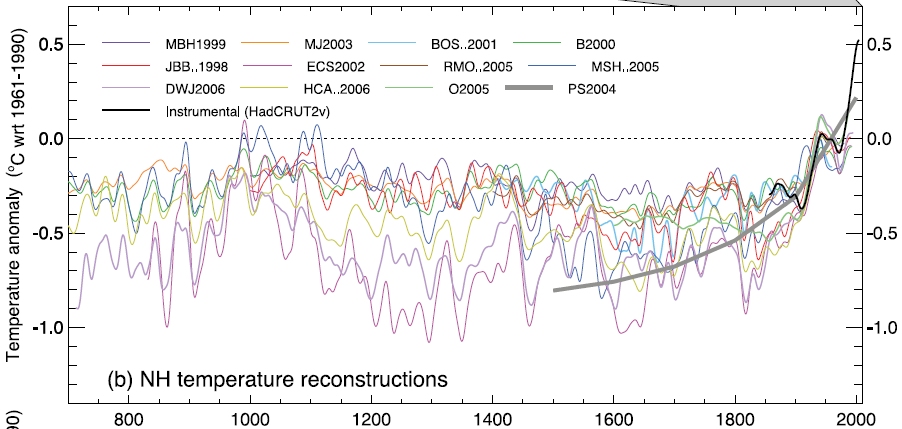
Fig. 1: Figure 6.10 (panel b) from the paleoclimate chapter of the current IPCC report (see there for details).
“Climate sceptics” do not like this and keep coming up with their own temperature histories. One of the weirdest has been circulated for years by German high-school teacher E.G. Beck (notorious for his equally weird CO2 curve). This history shows a medieval warm phase that is warmer than current climate by more than 1 ºC (see Figure 2). So how did Beck get this curve?

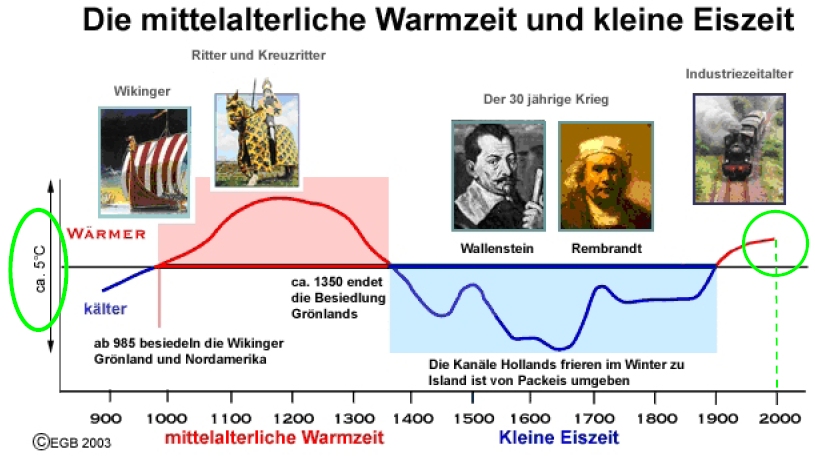
Fig. 2, modified from E.G. Beck (we added the green parts).
The curve is a fake in several respects. It originally is taken from the first IPCC report of 1990: a scan of the original is shown in Figure 3. At that time, no large-scale temperature reconstructions were available yet. To give an indication of past climate variability, the report showed Lamb’s Central England estimate. (Unfortunately this was not stated in the report – an oversight which shows that IPCC review procedures in the early days were not what they are now. We will post in more detail on the history of this curve another time.)

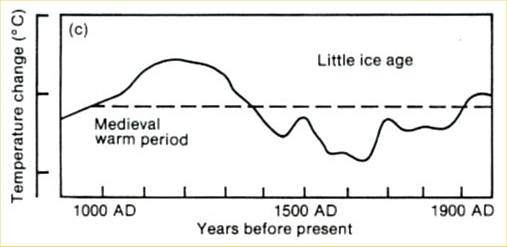
Fig. 3. The past millennium as shown in the first IPCC report of 1990, before quantitative large-scale reconstructions were available. This curve was based on Lamb’s estimated climate history for central England.
But Beck did not stop at simply using this outdated curve, he modified it as highlighted in green in Figure 2. First, he added a wrong temperature scale – the tick marks in the old IPCC report represent 1 ºC, so Beck’s claimed range of 5 ºC exaggerates the past temperature variations by more than a factor of three. Second, the original curve only goes up to the 1970’s. Since then, Northern Hemisphere temperatures have increased by about 0.6 ºC and those in central England even more – so whatever you take this curve for, if it were continued to present, the current temperature would be above the Medieval level, as in the proper reconstructions available today. As this would destroy his message, Beck applied another fakery: he extended the curve flat up to the year 2000, thereby denying the measured warming since the 1970s. With this trick, his curve looks as if it was warmer in Medieval times than now.
When approached directly about these issues, Beck published a modified curve on a website. He changed the temperature range from 5 ºC to 4.5 ºC – but he shortened the arrow as well, so this was just cosmetics. He also added instrumental temperatures for the 20th Century at the end – but with his wrong temperature scale, they are completely out of proportion. (In fact his version suggests temperatures have warmed by 2 ºC since 1900, more than twice of what is actually observed!)
Beck goes even further: in a recent article (in German), he has the audacity to claim that his manipulated curve is right and the more recent scientific results shown by IPCC are wrong. And for years, he has offered his curve on an internet site (biokurs.de) that distributes teaching materials for schools, with support from German school authorities. It is quite likely that his fake curve has been shown (and will continue to be shown) to many school children.


29 May 2007 at 5:33 AM
the Chicken Little story has many variants. the one read to me as a child ends with Chicken Little, Henny Penny, and the rest going gaily into the den of Foxy Loxy never to emerge again - an unequivocal moral here: be silly and get eaten!
it is the climate change deniers who most use this kind of imagery these days, but it seems to me that they are the silly ones, and possibly more likely to get eaten by the fox in the end, time will tell
in the meantime, thanks again for your balanced and good natured reports
29 May 2007 at 5:50 AM
Thanks Stefan,
Congratulations on your recent Science article, which I read only a few days ago.
http://www.pik-potsdam.de/~stefan/Publications/Nature/rahmstorf_etal_science_2007.pdf
It worries me that we (i.e. our politicians) are not going to address the issue of climate change in time to avoid serious consequences. Institutions like the Wall Street Journal and people like Beck are not helping the issue.
What do you know about Beck’s backgraound and motivation? You mention that he is a school teacher. Does he have any qualifications in climatology or even scientific research? To me Beck’s diagram is a schematic, which although misleading as you suggest, is not a scientific graph.
It stikes me as odd that German school authorities accept Beck’s material. I assume you mean state (government) school authorities, rather than private school authorities. Have the school authorities been alerted to the questionable science behind his website?
29 May 2007 at 6:01 AM
Oh my, Beck also presents Gavin Menzies fantasies about the Chinese navy sailing around the North coast of Greenland in 1421.
29 May 2007 at 6:42 AM
I don’t really have as much knowledge about these things as you guys, but I would like to know more.
If there is insufficient data from the southern hemisphere to permit robust reconstructions of the earths temperature over the last 1000 years, is it possible that the southern temperature was a lot hotter than today and the global temperature has actually been reasonably consistent, just shifted from southern hemisphere to northern, possibly caused by the weakening of the magnetic field since Roman times or something that somebody like me wouldn’t know about?
[Response:This is very unlikely. As discussed in the paleoclimate chapter (chapter 6) of the latest IPCC scientific assessment report, model simulations reproduce the gross behavior of the Northern Hemisphere temperature reconstructions, including the anomalous recent warmth, as a result of a combination of natural and anthropogenic radiative forcing. The anomalous recent warmth is associated with the latter. These same simulations predict similar overall behavior for the southern hemisphere. The ‘null hypothesis’ would be that the southern hemisphere mean temperature would have a similar history. Some minor are likely to be observed, due for example to the greater thermal inertia of the southern hemisphere (more ocean surface) which damps the response to high-frequency forcing, and possible differential hemispheric surface temperature changes associated with variations in cross-equatorial heat transport (e.g. changes in the thermohaline circulation). -mike]
If the temperature at the southern pole is well below freezing, even with a rise in temperature of 5C, why would the ice melt or does water not freeze below 0C anymore? (Sorry if that sounds a little patronising, but I’ve asked this question of other people, several times and they tend to change the subject, probably because they don’t know the answer)
[Response:If I understand your question, you are wondering about why people worry about Antarctic melting? The answer is, this isn’t the worry, when we are talking about the vast majority of the continent, which as you correctly point out is well below freezing and will remain so for a long time. But the edges of the continent — in particular the Antarctic Peninsula in summer — can and do melt, but from above (warm summer and sunlight), and below (warm ocean).–eric]
29 May 2007 at 6:46 AM
Thanks, guys, for bringing this stuff to lay readers such as myself. I’m sure I’ve seen that 1990 IPCC graph used elsewhere, but can’t remember where. (I hope your future post on that graph will go into this in some detail.)
A question: in my neck of the woods, there’s a guy who talks about the Climate Audit all the time, and often sends me links to their latest posts. I’m no scientist, so a lot of their stuff is over my head.
How serious are their allegations about researchers not being transparent with data? Their latest crusade is to try to dent the IPCC’s review of the urban heat island literature by saying it’s just one guy [edited]. How valid is this criticism? Note that I’ve read the relevant bits in the IPCC WG1 report, but they’re trying to make an end-run around the IPCC by charging that its review of the UHI literature was biased. This sounds suspiciously like a conspiracy theory to me… Would you agree?
Sorry if this was off topic. Have you thought about compiling a FAQ of “best hits”?
29 May 2007 at 7:05 AM
Some questions.
Did the little ice age exist? Y/N
Did the Medival warm period exist? Y/N
[Response:See our glossary entries on the LIA and MWP. -mike]
Volatility. It looks from the graph that volatility of temperature has gone down. Is this an artifact because we have better measurements, or is another process going on?
Nick
29 May 2007 at 7:47 AM
#5
Urban heat island effects. I heard somewhere they compared temperatures with and without wind and found the same temperature (thus no UHI). My little quibble is whether there’s heat than can emanate from towns that is unaffected by air movements (eg radiation?) and whether that might affect the measurements.
Keep up the good work chaps.
29 May 2007 at 7:49 AM
Leading officials of the German Mining Chemical & Energy Union (IGBCE) have adopted the arguments propagated by E. G. Beck to justify the continued use of domestic lignite despite CO2 emissions that are nearly triple the amount per kWh of gas generation. Lignite surface mining is destroying natural landscape, fertile farmland, and human settlements such as our village of Heuersdorf. With the German economy now recovering from record postwar unemployment, CO2 emissions are again rising, making Kyoto fulfillment increasingly unlikely.
Anyone interested in the German lignite industry may want to consult my study on the topic: http://www.acidrain.org/pages/publications/reports/APC18.pdf
[Response: The IGBCE is really using Beck’s faked materials? Can you point me to sources for this info? If true, it’s incredible. But even the German daily “Die Welt” ran an editorial which stated that “biologist” E.G. Beck has proven that the CO2 concentrations were already above 420 ppm in the 1940s - this is his CO2 nonsense we posted about earlier. (And note how a school teacher is promoted to a scientist to make this sound credible.) -stefan]
29 May 2007 at 7:52 AM
It strikes me as yet another example of past variability being used to undermine the evident validity of GHG increase experiments.
I don’t read German so I’ve no idea whether he draws a direct connection between the cool period and the 30-year war. Could you possibly elucidate on this?
29 May 2007 at 8:14 AM
The millennium past is far, far, less weird than what we are seeing popularized in this one:
http://adamant.typepad.com/seitz/2007/05/dogs_cats_moonb.html
29 May 2007 at 8:30 AM
Where are the error bars on the opening graph?
29 May 2007 at 8:31 AM
Uh, that’s actually figure 6.10 (or actually actually, part of the figure)
29 May 2007 at 8:33 AM
Re #4 and Bobby’s question “If the temperature at the southern pole is well below freezing, even with a rise in temperature of 5C, why would the ice melt or does water not freeze below 0C anymore?”
The problem with Earth Science is that it is not simple as that. First the temperature in the Antarctic Peninsula, where melting is already happening, is not the same as that at the South Pole. Since the South Pole is at a greater altitude and latitude that the Antarctic coast it is much colder, and it is not the ice there that causes concern. The main worry is the Antarctic ice shelves which not only are on the coast but are floating in the sea. This means that, not only are they warmed from above by a stronger greenhouse effect, they are also warmed from below by an ocean which is being heated.
Another complication is that since they are floating, if the shelves do melt then they will not cause a sea level rise. However, it is thought that they are holding back the ice sheets which feed them, and if the shelves do collapse then the ice sheets will slide off the land into the sea and raise sea level. When this happens then the remaining sheets will be converted to ice shelves since the sea level rise will cause the grounding lines to retreat.
The main threat is from the West Antarctic ice sheet, which feeds the Ross Sea ice shelf, and is close to sea level. The rest of Antarctica is fairly mountainous and so, as you suggested, would require higher temperature to melt.
If the West Antarctic ice shelf melted then sea level would rise by about 7 m (20 feet), the same as would happen if the Greenland ice sheet melted completely. However, if the Greenland ice started melting and raised sea level by only 1 m say, that might destabilize the West Antarctic ice sheet. The consequent rise in sea level around the Greenland coast could accelerate the melting there!
If both the Greenland and West Antarctica ice sheets melted, then the subsequent 40 foot rise in sea level would have a devastating effect on most of the great cities of the world.
HTH, Cheers, Alastair.
29 May 2007 at 8:33 AM
And so why not post that one instead?
29 May 2007 at 8:43 AM
Nice work Stefan,
chaps like Beck do not make life easier.
@JBloom
No, as far as I understand Beck does not link climate change to the 30-year war. But in general, he argues that climate change is a natural proces and as such a positive issue. He is just a high school teacher, but it is important to understand that high school teachers in Germany are very smart; many of them are even smart enough to become part of our political establishment (a wee bit of sarcasmn). Any news from Stefans debate with Mangini in “Die Zeit”. IMHO it would be of interest for the English language readers.
29 May 2007 at 8:43 AM
Hi,
What does the large PS 2004 line represent, and how is it most commonly interpreted?
29 May 2007 at 8:47 AM
Hello. I was very surprised to learn that the southern hemisphere data is not included in global climate change models? i understand we can extrapolate to include it but that is not as robust as including it directly. I have always wondered why the southern hemisphere is not experiencing the same global warming that the northern hemisphere is. first of all, is this true? isn’t this a very big problem for modelling global warming? Please help me understand southern hemisphere climate change.
[Response:Of course the Southern Hemisphere is in the models - we’re talking here not about models but about reconstructions of past changes from data such as tree rings, ice cores etc. -stefan]
29 May 2007 at 9:02 AM
In addition to Alistair:
Sea water does not freeze at 0C. Pressure of the ice sheets should also have a signicant influence, or am I wrong?
29 May 2007 at 9:12 AM
If sea water gets diluted by fresh water freezing temperature in general should rise and to a certain extent produce a natural counter effect (more sea ice). Is this reflected in the models for seal level rise? Many thanks.
29 May 2007 at 9:14 AM
Beck may be smart but he’s no scientist. He’s lost in his own ideas & preconceptions (&unfortunately influencing others) while the ice melts. According to the June 07 National Geographic, the Greenland ice sheet is melting twice as fast as it was just 10 years ago.
29 May 2007 at 9:59 AM
Re 17
Hi Peter, I am not sure if I understand your question, but even if I did I doubt that I could answer it
However, I know a man that might.
If you go to Bob Grumbine’s FAQ “ he calculates that the Arctic sea ice will raise sea level by 0.4 mmm. I don’t think he calculates the effect of the Antarctic ice shelves but presumably they would be similar.
I don’t trust ice sheet modelers because I suspect that they ignore terrestrial heat flow, and the reduction in ice sheet friction when sea water floats ice sheets so reducing the normal force from the ice that remains grounded.
Re 18 In most cases the fresh water (in the form of ice/bergs) is removed by wind to warmer climes where it cannot refreeze. That remaining is soon mixed with the much deeper salty water so its freshness is lost.
29 May 2007 at 10:13 AM
Has anyone gone to Kentucky and seen the museum that puts the dinosaurs in with the people chronologically? School aged children in both Kentucky and Germany are being taught this stuff even in this “advanced” age in 2007. Beck is representative of what people do despite the best science.
29 May 2007 at 10:16 AM
“We are unknown, we knowers, to ourselves…of necessity we remain strangers to ourselves, we understand ourselves not, in ourselves we are bound to be mistaken, for each of us holds good to all eternity the motto, ‘Each is farthest away from himself”-as far as ourselves are concerned we are not knowers. –NIETZSCHE
29 May 2007 at 10:29 AM
Could somebody explain the scale on the verticle axis? It s not clear to this non-scientist what “anomoly” means. It appears that for an extended period, until 1950, the “T anomoly” fluctuated between 0 and -1 with a range of fluctuation of about 1/2 to 3/4.
The recent upward spike to +.5 appears to be the start of a trend. However, my misfortunes in the investment arena have taught me to delay drawing conclusions from patterns that are within the range of normal fluctuations. i.e. beware reggression to the mean.
[Response: The axis says “temperature anomaly with respect to 1961-1990″; this means that the temperature values are given as deviation from the average temperature of the period 1961-1990. The graph shows that before this time interval, temperatures were generally colder, while right now we’re about 0.5 ºC warmer than the 1961-1990 average. -stefan]
29 May 2007 at 10:38 AM
The 11th and 12th Century warming is interesting. Does anyone have a good theory for why this occurred?
An aside for Tim Lambert: there is no way you could know that the Chinese DID NOT sail around the north end of Greenland in the 15th Century, unless maybe you can prove that there was ice there at the time. Characterizing it as a “fantasy” lacks proper scientific objectivity. Gavin Menzies engages in speculation based on scant evidence - yes. However, the evidence is not nonexistent. I recall that at one time, the speculations of Alfred Wegener were characterized as “preposterous” by the geologists of his day. Too bad the scientists of his era didn’t live long enough to eat crow.
29 May 2007 at 11:12 AM
11, 14: The issue is the gross misleading statements and figures by Beck, not the “error bars” which are actually indicated in the figure at the link if one was really interested in checking. Why not use the same skepticsm about Beck’s distortion of science?
29 May 2007 at 11:21 AM
Thanks Alistair!
26: I agree with you, the whole article of Beck linked by Stefan is a compilation of false assumptions and crude theories.
29 May 2007 at 11:33 AM
>error bars
The error bars are the gray band in the upper third of the full three-part, full page image. They won’t be easy to see at screen resolution, they’re so close to the temperature graph that the just look like a blur around the main line. See the full chapter for that and much mnore.
You can get the chapter — it’s a PDF file — from the link provided at the top. There are _many_ graphs and figures there, read them together.
This — for about 24 hours after I post it — will open a temporary file with all three parts of that figure: http://pdfdownload.bofd.net/070529/tmp-IVjavr/6626817035.png
29 May 2007 at 11:33 AM
Off topic - but I don’t know where else to ask a question on this site:
This old post: http://www.realclimate.org/index.php/archives/2005/10/global-warming-on-mars/
contains the statement
” the evidence is for significant cooling from the 1970’s, when Viking made measurements, compared to current temperatures”
but without a reference. Nor was I able to find it on the internet. Can someone provide a reference for this statement?
Thanks,
29 May 2007 at 11:39 AM
29. Also off but we have two Peters on board. I change my nick to PeterK to reflect this, however it would be nice to avoid off topic questions.
29 May 2007 at 12:03 PM
#17: Southern Hemisphere not warming:
Where the heck did you get that idea? Check out the online ABC (Australian Broadcasting Commission) news for a hefty dose of grim reality about what climate change is doing to the south. It’s quite interesting to watch the recriminations fly between the political parties as they fight over what can be done about dwindling water supplies and what we should do about our emissions. Looking at it right now I note that by coincidence there is an artical covering new research that shows that the Indian Ocean has increased in temperature by 2 degree over the course of the last 40 years.
(On a brighter note; it looks like we are starting to get some respite via the La Nina pattern that appears to be kicking in - phew!)
29 May 2007 at 12:20 PM
re 25:
One very good piece of evidence that the Chinese were not sailing around Greenland in the 15th century is that there are no known records of such expeditions. We do know that Zheng He led a fleet through Asia and as far as the coast of Africa. So the Chinese were keeping records, and the records have survived.
29 May 2007 at 12:37 PM
A quick question: why do most of the reconstructions considerably underestimate the actual temperature record in the latter part of the millennium (e.g. 1970-2000). Do temperature proxies not respond well to (relatively) rapidly increasing temperatures?
29 May 2007 at 12:59 PM
Kroganchor (#24) An anomoly is the difference between some average value and current values. Temperature anomolies are calculated using the average in a stated interval. For instrumental measurements this is usually a thirty year period, e.g. 1950 to 1979.
Anomolies are usful when you want to compare changes over time or distance for example the change in yearly average temperature in New York and Cairo. Clearly, on average NY is colder in absolute terms, but by looking at the difference between the average temperature in NY over 30 years and the yearly average we get a yearly anomaly and can directly compare the anomolies.
Similarly, if we find the 30 year average temperatures at some place for January and June we can compare trends in monthly temperatures over long periods of time and see whether there is more of a trend in the winter or summer.
29 May 2007 at 1:30 PM
Speaking of what shoolchildren are getting exposed to, the National Science Teachers Association in the US is still recommending Kenneth Greens “Climate Change: Understanding the Debate”. The NSTA was featured on RC some time ago. http://www.realclimate.org/index.php/archives/2007/01/calling-all-science-teachers/
Kenneth Green was the one who was offering $10,000 payments for scientists who would be willing to publicly attack the IPCC report a few months ago, and is associated with the American Enterprise Institute and the Fraser Institute.
Even with all the negative attention the NSTA recieved after refusing to distribute “An Inconvenient Truth” to science teachers, they’re still playing the same game.
29 May 2007 at 1:33 PM
#24 Kroganchor
Global surveys of instrumentally measured temperature are shown as anomlies because it is easier to compare the change of a temperature measurement station compared to itself than to attempt to put all stations on a single absolute scale.
The data shown above are reconstructions from proxy measurements of temperature (such as tree ring widths) and so are inherently more noisy than an instrumental measurement. I guess they are shown as anomlies because they are calibrated using instrumental anomaly data.
If you want to see why the current rises in temperature are more than just an “uptick”, see here:
http://www.globalwarmingart.com/wiki/Image:Instrumental_Temperature_Record_png
This is an instrumental record and is much less noisy than the proxy reconstruction shown above.
29 May 2007 at 1:40 PM
One positive point to make. Do not understate children’s intelligence. School kids in German high schools (Gymnasium) usually have a good sense of humour regarding weird teachers and their theories. I think that logic applies everywhere around the globe.
29 May 2007 at 2:01 PM
>Mars, Viking
This may help:
http://ntrs.nasa.gov/archive/nasa/casi.ntrs.nasa.gov/19910013700_1991013700.pdf
(Various possibilities considered — changes in dust storms seems most likely reason for change in albedo and thus temp.)
The above is — I’d guess — likely the background for the recent story in Science.
I found what’s said to be a copy of that, reposted on this site by someone. Since that’s probably a copyright violation I’ll make a brief excerpt from it instead of copying the copy.
http://www2b.abc.net.au/science/k2/stn/newposts/2889/topic2889064.shtm
— can’t vouch for it — text below excerpted from the copy I found on the abc.net.au page:
A Darker, Hotter Mars
By John Simpson
ScienceNOW Daily News
4 April 2007
“Slight variations in the hue of the Red Planet appear to drive the martian climate. … and could be responsible for a curious increase in the planet’s temperature in recent years, a team of planetary scientists reports.
“Martian temperatures depend in part on how much sunlight is absorbed or reflected. … Spacecraft images show that more than one-third of its surface area has shown seasonal variations that brighten or darken by at least 10%.
“… The researchers mapped albedo changes on the martian surface over 20 years, comparing images from the late-1970s Viking mission to the Mars Global Surveyor mission from 1999. … The overall reduction in albedo, in part, corresponds to the planet’s warming of 0.65°C over 20 years…”
Original behind the subscription barrier at: http://sciencenow.sciencemag.org/cgi/content/full/2007/404/4
29 May 2007 at 2:06 PM
:32
Correct, there is no evidence that Chinese ships ever made it to Greenland. The Chinese expeditions are well known. Many people also believe that the word Greenland (in English) or Groenland in German derives from the medieval warm phase and the meaning stands for nowadays “green”. This is highly disputed by linguists.
Also the viking sagas mention “Vinland”, thougt to stand for “wine”. This is also disputed. By archeological evidence it seems to be true that the early medieval centuries in the Northern hemisphere were a warm climatic period. But one should not draw conclusions like Beck that all shipping routes in the Northern hemisphere were free of ice and Greenland was a place like Florida.
29 May 2007 at 2:13 PM
#36 SomeBeans - Thank you for info. I am still confused. Why do not the fluctuations occur symmetrically around the zero value, if we are measuring anomolies?
29 May 2007 at 2:19 PM
What constantly amazes me is how wingnuts like Beck with their pet theories manage to engage the state apparatus of policy, thanks to those who are gullible and/or have an agenda.
29 May 2007 at 2:30 PM
#40 Kroganchor
The zero for the anomalies is set to the average of some 30 year period (I believe 1961-1990 is traditional in this instance), therefore any anomalies are only distributed uniformly in this reference period - outside this period you will see the effect of long term trends.
29 May 2007 at 3:08 PM
Re #39: [Many people also believe that the word Greenland (in English) or Groenland in German derives from the medieval warm phase and the meaning stands for nowadays “green”.]
The claim that Greenland is green is not entirely inaccurate. At some places on the coast, and in summer, it can appear quite verdant. (Like any arctic or alpine meadow.) This site has some pictures, including reconstructions of some of the original Norse settlements:
http://www.greenland-guide.gl/leif2000/project.htm
Add to the natural greenness some enthusiastic marketing by Eric the Red, and consider that he and the settlers were used to the climate of Iceland and Norway, and “green” seems a perfectly reasonable name.
29 May 2007 at 3:14 PM
re 25
“…there is no way you could know that the Chinese DID NOT sail around the north end of Greenland in the 15th Century, unless maybe you can prove that there was ice there at the time.”
The Chinese kept excellent records, particularly regarding expeditions that were as large and expensive, as a venture such as you suggest would be.
In addition, the one Chinese expedition that came closest stopped short of Europe and (presumably) returned to China after a change in leadership that curtailed further exploration outside of Chine. John S. Lewis describes this voyage in the first chapter of his book “Mining the Sky”. Had they continued on, long before approaching Greenland they would have first visited Europe (because shipping of that time period tended to keep land in sight for a number of reasons for which there is no need to go into here).
Suffice to say there is no record of such an encounter in either European or Chinese history.
29 May 2007 at 3:37 PM
re #25: I recall that at one time, the speculations of Alfred Wegener were characterized as “preposterous” by the geologists of his day.
This is not an accurate account of what happened with Wegener. I’ve dealt with this as part of a different fringe science theory (pseudo and fringe science people are always using a false history of Wegener’s ideas and the reaction to them). I’ll cut and paste from my site regarding Wegener:
According to the typical way of putting it, Wegener put forward a simple theory which said the continents had once been one, had split apart long ago, and slowly moved to their present locations. For this he was shunned and summarily dismissed by all science, only to be vindicated several decades after his death by scientists who realized that Wegener’s theory was exactly what had actually happened.
Good story… too bad it didn’t happen that way.
It seems that comparing themselves to Wegener is a popular pursuit with many people. One problem with their comparison is that the commonly expressed sentiment — “no one supported Wegener” — is wrong. It is also a fact that Wegener’s proposed mechanisms were obviously inadequate, as evidenced by the fact that he himself admitted this was so in the 4th edition of his book. This part about the mechanism has special significance for supporters of the AAT/H who look to Wegener’s theory as a icon, and I’ll get to that in a moment.
Contrary to these comparisons, many people who disagreed with Wegener about his idea took it quite seriously: they disagreed in scientific journals and conferences. Wegener’s idea wasn’t widely accepted because there was no reasonable candidate for a mechanism capable of producing the effect. This is a perfectly reasonable objection to a theory. When finally such a candidate was found, Wegener’s underlying idea — but not his inadequate mechanism — was accepted.
Although some reaction was probably based on being hide-bound, a major reason for Wegener’s idea not being accepted was that he had no reasonable mechanism, apparently no way for it to actually happen. Until a reasonable hypothesis regarding a mechanism was brought forward, it is reasonable to reject a theory. In Wegener’s case, this took quite a few years, decades, actually, and this helped opposition harden against the idea.
Wegener was correct only in the initial part of his claim — the part about what happened. He was dead wrong, almost laughably so, about the mechanism. His mechanism, a combination of pole-fleeing force and the tidal attraction of the sun and moon, was far far less powerful than would be necessary (several 1000’s of times so), and Wegener admitted this himself in the 4th edition of his book.
List and comments from Continental Drift: The Evolution of a Concept by Ursula B. Marvin, Ph.D., Smithsonian Institution Press: Washington, D.C. (1973):
Prominent Wegener supporters included:
Arthur Holmes of Durham and Edinburgh universities, “he was among the earliest and greatest pioneers in developing the radiometric methods for determining the ages of rocks and minerals and the age of the earth itself”; Emile Argand, founder of the Geological Institute of Neuchatel, Switzerland; S. William Carey, professor of geology at the University of Tasmania; C.S. Wright; Lester King, professor of geology at the University of Natal; Professor Reginald A. Daly of Harvard University, who Marvin calls a scientist “of unchallenged prestige”; Alexander Du Toit, Johannesburg, South Africa, author of Our Wandering Continents; Armadeus W. Grabau, “an American paleontologist and author of several textbooks on stratigraphy and index fossils”; Leonce Joleaud, French geologist; R.D. Oldham, “discoverer of the seismic evidence for the earth’s core”; and Dr. W.A.J.M. Waterschoot van der Gracht, “a Dutch geologist and vice president of the Marland Oil Company”.
29 May 2007 at 4:52 PM
Another off-subject comment: Take a look at:
http://www.ns.umich.edu/htdocs/releases/story.php?id=5864
climate monitoring station: Moon-based observatories proposed
29 May 2007 at 5:19 PM
Thanks to #28 for posting the link to the complete charts. I presume that the grey bars on the Hadley reconstruction are some kind of error estimate made by varying the model inputs? What we are interested in in this thread, however, are the error bars on the temperature reconstructions from proxies. What is striking from the IPCC chart is that the “instrumental record” starts diverging seriously upwards from the “proxies” around 1950, and is in the “10%” overlap range by about 1980.
[Response: Actually, you have mis-interpreted the information provided because you have not considered the implications of the smoothing constraints that have been applied at the boundaries of the time series. I believe that the authors of the chapter used a smoothing constraint that forces the curves to approach the boundary with zero slope (the so-called ‘minimum slope’ constraint). At least, this is the what it is explicitly stated was done for the smoothing of all time series in the instrumental observations chapter (chapter 3) of the report. Quoting page 336 therein, This chapter uses the ‘minimum slope’ constraint at the beginning and end of all time series, which effectively reflects the time series about the boundary. If there is a trend, it will be conservative in the sense that this method will underestimate the anomalies at the end. So the problem is that you are comparing two series, one which has an overly conservative boundary constraint applied at 1980 (where the proxy series terminate) tending to suppress the trend as the series approaches 1980, and another which has this same constraint applied far later (at 2005, where the instrumental series terminates). In the latter case, the bounday constraint is applied far enough after 1980 that is does not artificially suppress the trend near 1980. A better approach would have been to impose the constraint which minimizes the misfit of the smooth with respect to the raw series, which most likely would in this case have involved minimizing the 2nd derivative of the smooth as it approaches the terminal boundary, i.e. the so-called ‘minimum roughness’ constraint (see the discussion in this article). However, the IPCC chose to play things conservatively here, with the risk of course that the results would be mis-interpreted by some, as you have above. -mike]
The simple read on this, surely, is that the proxies are not reflecting current temperatures (calibration period) and so cannot be relied upon as telling what past temperatures were either?
[Response: Well, no, actually the proper read on this is that you should make sure to understand what boundary constraints have been used any time you are comparing two smoothed series near their terminal boundaries, especially when the terminal boundaries are not the same for the two different series being compared. -mike]
[Response: I’ve removed a comment which in retrospect was probably inappropriate. -mike]
29 May 2007 at 5:49 PM
re: #45
Wegener’s is certainly one claimed by classic fringers, but the history is actually even more complicated, i.e., for example, Americans were mostly against it from the beginning, whereas there was more acceptance in Europe.
QrazyQat (and anyone else who likes history of science): I recommend:
The Rejection of Continental Drift: Theory and Method in American Earth Science (Paperback) , by Naomi Oreskes.
http://www.amazon.com/Rejection-Continental-Drift-American-Science/dp/0195117336/ref=pd_bbs_sr_2/103-4988737-0613408?ie=UTF8&s=books&qid=1180477984&sr=8-2
Some people at RC may know Prof. Oreskes from a famous Science article:
http://en.wikipedia.org/wiki/Naomi_Oreskes
If you ever get a chance to hear her speak, GO! She gave a fine, lively historical talk last Fall at Stanford on the history of Fred Singer, Frederick Seitz, the George C. Marshall Institute, and related characters, well-known (if not beloved) by RC readers.
29 May 2007 at 7:10 PM
stefan - I was wondering if you had seen this:
http://ff.org/centers/csspp/pdf/20070522_isdo.pdf
“A Science–Based Rebuttal to the Testimony of Al Gore before the United States Senate
Environment & Public Works Committee
National Headquarters: ! Capitol Hill Office:
11781 Lee Jackson Mem. Hwy., Third Floor! 209 Pennsylvania Ave, S.E., Suite 2100
Ph: 703-246-0110 � Fax: 703-246-0129! Washington, D.C. 20003
FF.org � ScienceAndPolicy.org! Ph. 202-454-5249 � Fax: 202-454-5223
CENTER FOR SCIENCE AND PUBLIC POLICY a project of Frontiers of Freedom
Craig Idso
Center for the Study of Carbon Dioxide and Global Change
May 2007″
It written by Craig Idso and is chock full of single proxy studies that ‘prove’ the MWP was warmer than today. I actually do not get why skeptics think that it is SO important what the temperature of the MWP was. Both events, recent anthropogenic warming and the MWP, to me are independent. Even if the MWP was proved in peer reviewed studies to be warmer than today that does not mean that it will not get warmer still from our greenhouse emissions.
It also shows the double speak of the skeptics. On the one had decrying the unreliability and so-called dodgy stats (M&M) in the hockey stick they then use similar proxy data with the same now strangely not dodgy stats to claim that the MWP was warmer than today.
29 May 2007 at 7:17 PM
Beck is not the only person to misuse the IPCC 1990 graph. Christopher Monckton, Viscount of Brenchley, published this graph in his “Apocalypse Cancelled” global warming denial piece in the UK Daily Telegraph, here:
http://www.telegraph.co.uk/news/graphics/2006/11/05/warm-refs.pdf
Monckton claimed that the graph was included in the 1996 IPCC Report, wrongly implying that it originated there, and also falsely claimed that “According to â�¦ Soon and Balliunas (2003)*, the medieval warm period was warmer than the current warm period by up to 3C,” thus implying that the current warming is of little concern. (Apocalypse Cancelled, p.5, References, Sunday Telegraph, 5 November 2006).
In fact, the Soon and Balliunas (2003) paper makes no reference to the current warm period or to 3C. It merely claimed “the twentieth century is probably not the warmest” … “of the last millennium”.
*SOON, W. and Baliunas, Sallie. 2003. Proxy Climate and Environmental Changes of the Past 1000 Years, Climate Res. 23: 89�110.
29 May 2007 at 8:05 PM
I wouldn’t attempt to defend Beck’s rigged graphs; nevertheless, there is significant variation (~1 degree) temperature variation in the last thousand years even when we eliminate the last hundred years.
What accounts for that?
[Response:There is a large literature on this. In my view one of the clearest papers is that by Crowley and Lowry in Science a few years ago. Here’s a link to the abstract.
The temperature variations are probably much less than 1 degree C by the way. One of the points of his paper is that we understand the response of the climate to forcing (e.g. sun, CO2, aerosols) rather well, and looking at the past variations gives us about the same for the climate sensitivity (how much temperature will change for a given forcing) as we already had calculated from first principles. –eric]
29 May 2007 at 10:58 PM
re 47:
*chuckle*
re 49
“I actually do not get why skeptics think that it is SO important what the temperature of the MWP was. Both events, recent anthropogenic warming and the MWP, to me are independent.”
This is much like similar arguments we see from Creationists when they say the fossil record is incomplete and thus fossils cannot be seen as evidence for evolution. (Of course, the argument ignores the fact we do have nearly complete records, as in the case of Whales, but I digress).
The point is, this is not about trying to convince you, any more than creationists are trying to convince me of the veracity of their claims; what is really happening is the denialist industry is putting up smoke screen, creating straw man arguments that are used to appeal to an underinformed public.
The sad part is it works.
Here’s another (rhetorical) question regarding the U.S. and its position on global warming: Many of us expend quite a bit of energy planning for the future of our children; where they will go to school, figuring out what appeals to them, encouraging them to grow, to branch out and learn. We put money away to insure they can afford a good education, dedicate huge blocks of our time to them, are there for them when they need us and generally demonstrate the nuturing tendencies for successful child rearing. It goes even further: when they have children, we are often there for them, helping them when they hit difficult times, providing moral support and the benefit of our own experience to help them through. In short, we evidence the behavior of people who look far into the future with a concern for our offspring and descendants. Also, let’s not forget that as a nation we make a lot of noise about being concerned for our children and their future.
Yet when perhaps the gravest crisis to face civilization rears its ugly head, is shown to be a threat to the future we are trying to prepare for our children, and that we are part of the problem, what do a large segment of us do?
Exactly.
29 May 2007 at 11:35 PM
Beck’s graph of historical “chemical” CO2 measurements (all over the map, often over 400 ppm) gets picked up as “unpublished” source material in Tim Ball’s slide show for the Frontier Centre for Public Policy:
http://www.fcpp.org/pdf/TimBallJan2607handouts.pdf
It’s on page 17 of this PDF (top slide - it’s handout format with two slides per page.)
I note as well the sketchy temperature graph at the top of p. 11 of this PDF. It’s somewhat similar to the 1990 one above but not identical. It lists IPCC 1995 as the source. Is it in fact picked up from the 1995 report, and if so it is a fair reflection of the original? (Sorry I haven’t dug back myself tonight - I’m already up way too late.)
29 May 2007 at 11:44 PM
Stefan, great post and thanks. have you ever considered the need for teaching people about polar cities….?
30 May 2007 at 12:28 AM
Mr. Jones (or Shell?) #47 — the link (as I said in #28) was in the main article — in the line that says: “… from the paleoclimate chapter of the current IPCC report (see there for details).” The link gets you that chapter — it’s a large PDF, and you should really read the whole thing.
In #28, the link was to a temporary copy of the one image ( now expired) for anyone who couldn’t get the PDF.
That’s via the Firefox extension PDFDownload, by the way; they provide the 24-hour temporary copies.
Mike again, thanks for the explanation of the smoothing — worth saving that one as a good explanation of what the picture means. (And, the figure as Spencer notes in #12 could be described a bit more clearly in the main post)
Aside to Robert Rohde — can you include Mike’s explanation in his response to #47 above, if you use the image on globalwarmingart? It really helps understand what the ‘error bars’ mean in the original — clearly it takes reading the whole IPCC report to understand that stuff. I”m as always in y’all’s debt for making it clearer.
30 May 2007 at 2:00 AM
Re: Ender and Mc Intyre. What is for sure as evidenced in core ice samples over the past 650,000 years is that NOW is easily and dramatically the highest the level of CO2 has ever been. Also there is always a slight time lag between when a CO2 spike occurs and the air/sea temp heating up. And the two graphs practically mirror each other. CO2 has a spike and sure enough (every time) temp follows. Look at An Inconvenient truth..Gore has been meticulous to keep the science accurate and transparent. However this current rise in CO2 is not a anomaly or transient spike it is instead an UNPRECEDENTED and disturbing rapid trend. Temp will very very soon follow the CO2 graph up-up and away. Can we hold on the the tigers tail long enough to shoot a tranquilizing dart into her?? Logic says nope..I’m praying to all gods and sundry that I’m wrong.
30 May 2007 at 2:21 AM
Lawrence Coleman (#56) wrote:
27 Apr 2007
The lag between temperature and CO2. (Goreâ??s got it right.)
Filed under: Climate Science Paleoclimate Greenhouse gases Arctic and Antarcticâ?? eric @ 2:45 pm
http://www.realclimate.org/index.php/archives/2007/04/the-lag-between-temp-and-co2/
Actually the paleoclimatoligcal record at least appears to show temperature lagging behind carbon dioxide. There has been some recent debate - and it may possibly have even lead, but it appears to lag by approximately 99 yrs. Feedback. Warming ocens and plants lead to higher levels of carbon dioxide by putting more of the co2 sequetered t0 the atmpospher - for exmple, they reduce the capaicty of the ocean to to but carbon dioxide leads to the buldup of thermalradiation and thus temperatio.
30 May 2007 at 3:31 AM
Re: Greenland and MWP. I have an interesting paper that,although very qualitative, disagrees with the notion of an medieval warm period on Greenland, and for that matter also over the northern hemisphere in general. Nansen F. (1926) Klima-vekslinger in historisk and post-glacial time (”Klimate shifts in historical and post-glcacial times”)
His argument include that the graves dug in the medieval period coincides, with the present day (1920 in this case) depth of the permafrost. The graves were typically 2-3 feet deep, not 6. Also description of the ice-conditions from Norwegian 13. century sources said that the the drift-ice even in august usually extended slightly to the west of the southernmost cape. BTW as seen even from Beck’s curve any Chinese expedition in 1421 is already within the “little ice-age” so I do not see why this should support a theory on medieval warm periods.
On a larger scale Nansen cites from papers on water-level in the Caspian sea that the 12. century likely experienced dry (warm?) conditions, while written sources from Hangchow in China indicate colder temperatures in China than around 1900. The Chinese source described the date of latest snowfall in the spring.
30 May 2007 at 3:33 AM
Thanks Tim, I think the ocean temps have a 100yr lag? Air temp is mainly a result of greenhouse effect. Good point about the warmer it gets the more CO2 released by plants..although..some countries get drier and some wetter..australia for one is getting much drier..so is many countires of europe..so I’m not sure about the net effect of botanical CO2 release. CO2 release is dependant on the concentration of nitrogen in the soil…again drier country’s plants generally have little nitrogen in the soil so as the weather warms the plants will not produce much more CO2. But in wetter area that are getting wetter..plants have an almost unlimited potential to pump out CO2 due to the humous of the soil. In those arid countries or the ones getting nmore arid…vegetation will probably die off with say a doubling of atmospheric CO2 as has been proven to occur.
30 May 2007 at 4:47 AM
Re 47
There might be some problems with the tree ring-temperature relationship. It is known that the tree ring-temperature relationship has changed in the last about 20 years compared to the time between 1850-1980. This also partly explains the differences at the end of the period. It shows that climate change might also influence this relationsip (there are several possible reasons). However, the reconstructions use the time period before 1980 for calibration, and secondly, proxies other than tree rings show a similar temperature evolution. It is very unlikely that a possible change of the proxy-temperature relationship is just similar for a broad variety of different proxies and thus would introduce a considerable bias in the overall picture.
30 May 2007 at 6:17 AM
The most conspicious human activity of the 20th century was continuous hot and cold warfare which has continued unabated to this date. World War II saw the formation of the military-industrial complex (MIC),now immense world-wide enterprise which consumes enormous of amounts energy and resources which also requires even energy for their aquisition and manufacture into weapons. In Fig 1 there is a distinct peak in the temperature curve in the WW II years. Has any consideration been given to assigning a forcing factor for warfare and the MIC’s? The extensive use of jet planes for transport of men and materials to the front (and for removal of injured and dead soldiers from the war theater) must be consuming colossal amounts of fuel, which is probably the real reasons for the increase in prices of gasoline, diesel and commercial jet fuel and of copper and zinc which are used for the production brass for ammuntion. Or put another way, how much carbon dioxide is produced by these activities and other government activities such as intelligence. If world peace were to break out and the MIC’s reduced to near nil, how much cabon dioxide would not be produced?
Will swords ever be beaten into plowshares? We can only hope.
30 May 2007 at 7:09 AM
Becks graph stops in 1970, the IPCC graph in about 1985. Why are the last 20 years of data missing from the IPCC graph?
30 May 2007 at 7:19 AM
Re #57
Good grief - I should know better than to post when I am falling asleep at the keyboard. Typos. Missing lettes. 99 yrs instead of 900 yrs. Oy!
30 May 2007 at 7:28 AM
Lawrence Coleman (#59) wrote:
No - its 900 yrs. Or at least that is what it would appear to be. And not a problem: I just didn’t want to leave an opening for some denialist to come along and give you trouble. Still, I wish I had been a little more awake. No alcohol - it interferes with my meds - just sleep deprivation, which isn’t really a good idea, either. And now my wife woke me up early and the kitten insisted that I come out.
Oh well - maybe I will get more sleep tonight.
30 May 2007 at 9:07 AM
#62
Because it was drawn in 1990?
30 May 2007 at 1:03 PM
Re #52 - most global warming deniers are just cultural misfits looking for attention.
30 May 2007 at 2:20 PM
> I actually do not get why skeptics think that it is SO important what the temperature of the MWP was.
For myself (not a skeptic of AGW), it is very important in understanding what the effect of AGW will be. If the MWP was warmer that currently, that is evidence that current warming is not as harmful as some claim.
30 May 2007 at 2:32 PM
“Re #52 - most global warming deniers are just cultural misfits looking for attention.”
Or, perhaps they are paid shills for wealthy corporations and individuals who are profiting from maintaining the status quo in energy and consumerism. This is certainly true of right wing talk radio in the US.
30 May 2007 at 4:05 PM
>62,
It’s explained in the original chapter from which it’s taken (the link is in the main article, before the comments). Look at the chapter text for the table (6.1) identifying the records charted.
The figure shown here at RC is 6.10(b) from the chapter:
———
Reconstructions using multiple climate proxy records, identified in Table 6.1, including three records (JBB..1998, MBH..1999 and BOS..2001) shown in the TAR, and the HadCRUT2v instrumental temperature record in black.
———
>65, RichardT: No, it wasn’t drawn in 1990. You can look this stuff up.
30 May 2007 at 5:37 PM
The inline response to #47 is, in fact, incorrect - please read the caption of this graphic, which clearly explains the smoothing process used.
[Response:No, actually the inline response is probably correct. The caption doesn’t indicate how many adjacent values were used in calculating the mean used to pad the series. If the number of adjacent values used was one half filter width, then the boundary constraint is essentially identical to that achieved by reflecting the series about the terminal boundary, i.e. the ‘minimum slope’ constraint. Even if few adjacent values were used, the method still supresses any trend near the boundary. –mike]
30 May 2007 at 6:53 PM
Re #67: [ If the MWP was warmer that currently, that is evidence that current warming is not as harmful as some claim.]
Except that the current warming (by which I mean the warming that has happened so far) is not a big problem, and would be even less of a problem if we had reason to believe that it was just another wiggle in the curve, which would soon reverse itself. The problems come from the warming that is predicted to happen; warming that is either “in the pipeline” from existing CO2, or which will be caused by future increases in CO2.
30 May 2007 at 8:54 PM
That’s what I like to see, healthy discourse about the accuracy of postings. With accurate science, the truth will show itself with a wink and a smile, though the topic may be bleak.
30 May 2007 at 9:48 PM
re: #67 Steve Reynolds
Suppose you know that:
a) Today’s temperature (Tnow) is going up very fast, for pretty-well-understood physics, which will make the temperature keep going up (with the usual jiggles) for decades. I.e., the first derivative is certainly positive.
b) There are 6.5B people on the planet, with more to come, compared to ~300M people around 1000AD (http://www.census.gov/ipc/www/worldhis.html), with more people living on the coasts that existed in 1000AD, and stress on water supplies, etc.
c) Now, let us just suppose that you could magically transport today’s instruments back to 1000AD and measure the temperature (T1000AD), so that you got much tighter error bars than one can get with reconstructions.
What exactly would you do different if today:
T1000AD > Tnow ( a little cooler today) OR
T1000AD == Tnow (same) OR
T1000AD < Tnow ( a little warmer already)
Put a different way, if the temperature keeps heading up, does it matter whether the date at which T1000AD == Tnow happens is 5 years from now, or 5 years ago? I.e., does one say: "It won't happen for 5 years, so we're OK ... but in 5 years, I'll decide there's trouble"?
====
For what it's worth, suppose you didn't believe the usual reconstructions. How about glacier records (as discussed in another thread), but more specifically:
a) See Figure 5 in
http://www.unige.ch/forel/PapersQG06/Holzhauser2005.pdf,
which shows the Great Aletsch Glacier’s advances & retreats [a long glacier, which tends to smooth out short-term fluctuations, and is only now responding to 1980s temperatures.]
b) It is worth looking at the chart of Great Aletsch:
http://glaciology.ethz.ch/messnetz/glaciers/aletsch.html
c) and read the actual data, especially the last column, which shows the total length change, which is ~-700m since 1986.
http://glaciology.ethz.ch/messnetz/data/aletsch.html
d) The scale is inverted between a) and d), but if you draw the line from (2000AD, 3300m) to (2027AD, 3300+700=4000m), you get a gross approximation to what you’d expect if the glacier keeps retreating at the same rate. [It may be looks almost vertical, and the point (2027AD, 4000m) is slightly below the bottom edge of the chart.
e) Anyway, read the article (with the caveats & speculations), and assess whether or not the charts make sense, and whether or not something unusual is happening right now.
30 May 2007 at 10:26 PM
Very well, I will accept your explaination as the math is beyond my competence (alas!). I would be pleased if you could explain why a number of proxy records, despite being available up until 1980 or so, have been truncated at earlier times - some end in 1960, some as early as 1930 (eg, Briffa et al) Would any doubts about the reliability of the proxies in this period cast doubt on the same proxies for earlier periods? If not, why not?
31 May 2007 at 12:14 AM
Beck and the rest of his deluded ilk don’t seem to be convincing anyone with their nutty ideas:
275 Australian economists today issued a joint statement, calling on the Australian Government to stop undermining international efforts to tackle climate change and to ratify the Kyoto Protocol without delay.
The statement draws attention to the likely economic damage to Australia that will come from failing to reduce greenhouse gas emissions. They acknowledge that the latest Intergovernmental Panel on Climate Change report presents of new and stronger evidence that global warming is attributable to human activities. They also acknowledge warnings from the CSIRO (Australia’s peak science organisation) that climate change has the potential to seriously disrupt agricultural output, water flows and natural systems in Australia.
Some quotes from the statement:
â��Policy measures are available that would greatly reduce emissions of carbon dioxide and other greenhouse gases at modest economic cost.”
�Australia has shown over the last two decades that it can manage significant change without major negative consequences for incomes or employment and, in fact, with change being a stimulus to improving innovation in the longer term.�
�The Kyoto Protocol represents the first step towards a major international effort to deal with climate change in the long term. The refusal by Australia and the United States to ratify the Kyoto Protocol is undermining global efforts to tackle climate change.�
The statement can be found here. (The first page is the media release. Skip to page two to read the statement.)
31 May 2007 at 12:33 AM
56: “What is for sure as evidenced in core ice samples over the past 650,000 years is that NOW is easily and dramatically the highest the level of CO2 has ever been.”
I hope you’re referring to the last 650,00 years as “ever”. There’s been many times, millions of years back, when CO2 concentration was much greater than today — and much greater than current projections for 2100+.
31 May 2007 at 12:45 AM
66, 68: Who wake you guys up? Can you be a little more creative with your ad hominems? And check your non sequiturs at the door, please.
31 May 2007 at 3:27 AM
This is a bit OT, but I just read THE RISING, a novel about global warming. The premise seems plausible to me (tho perhaps not likely), but what do I know. The Rone & Ross ice sheet distintegrate (like the Larsen B), and this causes the land glaciers to slip into the sea, which causes a 1 foot sea rise. The loss of the weight of so much land ice then causes local Antarctic earthquakes (as noted to happen in Iceland & Greenland), and this causes more ice to break up & fall into the sea….and volcanoes under the antarctic (3 known, one unknown heretofore by scientists) erupt, and that really causes more ice to melt into the sea, and a part of a mountain & lots of big ice chunks to plunge in, causing a tsunami up the Atlantic ocean, wiping out inhabitants on both littorals. And there’s a 3 foot sea rise, which overflows the California aquaducts, making agri there impossible (who knew a 3 ft rise could do that??).
Now the worst is not what global warming does, but how the government and people react. That’s the really scary part. It’s a good, near-future sci fi read, and I thought somewhat more plausible than DAY AFTER TOMORROW.
31 May 2007 at 4:23 AM
Their latest crusade is to try to dent the IPCC’s review of the urban heat island literature by saying it’s just one guy [edited]. How valid is this criticism? Note that I’ve read the relevant bits in the IPCC WG1 report, but they’re trying to make an end-run around the IPCC by charging that its review of the UHI literature was biased.
I don’t trust ice sheet modelers because I suspect that they ignore terrestrial heat flow, and the reduction in ice sheet friction when sea water floats ice sheets so reducing the normal force from the ice that remains grounded.
31 May 2007 at 5:02 AM
I hope you’re referring to the last 650,00 years as “ever”. There’s been many times, millions of years back, when CO2 concentration was much greater than today
True. Of course multicelled life didn’t appear on earth until around 600 million years ago, so as long as we aren’t concerned about having multicelled life anywhere on earth we could use those higher CO2 levels to feel fairly safe about the earth’s future.
Personally I have an interest in the continued existence of multicelled life, so I feel it safe to ignore conditions that existed more than 600 million years ago as irrelevant to what conditions may or may not be acceptable in the modern era.
31 May 2007 at 5:44 AM
[[For myself (not a skeptic of AGW), it is very important in understanding what the effect of AGW will be. If the MWP was warmer that currently, that is evidence that current warming is not as harmful as some claim. ]]
And evidence that heavier-than-air flight was impractical would show there’s no threat to the railroads from an air travel industry.
31 May 2007 at 7:07 AM
Re 81:
I think we need to keep in mind that 4.6Bya there was not only no any celled life on this planet, but there was no planet on this planet. Prior to the Cambrian Explosion, there were no advanced civilizations, much less not-so-advanced one, or even cockroaches, rats, used car salesmen, or any of the other scourge of society.
We should also keep in mind that there are parts of this planet where multi-celled intelligent life live that are a heck of a lot warmer than other places, and particularly, a heck of a lot warmer than what the more northern and southern extremes are ever going to be under any global warming scenario. Some of y’all might think 40C/104F is a hot day. But some of us are grateful for days that are only that hot. If things start getting over 45C/113F, then I might think it’s really hot.
There are plenty of reasons to be concerned about the things that are believed to lead to global warming. Suggesting all higher life forms are going to go extinct any time soon is the sort of doom and gloom that people use to discredit the underlying science.
31 May 2007 at 7:16 AM
#67 #81
[[For myself (not a skeptic of AGW), it is very important in understanding what the effect of AGW will be. If the MWP was warmer that currently, that is evidence that current warming is not as harmful as some claim. ]]
If the MWP was warmer than today it means the earth’s more susceptible to feedbacks, forcings, influences etc. The exact opposite of what you’ve said.
[Response: In my opinion, the magnitude of the MWP would have to be (globally) much greater than today’s level to have any implication at all. That is, given the current uncertainties in the forcings (principally solar and volcanic) and the continued uncertainty in the climate sensitivity only a dramatically warmer MWP will be any kind of constraint. Thus the couple of tenths of deg C that are in dispute here are simply just not that relevant for the questions of future climate. They are very interesting in terms of climate history and spatial patterns of change of course, but the MWP question is just not that important. - gavin]
31 May 2007 at 7:57 AM
Re:76 Rob B. But I bet you’re glad you weren’t around thouse millions of years back. Think you’re missing a little piece of the puzzle..this time it’s us who have changed the biochemistry..not comets, not dinousaurs breaking wind…this time Rob..it’s US!
31 May 2007 at 9:10 AM
“66, 68: Who wake you guys up?” -Rod B
It was this guy that awakened me:
The Greenhouse Effect: Science and Policy
Stephen H. Schneider
Science 10 February 1989 243: 771-781 [DOI: 10.1126/science.243.4892.771] (in Articles)
……of Science Article Article The Greenhouse Effect: Science and Policy Stephen…Global warming from the increase in greenhouse gases has become a major scientific…That infrared radiation is trapped by greenhouse gases and particles in a planetary atmosphere……
(Perhaps someone can produce the abstract.)
Even back then it was apparent that the unpredictability of climate (and therefore local weather) was going to have major detrimental effects on our global civilization and the planetary biosphere.
The science is mostly in, local climates almost everywhere are changing in unpredictable ways, worldwide agriculture is starting to feel these changes, species die-offs are an almost daily occurrence, global average temperatures are up, but the denialists continue to spew their scientific sounding nonsense. Maintenance of the social and economic status quo seems to be a principal explanation. Got a better one?
31 May 2007 at 9:56 AM
I have a question about temperature. There is plenty of talk about the global rise in mean temperature. What I am curious about is the projections for temperature variability. It’s well documented that the diurnal temperature range is declining, and thus that the rise in mean temperature is due to disproportionate rise in daily minimum temperature. If we look at a time series of daily temperature (min, max, or average), how is the variance and correlation structure expected to change, if at all? Can someone give a brief answer and perhaps point to references on this?
31 May 2007 at 10:50 AM
Earth Nears Tipping Point
http://www.csmonitor.com/2007/0530/p02s01-wogi.html
Looks like we have 10 years once again to mitigate climate change and here is the reason why I doubt it will happen even with all of the noises coming from the climate science community.
http://gristmill.grist.org/story/2007/5/29/14713/4957
Looks like those with the money (ie the fossil fuels industry) will gets its way with the present US administration anyway and with the present administrations policy comes no hope for the rest of the emerging world economies as well.
So it looks like no matter what exerts say politicians and fossil fuel lobbyists are going to screw us in a manner of speaking.
[edit]
31 May 2007 at 10:56 AM
> a little more creative with your ad hominems? And check your non sequiturs
The Contributors here are quite good at pruning that sort of thing. Trust me on this. If they’d let every draft I tried to post appear in public, I’d be recognized as a far more caustic and intemperate writer. “Are you sure you’re not from [a lobby, a thinktank, the flying saucer] isn’t an ad hominem, tho’ it’s not snugglebunny-grade writing. An ad hominem would be “look at what this person wrote elsewhere, he makes clear he’s from (or soon going to) [a lobby, a thinktank, Antares] his argument’s not worth considering” —- the point is to try to get the source and documentation, to understand what’s real, on the facts.
Always the facts, the cites, the careful reading of the text and the explanation by those who understand the particular area of the science.
31 May 2007 at 11:23 AM
Thank you for doing everything here at realclimate. It is definitely clearing a lt of things. However, i’ve heard of some new papers in geophysical research letters that seem to suggest warming on neptune and mars or something, and that the warming correlates well with the solar output and earth’s temperature trend. Now even though correlation is not causation, they were very convincing…any chance you could cover those articles? I’m being bombarded by so much criticism and it would be great to have an argument back at them. Thanks!
31 May 2007 at 11:38 AM
The Russians are coming…to save the day!
http://en.rian.ru/russia/20070530/66362712.html
31 May 2007 at 11:59 AM
Re #85
You might want to have a look at these two posts. The first is specifically about Mars - but touches on Pluto’s presumed “global warming.” (Didn’t know it got that much sunlight.)
5 Oct 2005
Global warming on Mars?
Guest contribution by Steinn Sigurdsson
http://www.realclimate.org/index.php/archives/2005/10/global-warming-on-mars/
3 Aug 2005
Did the Sun hit record highs over the last few decades?
Guest commentary by Raimund Muscheler
http://www.realclimate.org/index.php?p=180
Anyway, some others might have more information for you - and I might be able to get back later today.
31 May 2007 at 12:00 PM
I have read this article with interest, and read the paleoclimate section of the IPCC report, and there are two things that still bother me:
1. In the graph shown above from the IPCC report, what makes the “hockey stick” shape is the temperature record appended to the end of the proxy record. Without the temperature record the time period from 1800-2000 looks very much like the time period from 800-1000. The proxy records are truncated earlier than the temperature record, but to be consistent with the temperature record, they would need to show a dramatic change between the end of the time series and now. Has anyone looked for this?
2. I haven’t seen an explanation of what caused the Medieval Warm Period and the Little Ice Age. The IPCC report shows some correlation with solar output, but the difference does not seem to be large enough (<0.5 W/m^2). Is there a generally accepted explanation for what caused these climate changes?
31 May 2007 at 12:19 PM
re: #73: sorry, I messed up an edit: should have said:
T1000AD < Tnow (already warmer)
If one says "(T1000AD > Tnow) = OK, but thinks in terms of time instead, with (smoothed) rising temperatures, all this means is that on some date in recent past or near future), the world suddenly goes from OK to not-OK, which makes no sense at all. The first derivative of the temperature is positive, and I don’t see any evidence of a negative second derivative to change that.
Anyway, if you don’t like the usual proxy reconstructions, how about glaciers?
a) Look at Figure 5 in
http://www.unige.ch/forel/PapersQG06/Holzhauser2005.pdf,
31 May 2007 at 12:48 PM
There is this article on Mars:
http://www.realclimate.org/index.php/archives/2005/10/global-warming-on-mars/#more-192
I thought I remembered something around here about Neptune but I can’t find it at the moment…
31 May 2007 at 1:00 PM
Rod B (#76) wrote:
I don’t know specifically how many times they have been above today’s level of 378 ppm (is that the current?), but with the strong feedbacks for the carbon cycle (not included in the IPCC WG1 AR4 estimations), models are projecting between 730 and 1020 ppm by 2100. Levels of 1000 ppm or more have been associated with ocean anoxia and mass extinctions, both on land and in the ocean. Of course, the anoxia due to temperature would take a while to work its way through the ocean. Centuries, most likely. Algae blooms and the anoxic deadzones they leave behind are of more immediate relevance as far as the ocean is concerned.
31 May 2007 at 1:12 PM
Kenny, keep in mind that each planet has different drivers. Solar radiation on Mars is only 36% what is on Earth. And for Neptune, the energy from the Sun is tiny (about 0.1% what Earth receives). The Mars climate models explain the effect on Mars quite well, and we have yet to see a full “year” for Neptune. Anybody who makes this argument is either ignorant or deliberately trying to obfuscate the issue.
31 May 2007 at 1:39 PM
Here’s a link to the “Neptune’s warming” paper:
http://www.agu.org/pubs/crossref/2007/2006GL028764.shtml
Ray Ladbury paraphrased the abstract:
“Just because there’s no statistically significant correlation and we have no mechansim how this would occur doesn’t mean we’re wrong.”
31 May 2007 at 2:01 PM
Re #83 (comment)
Gavin, the height of the MWP is less important than the variation of temperature between MWP-LIA-current. Depending of the temperature reconstruction, the variation is 0.1 to 0.7 °C and additional some 0.1 °C at maximum average induced by volcanic explosions in all reconstructions. The range is pretty wide, as that represents natural (mainly solar) variability in the past.
I know that some (like Briffa) assume that a larger natural variability in the past is a sign of a larger sensitivity for any forcing (assuming, as in most climate models, that the different forcings have similar sensitivities). Others like Esper, Luterbacher, Moberg, ea. have the opposite opinion:
“So, what would it mean, if the reconstructions indicate a larger (Esper et al., 2002; Pollack and Smerdon, 2004; Moberg et al., 2005) or smaller (Jones et al., 1998; Mann et al., 1999) temperature amplitude?
We suggest that the former situation, i.e. enhanced variability during pre-industrial times, would result in a redistribution of weight towards the role of natural factors in forcing temperature changes, thereby relatively devaluing the impact of anthropogenic emissions and affecting future predicted scenarios.”
I agree with the latter (but you know, that I am convinced that the role of solar is underestimated in current models)…
31 May 2007 at 2:42 PM
#43, You must also talk to an Icelander, as I did, and the story of Greenland was a practical joke by Icelanders who were perfectly happy to keep away unwanted visitors by diverting them to greener pastures.
31 May 2007 at 2:48 PM
Re SomeBeans (#87):
Some more info on Neptune…
The following post analyzes the paper on the statistically insignificant correlations (by the authors’ own admission) between Neptune’s brightness and Earth’s temperature, then in an update includes a link to a tech paper which concludes that the evidence regarding Neptune is most easily explained by seasonal variability (seasons last longer out there). Given the problems Connelly cites, it seems odd that the orginal paper ever made it through peer review.
Suggestive correlations between the brightness of Neptune, solar variability, and Earth’s temperature?
Posted on: May 10, 2007 4:02 PM, by William M. Connolley
http://scienceblogs.com/stoat/2007/05/suggestive_correlations_betwee.php
31 May 2007 at 3:16 PM
Re #73,
John,
The glaciers in the Alps show several retreats and advances in the Holocene. Wood from trees growing far higher than today (and human bodies) are now released by retreating glaciers. That points to higher temperatures and/or less precipitation in the past. One investigation on that subject points to the possibility that Hannibal could get over the Alps without problems, because there were no ice barriers…
Some references:
http://adsabs.harvard.edu/abs/2004AGUFM.U43A0743J
http://tinyurl.com/24y999
31 May 2007 at 4:01 PM
Ref comment #2:
“It worries me that we (i.e. our politicians) are not going to address the issue of climate change in time to avoid serious consequences. Institutions like the Wall Street Journal and people like Beck are not helping the issue.”
Seems to me there’s an even more insidious level of abrogation of responsibility at play here. To wit:
CLIMATE: NASA chief questions need for action on warming
http://www.eenews.net/Greenwire/2007/05/31/#10
Lauren Morello, Greenwire reporter
“NASA Administrator Michael Griffin questioned the need today for action against global warming in a taped radio interview that aired just ahead of President Bush’s announced effort to help forge a new international agreement for curbing greenhouse-gas emissions.
Griffin told National Public Radio he has “no doubt that a trend of global warming exists” but said he is unsure that it is “a problem we must wrestle with.”
The majority of scientific evidence supports observations that the Earth’s average global temperature has warmed by about 1 degree Celsius over the last century, Griffin said.
“Whether that is a long-term concern or not, I can’t say,” he said. “I don’t think it’s within the power of human beings to assume that the climate does not change, as millions of years of history have shown.”
Griffin further addressed climate change in a statement released by NASA today in response to the NPR interview.
“NASA is the world’s pre-eminent organization in the study of Earth and the conditions that contribute to climate change and global warming,” Griffin said in the statement. “It is not NASA’s mission to make policy regarding possible climate change mitigation strategies.”
In response to Griffin’s interview, House Science and Technology Committee Chairman Bart Gordon (D-Tenn.) issued a statement questioning whether NASA is adequately carrying out its scientific duties related to climate change.
“Based on NASA’s own five-year budget plan, the agency will be unable to start any of the new Earth observations initiatives recommended by the National Academies for the foreseeable future,” Gordon said. “That’s not going to get us where we need to be in our understanding of climate change. NASA needs to do more.”"
31 May 2007 at 4:24 PM
I hate to break a thread, but the new millennium just got weirder.
Where is RealClimate with the Michael Griffin - James Hansen thing?
31 May 2007 at 4:54 PM
I’m wondering if anyone here has a reaction to Michael Griffin’s comment on NPR today that
“I would ask which human beings â�� where and when â�� are to be accorded the privilege of deciding that this particular climate that we have right here today, right now is the best climate for all other human beings. I think that’s a rather arrogant position for people to take.”
I heard this on the radio this morning and was astonished. My take is here (and I gave realclimate.org a plug):
http://www.ourtask.org/2007/05/nasa-administrator-not-sure-global.html
31 May 2007 at 4:57 PM
I don’t think I can edit my comment, but the a?? characters are supposed to be em dashes…. looked OK in preview…
31 May 2007 at 5:22 PM
I know I seem to be nit-picking on various comments, but I feel you need to be careful and precise in what you say, lest these comments come back and bite you on the nether regions! In that context…
Gavin, in response to #83 says “Thus the couple of tenths of deg C that are in dispute here are simply just not that relevant for the questions of future climate.” This is a rather dangerous position to take because sceptics would suggest that “If a couple of tenths of a degree C is not relevent to future climate, then why the fuss about the couple of tenths of a degree C rise that happened over the 20th C?”. Please be more careful.
[Response: The warming over the last hundred years is significantly more than ‘a couple of tenths of a degree C’ - i.e. 0.8 deg C (and counting), but the issue with climate change is not that the last hundred years have been disastrous, but that the future continuation of this process may be. And there, we are taking about mutliple degrees. -gavin]
31 May 2007 at 6:45 PM
Can you provide us with the most useful action can individuals take to counter the comments by NASA Administrator Michael Griffin? Is there someone (significant) at NASA we can email to register our displeasure? Should we contact our congressional representaitves? Which ones are most significant with respect to this issue?
Thanks.
31 May 2007 at 7:46 PM
Yet deciding that a significantly warmer earth is best for all other human beings (which is what doing nothing amounts to) is not an arrogant position to take, apparently.
31 May 2007 at 7:57 PM
Since the topic of “global warming on other planets” has emerged again, I would like to mention a point I noticed.
If GW is happening on another planet, the effect could be related to the issue of proximity: being closer or farther away, as a function of phase in the orbit. In effect, a “seasonal” issue (although I guess planetologists like to use that term for effects due to axial tilt with respect to the ecliptic plane; I’m using it here to refer to expected changes over the course of a planetary year). But if the effect is happening within a seasonal timeframe, then you can’t prove that it’s anything other than a seasonal effect, so it’s not evidence of extra-terrestrial GW.
On the other hand, if it happening on a timescale that exceeds the planetary year; and if it dominates the seasonal changes, then whatever is causing it must have a greater effect that the seasonal changes. In particular, if it is laid at the door of increase in solar luminosity, then that increase has got to be a bigger effect than the natural change in solar intensity due to the changing radius: If the effect of the “GW” is bigger than the effect of the seasons, the cause of the “GW” must be bigger than the cause of the seasons. This puts a lower limit to the required change in luminosity required to explain the “GW” on other planets.
But the seasonal variation is well-knowns: Since
TSI is proportional to luminosity/(orbital_radius)**2,
the fractional variation of TSI is (2*delta_r)/(average_r), which is
4*(aphelion - perihelion)/(aphelion + perihelion).
The two candidates of interest (because of observed time frames of the putative “GW” events) are Mars and Jupiter. When you do these calculations, you find a required change in solar luminosity of 37.4% and 19.7% respectively. However, since TSI as measured on Earth has only varied in the range of about 0.1% since 1988, you can’t possibly seek an explanation of these non-seasonal behaviors in the Sun.
So, in summary, GW on Mars and Jupiter certainly cannot be blamed on the Sun; and events on the other planets can credibly be attributed to merely seasonal variation.
31 May 2007 at 8:28 PM
re: #100 (re #73, and check #93 for edit fix)
Ferdinand: yes, what they say is completely consistent with the Holzhauser paper which goes back to 1500BC. The Hormes Unteraar Glacier paper covers earlier periods, although the latest one meshes with the earliest period on the Holzhauser paper.
Is your argument that it was warmer than currently during some periods before 1500BC?
If so, we agree 100% … of course, there should have been warmer periods back then. See: Brian Fagan, “The Long Summer” for example.
I haven’t found a handy chart of typical solar insolation In Switzerland (~47 degrees N), but:
a) Based on normal orbital cycles, and eyeballing a few charts, I see that the typical July solar insolation at 30 degrees N should have fallen from a peak ~550 W/m^2 10,000 years ago to ~ 475 W/m^2 now. These would be less in Switzerland.
b) Of course, there would be imposed the usual 11-year jiggles, plus any Maunder Minimum equivalents to drop the temperatures, plus any other of the usual effects.
c) But still, one would expect that even with the usual jiggles, overall natural temperatures should have shown a slow cooling trend last 10,000 years, i.e., especially more than 3500 years ago, there should have been warmer periods, simply because the typical insolation should have been higher.
c) But, the Unteraar is heading up the hill just like the Great Aletsch, see:
http://glaciology.ethz.ch/messnetz/glaciers/unteraar.html.
d) Hannibal crossed the Alps Fall 218BCE, in middle of a long Aletsch retreat period centered on 1AD in Holzhauser Fig 5, and people still debate his exact route:
http://www.livius.org/ha-hd/hannibal/alps.html,
http://news-service.stanford.edu/news/2007/may16/hannibal-051607.html: maybe thsi research will produce results.
But for now, if they went via the route occupied by Montgenevre … via Googlemaps, the village is along one side of the pass, and the ski resort is across the street, so I doubt there are “ice barriers” these days, although they certainly get snow.
Anyway, all of this perfectly consistent with natural cooling (with jiggles) over millennia, shorter earlier glaciers, longer recent ones … except recently, when the glaciers turn and retreat, heading soon (decades, at current rate, for Aletsch, anyway) further up than any time in last 3500 years…
31 May 2007 at 8:52 PM
It’s mind boggling that the NASA Administrator would make a statement that he’s unsure that climate change is a problem that must be dealt with. What is he thinking? That if we don’t worry about it will go away? I can’t understand how someone in his position, wouldn’t know about the problems that are being confronted today from the effects of climate change, such as native residents of northern Canada and Alaska,dealing with the adverse effects of melting permafrost. The residents of low lying islands in the Pacific Ocean are seeing the results of rising sea levels at this very time. There are many other detrimental effects that have been documented on this site, before, such as dying coral reefs,and the loss of reflecting ice and snow, both at high altitudes and in the polar regions, reducing the Earth’s albedo, which leads to more heating.
I suppose we shouldn’t be too surprised. The foot dragging by this administration’s political appointees, as opposed to career professionals, in the scientific area, has been evident from day one.
31 May 2007 at 9:16 PM
Some misinformation about Antarctic ice appears in this thread, so far uncorrected, I think. Specifically I believe Eric’s reply to #4 is incorrect.
The West Antarctic ice sheet is not particularly melting; it is warming up a bit, it is softening a bit, the ice shelves holding it back are retreating, all of which causes the ice to flow faster. If we get the several meters of West Antarctic driven sea level rise it will predominantly be because of what amounts to a mechanical failure of the ice sheet.
Glaciers flow downhill and warmer glaciers flow downhill faster. Above a certain flow rate there is no equilibrium with precipitation and the glacier vanishes. The West Antarctic can be considered a few huge glaciers, and this idea holds for them as well.
31 May 2007 at 9:49 PM
RE 89: I ran into someone like that Kenny. All you have to do is conduct your own quick research. Space.com and NASA are the good, readily available sources for the layman.
Any assertion that outer solar system planets could be warmed by the sun in a significant way appears unfounded. The kind of solar output variation necessary to warm up Pluto or Neptune would be very noticeable to us. Keep in mind that no variation in solar output was ever actually observed until the age of satellites. The gas giants are mostly driven by their internal heat. In the case of Jupiter, the internal heat effect is far beyond any other input (see space.com). Most outer planets’ climates are a matter of educated guesses since there has not been enough observation to cover even 5 “years” of it. In other words, we don’t exactly know what the “climate” of Saturn or Neptune is really like and we are not in a position to say affirmatively that it is changing. As an example, Pluto takes 248 years to revolve around the sun. Any latest observation on those planets is likely to be the best to date, making comparison inappropriate, and will be a punctual observation, i.e. not a long term trend. In any case, these planets’ and their atmosphere are so dfferent from ours that any comparison beyond a specific point is very hypothetical.
There is a lot of noise about Mars, it is quite undeserved. Mars’ seasonal cycle naturally exposes it to more intense southern hemisphere summers, which are not entirely compensated by its northern hemisphere winters, hence a natural deficit in southern carbonic ice (see NASA, good discussion on that). How much of an anomaly the recent southern hemisphere CO2 ice deficit constitutes is debatable. Furthermore, dust storms appear to be a major driver of Mars weather and short term climate. Lastly, the correlation between Mars and Earth is actually weak to non existent; what the Mars-global-warming proponents ignore or leave in the dark is that the recent warming trend (if there is such a thing) is quite recent. Mars went through a signficant cooling period after the Viking landings in the 70’s, while Earth’ climate was doing its upward temperature spike.
Last but not least, Venus, close to the Sun and sporting enormous GH effect, does not show signs of “global warming” like Pluto. Asserting that a solar output variation capable of warming Pluto would leave Venus alone does not seem to make much sense.
31 May 2007 at 10:18 PM
John Mashey (#73) wrote:
That is pretty much the same which is happening to approximately 90% of all glaciers.
For global glacier mass balance, see the chart at:
State of the Cryosphere: Glaciers
http://nsidc.org/sotc/glacier_balance.html
I think everyone should also keep in mind that even if we were to hold constant the amount of greenhouse gases which are already in the atmosphere, the temperature would continue to rise for some time to come.
Please see:
Yet we have actually increased the rate at which we are dumping CO2 into the atmosphere…
For more on this, please see:
In an effort to downplay the seriousness of today’s climate change, contrarians will argue that some glaciers were smaller a thousand years ago, but given the way things are looking, our surpassing this is a foregone conclusion. Their argument might be carry some weight - if glaciers were to miraculously freeze where they are now. As things are, it is about as relevant to the current state of our climate and the direction that it is headed as the seasons of Pluto.
31 May 2007 at 11:19 PM
RE #89 continued: About solar output variations, a lot of denialists like to refer to the Sulanki paper (2004, I think). It is quite helpful that this paper is actually available online as a PDF file (I found it easily with Google). The conclusions section is very clear as to how much of the current warming can be attributed to solar variation and it is no more than 30 %. This would be under the extreme assumption that previous temerature changes would be entirely due to solar output, a scenario that is virtually impossible.
I also read about Neptune that the supposedly increased brilliance is in the blue spectrum, which would correspond to an amount of energy that simply makes no sense. I haven’t verified that with any more credible source, however.
1 June 2007 at 1:47 AM
Re 36: > … global warming art etc link
I have reservations about this graph (is it HADCRUT3?) as it fails to verify my own particular theory of global warming. This theory predicts that there should be an SST pulse starting in late 1939 and tailing off after the battle for the Atlantic is won. A study of the rise rate — grab a passing student someone — should confirm that the various effects of oil/surfactant spill are what is causing our current warming. But look at the graph — it begins to rise before 1938 which presents a problem.
Now look at the raw data before the so-called ‘bucket’ correction is applied: this correction was imposed to allow for the differing methods of measurement before engine intake thermometers were installed, raising SSTs before 1938. IMHO, it should be looked at again: it was originally accepted as it enabled one of the GCMs to forecast land temperatures correctly and, while it may have achieved this aim, it fails the test of the kreigesmarine signal.
‘You cannot experiment with the climate’. How many times have you heard that? Well, Donitz and his kreigesmarine did and the signal and response is there to see. Do you know what it looks like to me? It looks like a tiny version of the PETM.
More details of the AGW theory of surface pollution on my website at floodsclimbers.
JF
1 June 2007 at 1:55 AM
#99 Timothy Chase
Cheers - that’s what I was looking for!
1 June 2007 at 2:05 AM
Re 61: “In Fig 1 there is a distinct peak in the temperature curve in the WW II years. Has any consideration been given to assigning a forcing factor for warfare and the MIC’s?” Harold Pierce Jr
On the basis of that bulge I have constructed a theory of global warming that explains much of our current problem. Briefly, oil spill and surfactant pollution alter the properties of the ocean surface, reducing cloud formation, lowering albedo and changing oceanic nutrient flows. It’s on my floodsclimbers website. No-one takes it seriously, of course, but it’s amazing how many predictions it makes about the process of AGW, even the isotope smoking gun. I’ll not hold my breath about a grant, though — I’ve watched a student struggle to finish a thesis on phytoplankton carbon fixation without a grant and that’s about as cutting edge GW stuff as you can get. No chance, then, for something as off-the-wall as this theory.
JF
1 June 2007 at 3:05 AM
re: 89
About Martian warming, I found a french article talking of it, I’ll try to make a ruff translation (here’s the source anyway for all french lovers
): http://www.cieletespace.fr/Actualites/544_rechauffement,climatique,sur,mars,,.aspx
“Planet Mars is heating. It’s surface temp. would have increased by 0.65°C during the 20 last years, says Lori Fenton, from Carl Sagan Center, California.Comparing maps of the planet albedo, from Viking probe between 1976-1978 and from Mars Global Surveyor between 1999 and 2000, the scientist discovered many regions of southern emisphere darkened with time. And, like earth, the darker a region is, the more it “captures” heat.
Why those austral regions became so dark? Lori Fenton says the clear dust recovering those areas have been swipped by solar induced winds. And this process started to spiral out of control: upon the darkened areas, atmosphere began to heat, making the winds blow stronger, swipping away even more dust.
To estimate global increased of temp. on Mars surface considering the surface of darkened regions, the american scientist used some models used notably for earth weather predictions. From its results, and if warming doesn’t stop, Mars polar sheets could disappear in 500 years. It’s unlikly to happen, commented many planetologists, considering the large number of phenomenas that could inverse this tendency, for exemple large scale dust storms.”
I didn’t manage yet to find the original work from Lori Fenton, but if someone finds it I’d be glad to read it.
), this can only be explained by fluctuations in solar radiation and therefore it also explains earth warming, I think you can consider this person as pretty ignorant about everything concerning climate AND astronomy.
So what can we conclude from the martian warming? Not much apparently, as it seems to be due to some very specific regional phenomena (the dust deposits), and that the main factor here is albedo, not solar radiation. Secondly, this is based on a ruff 5 years-long collect of data, on an overall 20 years period… Not much to make a robust trend, is it?
Each planet is working its own way on this solar system, due to its atmosphere, specific climatic phenomenas, orbit, size and so on and so on. So when one tells you that because there is a warming on Mars or Neptune (I wonder how relevant it is to compare the atmosphere of a telluric planet with the one of a gaz planet
And if you wanna be a little sarcastic, you can always say that if there was actually a trend of global warming concerning all of the solar system, you should observe it on all the planets, and not only 3
1 June 2007 at 3:07 AM
#92: There is no generally accepted view on what caused the MWP and LIA. Some have pointed out that the peak of the LIA coincides roughly with the ‘Maunder minimum’ in the late 17th century during which there were virtually no sunspots - but note the word ‘coincides’. Others say that the climate is a complex system that fluctuates in a rather irregular way and it is wrong to ask for a ’cause’ of each maximum and minimum.
1 June 2007 at 3:41 AM
This website has been very good at putting the case for AGW and defying the contrarians and denialsists but that battle seemingly seems to be over no with the current administrations admission on AGW being real and worrying. What seems to be happenning now is that the worlds economies seem to want to limit climate change to 2 degrees C or 500 ppmv or CO2 which although possible still seems unlikely.
Can real climate not run an article on what the consequences are for a average warming of 2 degrees C and when it is likely to happen and how likely it is that we can achieve this.
President Bush keeps on harping on about breakthrough technologies but no one seems to know what they are and how long it will take to deploy them in order to achieve the desired results. Is the Bush administration stalling and providing a smoke screen in order to continue their quest for the continuation of the fossil fuel age ?
1 June 2007 at 8:13 AM
RE: 121 Perhaps, but it’s equally likely in my view that the go is a Rovian attempt to take the issue away from the Democrats. Sort of “Don’t worry about GW–we’ve addressed it, and it’s not an issue anymore. Move along now. Nothing to see here. There are no droids here.” Or, toward another movie theme, “Earl explained it to me: we plan ahead, that way, we don’t do anything right now.”
1 June 2007 at 8:25 AM
Re: Pete Best, If governments just dont get it re: climate change, then it up to us and business to take the initiative and take the lead. We dont have time to wait for governments to argue as to the ways to tackle climate change without effecting one’s economy. They dont seem to get the seriousness if the situation. The US and many world economies wont survive anyway if climate change gets out of hand. It will be the countries that can survive on less that will triumph. If Bush took this as seriously as the threat in the corny movie ‘independance day’ we might get some action…he must realise that this threat is absolutely no less in magnitude only in slow motion. If we fail, our young children now may never be given the chance to be grandparents.
1 June 2007 at 8:39 AM
This is interesting…ninemsm conducted a survey which stated: ‘Should the Australian economy come before climate change’..the majority of the resondants said ‘NO’. I would guess that’s the same in the US and europe. Good sign!! Shows people’s concern is growing.
1 June 2007 at 8:56 AM
Re 121, see the Two Degrees chapter of Mark Lynas’ 2007 book, SIX DEGREES.
1 June 2007 at 9:12 AM
catman (306), what is perfectly obvious to some just might not be so to others. This might or might not make us sceptics (…but still looking) stupid. And don’t use the old argument that ‘we took a vote and AGW won by a large majority — so that settles the science’.
1 June 2007 at 9:39 AM
Re William Calvin (#123)
Good book? Does he seem credible and do his claims seem to be backed up by the science?
I was a little worried about that. Real Climate seems right on target and has the expertise up the yin-yang, but some articles by others are legitimately regarded as alarmist or at least uninformed.
I guess I should just check it out and put the preconceptions in the circular file…
1 June 2007 at 9:40 AM
With the exception of the black curve (Instrumental, HADCRUT2v), the shape of the family of curves in Fig. 1 seems to match Beck’s curve (Fig. 2) quite well (ignoring scale). I’m not familiar with the derivation of each of the other curves in Fig. 1, but is it possible that low temporal resolution of these other estimates could be masking significant spikes in the past that we are only now able to resolve by better instruments and records? In other words that the current hockey stick is an artifact of improved temporal resolution in the recent past compared to the poor resolution of the distant past climate? I’m not an AGW denier and not trying to make bold claims, I’m just trying to understand the significance of the data in this chart.
[Response: Most of the records shown in the IPCC graph (Fig. 1) have annual resolution (as you can obtain e.g. from tree ring data). The curves shown are of course smoothed versions; that applies both to the instrumental record (black curve) and the reconstructions. -stefan]
1 June 2007 at 9:44 AM
PS
My post above…
I meant to respond to William Calvin (#125) regarding Six Degrees.
My apologies to both William Calvin and Lawrence Coleman.
1 June 2007 at 9:55 AM
re: 126
maybe we should put it this way then: “we looked at the opinion of the climate scientists , and AGW won by an overwhelming majority… so that settles the science”
1 June 2007 at 9:58 AM
Re #123, Politicians that rely on lobbying (the USA) and other countries relying heavily on fossil fuels (ie Australis, China and India to name a few) have a vested interest in maintaining the status quo. Painful decisions need to be made regarding energy efficiency and alternative technologies but the coal and Oil industries have a large grip on political thinking in many countries and the economy could suffer under these new initiatives.
AGW is an inconvenience for them and they really cannot see how to reduce their CO2 footprints by 60 to 80 percent in order to limit AGW to one or two degrees. Moving away from Oil and coal to renewables and sustainables is a new world to them, one in which they might not be able to control it all.
As Gavin Schmidt and James Hansen have stated recently we could first deal with aerosol and soot emissions first and then CO2 next, stop cutting down rain forests and use land differently in order to give ourselves a chance or then reigning in CO2 emissions but there was no evidence of any of that is Bush’s speech, just rhetoric really and stalling tactics.
1 June 2007 at 9:59 AM
Re #120 The climate is a complex system, but that does mean that it is wrong to look for the cause of each maxixmun and minimum. What is wrong, is to look for one cause that explains all maximums and minimums, or even just all minimums.
The Little Ice Age (LIA) began in the 14th Century, long before the Maunder Minimum. It seems to have started because of the drawdown in CO2 as a result of the increase in fallow land after the depopulation caused by the Black Death. A couple of hundred years later, in the middle of the LIA, the Dutch had their hottest temperatures ever recorded before 1998. Then the solar cycle brought the the Maunder Minimum and the Dutch spent their winters skating on the canals, and Londoners were building bonfires on the frozen Thames.
The most likely cause of the Mediaeval Warm Period (MWP) was the spread of the Anglo Saxons who cleared the forests in order to farm it with their iron ploughs. Their descendants in the USA and Australia had the same effect in early 20th Century, culminating with the Dust Bowl.
It is not a matter of arrogance to claim that Man has changed the climate in the past. It is arrogance to think that we have learnt from our past mistakes and that any changes we may make in the future will be for the good of mankind
1 June 2007 at 10:20 AM
Rod B (#126) wrote:
In all honesty, I don’t think that the contrarians look stupid at all - well, perhaps some, but not any that come here - at least that I have noticed. Moreover, I most certainly don’t believe that contrarians have “evil intentions.” Well, perhaps a few, but not here.
However, personally, there is something which I entertain as a hypothesis of sorts - namely, that many people in different areas of their lives and to different degrees tend not to recognize a fairly fundamental principle: identification precedes evaluation. This is the principle underlying the fact that ad hominem attacks and appeal to emotion are fallacious forms of reasoning.
It is something which one violates when one refuses to accept the evidence and where it leads because it would call into question what one believes even with regard to oneself - and one recoils from the consequent anxiety. It is something which one violates when one places loyalty to a group above one’s perception of the truth with regard to any subject. And it is something which one violates when one endorses the view that there are different logics for different people - dependent upon their race, religion or economic class.
Now in my view, some contrarians are simply uninformed. Others in one way or another to one degree or another violate the principle that identification precedes evaluation - given the weight of the scientific evidence. Moreover, I believe that the group which is simply uninformed is rapidly shrinking.
Where I would place particular individuals is another matter - and ultimately it would be up to each individual to make this judgment for themselves.
1 June 2007 at 10:58 AM
Sorry about my tone, Rod B. I had just heard the head of NASA’s interview on NPR and was livid. Since I knew more knowledgeable people would be responding to him (and are they!), there was more emotion in my response than was warranted.
Climate change shows itself as extreme weather events because climate is average weather and any average is changed either by many small changes or fewer large ones. So if you watch the kind, number, and intensity of extreme weather events you may loose some of your skepticism.
1 June 2007 at 1:00 PM
Re: #73,#93 (me); #101 (Ferdinand Englebeen); #114 (Timothy Chase)
“In an effort to downplay the seriousness of today’s climate change, contrarians will argue that some glaciers were smaller a thousand years ago, but given the way things are looking, our surpassing this is a foregone conclusion.”
I’d assumed #101 was of that sort, or at least I’ve gotten similar arguments elsewhere. [Ferdinand: have you had a chance to study the Holzhauer paper, and did these arguments make sense, or not?]
This does remind me of the value of complementary orthogonal approaches:
1) “Horizontal”, like http://nsidc.org/sotc/glacier_balance.html, which
gives a broad global view with clear current results, needed to see the current big picture and avoid problems with the randmoness of individual glacier configurations and local differences. Unfortunately accurate broad records (especially for mass balance) just don’t go back very many decades.
2) “Vertical”, like the various glacier-length studies of Aletsch, focus on a single example for which there is:
a) Excellent data over last 100 years.
b) Pretty good data over last 1000-2000 years.
c) Some data over thousands of years before that.
and whose behavior seems reasonably representative; I especially like the longer glaciers’ effect of doing their own curve-smoothing, so one need not argue about that.
For some people, I think the “concreteness” of a single example is useful, simply because they can *see* the difference in the photographs. While there may be some uncertainty in parts of reconstructions , there’s no room for argument about how mass-balance measures are done, how accurate they really are across numerous glaciers, etc, etc, because one is dealing with the visible effects of one glacier.
Of course, a) and b) are consistent with the view that unusual warming is happening:
the glaciers are
1) melting as fast or faster than they have for thousands of years, and at least from eyeballing the global mass-balance charts, and a sampling of the Swiss glaciers, many retreats have been accelerating … and given the response time lag, the longer ones haven’t even noticed the last 10 years’ heat.
2) have already retreated to levels not seen for thousands of years, equivalent to times whose typical insolation should have been higher.
-
1 June 2007 at 1:45 PM
The timescales for delivery of effective action may be much less than 10 years (circa 4000 days).
The following is an extract from the summary of the report â??High Stakes. Designing emissions pathways to reduce the risk of dangerous climate changeâ?? by Paul Baer and Michael Mastrandrea. (All temperatures below are in Celcius.)
â??The research concludes, based on a reasonable set of assumptions, that to have a â??very low to low riskâ?? (calculated as a nine to 32 per cent chance) of exceeding the 2°C threshold, global emissions of carbon dioxide (CO2) would need to peak between 2010 and 2013, achieve a maximum annual rate of decline of four to five per cent by 2015-2020, and fall to about 70 to 80 per cent below 1990 levels by the middle of the century. This would need to be matched by similarly stringent reductions in the other greenhouse gases. These calculations are based on scenarios in which atmospheric concentrations of CO2, which stand at 380 parts per million (ppm) today, peak at between 410-421ppm mid century, before falling to between 355-366ppm by 2100. This in turn is based on the understanding that CO2 concentrations can be reduced by lowering annual emissions below the level of CO2 which is absorbed by global carbon sinks, which currently take up approximately half of the CO2 emitted annually by human activity.â??
The report can be accessed at the following link
http://www.ippr.org.uk/publicationsandreports/publication.asp?id=501
This type of report is very useful because it provides a time framework on which mitigation efforts should/could be implemented. Other studies indicate similar results.
Specifically (but roughly speaking), one can take this type of emissions pathway assessment for a given target temperature and define what emissions reduction needs to be delivered.
One degree
If people target for a 1 degree warming, then (roughly speaking) emissions should peak within the next 1000 days, and be reduced from then; one degree may, however, already be an option which we have thrown away.
Two degrees
If people target for a 2 degree warming, then emissions should peak within about 1000 to 2000 days (i.e. between 2010 and 2013, as quoted above), and be reduced from then at rates described in the report.
Three degrees plus
If people target for a higher than 2 degree warming then â?¦
So how does one work out what level of warming one should target for or what one thinks others should share?
For this, a useful document is the book â??Six degreesâ?? by Mark Lynas. Information about the book can be seen on Markâ??s website http://www.marklynas.org/ The IPCC report is another useful source.
The book is an interesting compendium of degree-by-degree analysis as one goes from one degree, to two degrees, to three degrees, etc. Mark gives some summaries of what to expect at each degree on his website.
If one goes through each degree one can ask: â??what sort of an economy might operate at that degree?â?? or â??what sort of life might people have in a world at that degree?â??. This is the sort of analysis that business and industry should be doing. Corporate executives would do well to read each â??degree chapterâ?? (the book is highly readable) and ask themselves: â??can my business and industry operate at that degree and is my board prepared to disclose to the world, including to investors, shareholders, customers and the media, what degree the business / industry is targetting?â??.
Specifically every business and industry should be going through their own systems and supply chains in detail, including plant-by-plant analyses and building a realistic assessment of the situation that has been created or that might occur at each degree. It is through this sort of detailed analysis that a more realistic risk landscape can be established, let alone navigated.
So where are we. In very simple terms, we may be at a point where we can choose which degree we wish to have. However, if we wish to choose one degree then we have about 1000 days to have got our combined act togther and have peaked the emissions or we may already have missed it. If we wish to choose two degrees then â?¦ (see above).
So what about BAU? The climate systems that people are attempting to model are hugely complex and it is not surprising that climate modelling endeavours remain an ongoing developmental effort. However, people do develop an intuition about the systems they focus so much of their life studying and when an expert, such as Hansen, steps forward and says above the â??reticentâ?? crowd, that even though he doesn’t have fully-developed ice sheet disintegration models to back him up, that the BAU scenario may give rise to a 5 metre sea level rise by 2100 ( http://pubs.giss.nasa.gov/abstracts/inpress/Hansen.html ) then from the point of view of business and industrial risk assessment, which is but one point of view, there are important considerations in terms of emission pathways that are now being chosen.
Also, given that climate scientists were taken aback by the disintegration of the Larsen B ice shelf, it might be reasonable to expect that other disintegrations may occur which come as a surprise, even to climate experts. Hansenâ??s scenario is therefore instructive to work through and back from in substantive detail because it provides a quasi â??boundary conditionâ??, if one does accept that it may be a worst case scenario, for connecting through comparative scenario sets and metricating risk typologies, accumulations and flows over the coming business cycles. If one takes the 5 metre SLR rise as an estimate, and if one then analyses representative individual supply systems across the global economy including coastal plant-by-plant bases and hazard-by-hazard bases and builds up risk profiles through multi-sector mappings and connectivities, it soon becomes clear that structural instabilities, including system-wide shocks, resonances and autocatalytic formations, are the norm as various event horizons in relevant scenario sequences gain sharper focus. Business and industrial risk managers should take note.
Risk managers should be developing highly detailed models around specific plants and supply networks out into the future because the risks (and liabilities) associated with BAU are both enormous and material. In analysing and modelling the response of business and industrial systems to varying degrees of climate change, abrupt changes to global supply systems, industrial processes and plant operations are endemic. In other words, structural instabilities, shocks and risk cascades are the BAU norm. We see that quite explicitly in analyses and nonlinear dynamical simulations of projected economic, industrial and business processes and market formations.
We are at a point of structural instability right now and the timescale to choose which branch which we wish to move along is very short. Right now, that is over the next 1000 to 2000 days, we will either have moved industrial and economic systems onto the safest trajectory that we can, given the situation we have created, or the world system will have taken the branch to higher temperatures. Whichever branch is taken the message is absolutely clear: present systems, in the way they are built, configured and operated, cannot be a part of a sustainable future.
Business and industrial leaders should be prepared to state what degree they are targeting.
1 June 2007 at 3:10 PM
It’s going to be interesting to see how this shakes out… Jim Hansen is as appalled at Griffin’s ignorance as many of us have been… livid. (This is a guy who’s going to administer an effort to send people to live on the moon???)
NASA Scientist Critiques Bush’s Strategy
http://www.npr.org/templates/story/story.php?storyId=10577221
(excerpt)
Hansen also takes issue with NASA administrator Michael Griffin’s views on global warming during an interview with Madeleine Brand. Griffin told NPR’s Morning Edition that he isn’t sure global warming is a problem we must tackle, a view Hansen says is “remarkably uninformed.”
1 June 2007 at 3:24 PM
Re John Mashey (#135) on glaciers
Seems like an accurate assessment, and try as I might, there isn’t really much that I can add to it as I believe you more knowledgeable than I am.
Concrete examples obviously help, likewise charts which show the problem as it exists at a much broader level help, and ideally one should have both. If limited to text and hyperlinks, I would include a very brief description regarding a few points on the chart - to illustrate the trend - as there will be people who will at least act as if they don’t know what you are talking about and didn’t even seem to realize that the link was there. However, if the description is too long, the point is likely to be lost in the text for some more careless readers.
One other point: a great many people might not understand the practical importance of glaciers.
Glaciers permit precipitation to be preserved rather than lost to the soil. Their yearly, dependable melt provides much of the world’s population with fresh water throughout much of the year. Without glaciers there will be severe water shortages - so there is a genuine urgency to this issue. A catastrophic melt may mean that a great many people will drown in a flood within a given year or another, but the possibility of extreme and enduring water shortages over vast regions and the consequent reductions in agricultural output are far greater concerns.
I don’t mean to reduce this to body counts, but I suspect that ultimately this is in large part what it comes down to.
1 June 2007 at 4:11 PM
PS - to my post above
When projections of the number of people affected by one disaster or another are made, I think it may be easy to lose sight of the fact that such people are individuals.
Having been in the Navy, I may be a little more sensitive to this in some ways. I briefly knew a girl in Madagascar living in little more than a shack. She was taking calculus. She and her friends offered to let me join them for dinner. Their island was hit by several hurricanes last year. The Atlantic was quiet, but the Pacific had a record year. I knew a guy who everyone called “chief” even though he was only a first class pettiofficer. But he was a chief - in Samoa. His island had essentially been in the stone ages at the beginning of the twentieth century, but on board ship he was an electronics technician - and just about the sweetest guy you ever met. And there were many others.
Even at my current job I have the chance to meet and work with people from many parts of the world. A number of them are from China and Taiwan. Others are from India. I know a former mathematics professor who grew up in Tibet. These people might not be directly affected, but people that they care about probably will be.
1 June 2007 at 4:36 PM
Realclimate.org, All of what you say seems so logical and clear but similar projections in the past where so far off and it it seems so very complicated that I cannot support acting on the current knowledge.
1 June 2007 at 5:40 PM
Actually, the last 20 years have been predicted fairly accurately, given what we knew just in the ten years previous to that.
1 June 2007 at 6:11 PM
I am a skeptic. Not being sufficiently educated to understand the science, I must form an opinion from the conclusions of others. And present company excepted, there are lots of skeptics.
However, it seems that within a decade the temperature record will confirm or confound the AGW hypothesis.
If confirmed, there will be a capitulation of opinion, and the leaders of the world will take action in several ways. First by accelerating the development of nuclear power generation, High taxes on fossil fuels, and if the situation is severe enough, the Russians’ diabolical plan of a million tons of aerosols into the atmosphere.
If temperatures don’t confirm and cause some real pain,-well then good luck convincing the world that something serious needs to be done.
Solar, wind, & conservation is just a sideshow that we ought to be doing anyway just out of common sense.
1 June 2007 at 6:47 PM
What parts?
Which projections?
How long ago?
What were computers like then?
How much peer-reviewed scientific literature backed those projections?
How much support was there in the science community?
How much evidence did they have at the time?
How much time have you spent attempting to understand the issues?
… and out of curiousity, where are you posting from?
Come to think of it, I most certainly would not ask you to act on the current state of your knowledge. In fact, I would rather you didn’t. I would only ask that you don’t get in the way of those who are clearly far more knowledgeable and informed than yourself.
1 June 2007 at 8:33 PM
I am a skeptic. Not being sufficiently educated to understand the science, I must form an opinion from the conclusions of others.
That makes you a denier. A skeptic must present evidence to back up their claim of skepticism.
1 June 2007 at 9:08 PM
No. I am not a denier. I just don’t think that the evidence is conclusive, at least not to a layman.
1 June 2007 at 9:32 PM
My 2 cents on the whole flap with Mike Griffin. I’m somewhat limited in what I can say for various reasons. However, I can attest that the man is not an idiot. He may be somewhat narrowly focused, and I am pretty sure he has not thought through the consequences of climate change in much detail. He is totally focussed on his mission of getting astronauts back to the moon–and he really doesn’t want to think about much else. He is convinced that that is the only way NASA will survive–that otherwise it will die the death of 1000 budget cuts. In my opinion, it was probably inappropriate for him to answer the question the way he did, but let’s face it, his opinion is representative of that of many engineers–who also haven’t thought the problem through, but still feel they SHOULD have an opinion on the matter. The quickest way for a scientist to look like an idiot is to venture opinions outside his realm of expertise. Unfortunately, when scientists (or engineers) become public figures they are often asked to do this and few are wise enough to resist the temptation.
1 June 2007 at 11:46 PM
“The weirdest millienium?” Weirdest one out of how many? Two? Where’s James Annan on probability theory when you need him? Has this proposition passed peer-review?
1 June 2007 at 11:47 PM
Hi all,
i’ve got a copy of the Mark Lynas book, and i have to say that i think it is pretty convincing, with one or two minor reservations.
Unfortunately the book is not out in the US til January 2008(!), so i guess i will have to wait a while to see Realclimate’s reaction, which is a pity. If any of the US based moderators would like my copy, i would be more than happy to send it to them, free of charge.
I believe his previous book, High Tide, was well recieved, and i think that ’six degrees’ answers some of the questions most of us are currently asking ourselves. Of course Mark Lynas is a journalist, but his attempt to review the published evidence seems thorough, referenced, and reasonably measured.
Lynas’s website says that National Geographic have bought the tv rights to ’six degrees’, which reinforces my feeling that he has produced a timely and interesting book. Also, the recently published IPCC WG3 SPM (which we know to be a conservative analysis), included a table(p23) very similar to the one in Lynas’s book.
Perhaps the most striking parts of the book, are those suggesting that 2deg of warming (which seems to be the limit of our ambitions, currently) will be enough to start the feedbacks that will lead to 3,4 and 5 deg.
I feel that it is important to point out that i am only a very interested (and reasonably well read) laymen, but i am alarmed by the speed with which events seem to be overtaking us.
2 June 2007 at 1:58 AM
Re 144: I think you may have that the wrong way round. A sceptic is unconvinced, a denier is determined in his views. The way you treat the two should be different: for a sceptic you need to politely present adequate, well argued and unabusive evidence supporting the case you are trying to make. For a denier you need to point out the errors in the evidence that he is using to form his wrong opinion. Incidentally, I see no reason for either word to be pejorative, they are simply descriptive of an attitude to a proposition. It’s a shame that people try to use them as terms of abuse.
You will notice, of course, that this argument goes both ways and would, in an ideal world, lead to a polite discussion between both factions (the alarmists and the denialists) while the sceptics look on waiting to choose who wins.
To see what I mean, read the discussions involving JD (is that Jim Dubhia?)and Judith Curry at The Other Place. They are models of politeness, even when abused. Politeness will win over converts, bullying and hectoring will not.
I came into this affair convinced that we were facing a major crisis. Now I’m sure that global warming is happening, that it’s anthropogenic (but not so sure that other explanations might not change my mind) and that we should think about solutions. However, I see enough problems with the science — some of the science is truly terrible — that I’d be very very slow to expend billions, let alone trillions, on ameliorating one contributory factor. That’s scepticism.
If I had my hands on the budget then I’d spend billions on data collection and publication. The fact that this is not being done makes me wonder about motives and whether a push for the security of low oil consunption is not a driver of government priorities — the public will take nuclear power if it’s frightened of global warming and not otherwise.
Open source data will end up convincing me. It will have to be good stuff, transparent in collection and dissemination, not hoarded by gurus who hand down their conclusions from on high, expecting me to take it or leave it.
My journey to knowledge continues. Does anyone know of a good source for isotopic changes during historical periods up to today? I’m looking for a graph where I can see the trends and so on — one picture is worth a thousand words — with more complicated details of annual and geographical variation*. For some reason the name ‘Eric’ springs to mind!
JF
*I would expect a difference in isotopic response to volcanic eruptions higher or lower in zinc and chromium leachate.
2 June 2007 at 2:45 AM
re: #142 & #144
We continue to have problems with definitions, and we should be gentler. I follow Stephen Schneider’s kind lead here, who had no problem with me being somewhat skeptical years ago, given that I was clearly willing to listen and study a wide range of sources.
We have the following problem:
a) A few people are paidup members of the denialist industry, and some of them know enough about the science to be able to generate masses of plausible-sounding controversy, using well-honed PR and lobbyist tactics … at least somewhat successfully, just as the tobacco companies still do OK, 40+ years after “The Surgeon General has determined…” These are clearly “denialists” or “”deniers”, not skeptics.
b) Some people happen to encounter enough of this early, and get anchored on these beliefs, and it does take serious effort to wade though it, and watch these sources long enough to understand how the end result never changes. This often happened when somebody got turned off by some of the early extreme alarmist doom-saying & press pieces [I certainly got turned off once or twice that way], or gets irked at movies like “The Day After Tomorrow”, or thinks that Crichton is credible on this.
People are often susceptible to this for economic, political, philosophical, or ideological reasons. Oddly, people who are quite rational skeptics on many topics are also susceptible, because many such topics have one group with strong beliefs supported by pseudoscience, opposed by skeptics using science. But this one has two groups with strong beliefs, plus a third group using science. People turned off by one extreme can rebound over into the other, thinking they are being normally skeptical, whereas they are now adopting a 100% certainty in the other direction. Confusion is always easier to create than clarity.
b1) Some seem to make a career of digging up every contrarian cherry-pick, repeating every old argument, post such everywhere, etc, and I think “denier” fits them also.
b2) But some admit to not knowing or understanding much about it, and it is not completely irrational to think that human modification of climate seems an “Extraordinary claim that requires extraordinary proof”.
Of course, the proof by now is very solid, but I don’t think that’s instantly obvious to the casual observer, and the real deniers are good at stirring up confusion, and tarring lots of people as alarmists., and playing to non-science motivations.
Anyway, I’d suggest being gentler with somebody in b2) than in b1) or a), because b2) might be willing to learn if they don’t get turned off. I don’t know of an accepted term for b2), and it is sometimes hard to distinguish b1) from b2) at first. I think “Start Here” is a good resource, but I’m not yet sure there is a solid educational strategy for people who are willing to learn, but with different levels of background and misinformation.
2 June 2007 at 5:10 AM
Here’s a bit more data concerning the Southern Hemisphere. It doesn’t bode well for Beck as it seems to show that the medieval warming period wasn’t so warm there and the little ice age wasn’t so cool.
Here’s the abstract:
Pacific archaeologists, geographers, and other social scientists have long used a model of Late Holocene climate change based largely on other regions of the world. In high-latitude regions, two major climate periods have been recognized: the Medieval Warm Period, dated to ca. AD 9001200, and the Little Ice Age, dated to ca. AD 15501900. However, new evidence from long-lived Pacific corals, along with more general climate modelling, suggests that while the rest of the world was experiencing the Medieval Warm Period, conditions in the tropical Pacific were cool and possibly dry. Similarly, during the Little Ice Age the central Pacific was comparatively warm and wet and stormy conditions more common. A significant body of new evidence points to substantial climate variability in the central Pacific over the past millennium. Changing background climate, El NiñoSouthern Oscillation variability, and the potential for regional variation are here considered with an eye to understanding the potential influence of climate on prehistoric human populations in the central Pacific region.
Here’s the link:
http://www.journals.uchicago.edu/cgi-bin/resolve?id=doi:10.1086/504168&erFrom=-2591966302784330799Guest
I thought you all might find it of interest.
2 June 2007 at 8:31 AM
No. I am not a denier. I just don’t think that the evidence is conclusive, at least not to a layman.
And until you tell us why you think the evidence is inconclusive, by providing your own evidence which justifies its inconclusiveness, then you are firmly in the denier camp. Those are the facts, you just can’t say you are skeptical without providing evidence, and maintain your credibility at the same time. Skepticism without evidence, and credibility, are mutually exclusive, get it?
2 June 2007 at 9:20 AM
“That makes you a denier. A skeptic must present evidence to back up their claim of skepticism.”
That’s just bass ackwards. A skeptic is one who sees the arguments but still has valid questions about its veracity. He may have the capability to question the science but not have contrary scientific evidence. Or he can have reasonable doubts with the process, which logically taints the process’ conclusion. [99% of financial analysts say the market will go up — usually is a sure sign it’s going down.] It’s the denier that ought to have some evidence of refutation.
2 June 2007 at 9:29 AM
I think that’s not helpful, Mr. Elifritz. Kroganchor has asked some good questions; we can’t guess his age or education or background from them but so far they’ve been quite basic ones (like why is the ocean so cold since the core of the planet is hot and so is the air —- a question that takes a bit of physics to decide or believe). The Contributors here are good at figuring out where to start, with someone, after a while, and set a good example for visistors like you and me who. Take some time to try to get to know people when they arrive declaring themselves, see who’s willing to learn how to learn. Curiousity furthers.
2 June 2007 at 9:54 AM
Kroganchor (#145) wrote:
Well, I could outline the basics within a single post.
We know that given the distance of the earth from the sun, if it weren’t for the greenhouse effect, the earth would be below freezing - approximately 0 F. However, the atmosphere is able to diminish the rate at which the earth would radiate heat back into space. The process works in the following manner.
1. For the earth to be in thermal equilibrium, with its temperature neither increasing nor decreasing, the amount of thermal energy entering the system has to be equal to the amount of thermal energy leaving the system, where the system consists of the ocean, the atmosphere and the ground. We know this because energy must be conserved.
2. Humans have been putting more carbon dioxide into the atmosphere than can be absorbed by various natural processes. (We know that it is our carbon dioxide which has been entering the atmosphere because of isotopic analysis - the carbon we put into the atmosphere has an extra neutron - making it heavier. This is one of the “smoking guns.”
3. Now sunlight enters the system, some of it striking either the ocean or the land. At this point we should note that the amount of sunlight entering the system is roughly constant.
4. When it strikes either ocean or land, some of the energy is absorbed, causing them to heat up.
5. When objects heat up they emit thermal radiation.
6. Some of this thermal radiation is absorbed by the atmosphere, causing it to heat up, then re-emitted.
7. We know the reason why it is absorbed by the atmosphere. Various gasses are opaque to thermal radiation at various wavelengths. Moreover we are able to study this in the lab.
8. When such thermal radiation is re-emitted by the atmosphere some of it is absorbed by either the ground and water, and some of it leaks to space. The amount of each is roughly half because either it goes up to space or back down.
9. As it is absorbed by the ground or water this causes the ground or water to heat up more, rising in temperature, emitting more thermal radiation, which is then either absorbed by the the atmosphere or leaks into space.
10. As the water heats up, some evaporation takes place, adding to the amount of water vapor in the atmosphere, and water vapor will also absorb thermal radiation at specific wavelengths, causing the atmosphere to heat up further and emit more thermal radiation. As such, this is a positive feedback. Moreover, water vapor is a much more effective greenhouse gas.
12. However, unlike carbon dioxide, water vapor tends to remain in the atmosphere for a much shorter period of time because it will tend to condense into clouds, falling as precipitation either in the form of rain or snow.
13. Since carbon dioxide tends to remain in the atmosphere for a much longer period of time, the amount of carbon dioxide which is in the atmosphere will regulate the amount of water vapor is in the atmosphere.
14. Given the greenhouse gasses which are in the atmosphere, the temperature of the system will ultimately rise to the point at which the thermal radiation leaving the system is equal to the amount of thermal energy leaving the system.
However, there are various feedbacks involved.
A few are:
1. Convection. Where hot air rises, shortening the distance that thermal radiation has to travel in order to leak into space. When this happens there will be less re-emission and absorbtion occuring between the atmosphere and itself. As such, this will increase the rate at which thermal radiation leaves the system. As the temperature rises, more convection takes place, therefore this is a negative feedback.
2. The albedo effect. When thermal energy is absorbed by ice or snow, some of it will melt, reflecting less light back into space and permitting more thermal radiation to enter the system when light is absorbed by either the dark ground or dark ocean, but as the system warms, resulting in positive feedback.
3. The reduction in the capacity for the ocean to hold carbon dioxide. As the the ocean heats up, it is less able hold either carbon dioxide or oxygen, and therefore the amount of carbon dioxide which remains in the atmosphere will increase. Currently the ocean is still absorbing most of the carbon dioxide which we emit, acting as a sink, but it absorbs less and less each year. At some point it will have warmed enough that it will start releasing the carbon dioxide which it already has, becoming an emitter.
4. The melting of the permafrost. When permafrost melts, the organic material which was frozen will decay, releasing methane and carbon dioxide into the atmosphere. Since both methane and carbon dioxide are greenhouse gases, this is a form of positive feedback.
5. Heat stress in plants. The more the temperature rises, the less effective they will be at absorbing carbon dioxide.
6. Stress on plants due to drought. The more the temperature rises, the more quickly water will evaporate, reducing the amount of water which will be available to plants and thereby reducing their capacity for absorbing carbon dioxide.
Currently the net effect of the feedbacks is positive as the earth has moved away from the equilibrium which it was in and has to find a new equilibrium. Moreover, as we put more carbon dioxide into the atmosphere, the net effect is to push us further from equilibrium, increasing the temperature which the earth has to reach before it is able to radiate enough thermal energy to balance the thermal energy which is entering the system. As positive feedbacks, the more carbon dioxide which enters the system, the worse they will get.
At each step, we are able to quantify what is going on, and there have been a great many empirical studies. Enough to convince the vast majority of scientists, and every major science organization which has seen fit to take a position on this. What few reasonable alternative explanations may have existed at one time for the increasing temperature of the earth have been eliminated, i.e. they are no longer reasonable and are kept alive only by special economic or ideological interests which are playing people for fools. However, this does not change what is happening to the earth, or the extent of the threat which faces humanity as it continues to emit more carbon dioxide each year.
2 June 2007 at 9:57 AM
Re 142 Krogancho: “I am a skeptic. Not being sufficiently educated to understand the science, I must form an opinion from the conclusions of others.”
Then perhaps you might want to educate yourself about the science more so that you can understand it better. And in the mean time, I suggest that you choose your ‘others’ very carefully. Make sure that they actually have at least as good an understanding of the science as do the scientists whose research is presented here and through the IPCC. Most important, be equally skeptical about their arguments, and make sure that their ‘evidence’ is not easily debunked by the facts and data and by well understood scientific principles.
2 June 2007 at 10:18 AM
James Hansen must be particularly annoyed with Mr.Griffin’s backstabbing when on May 29th this was published:
NASA: Danger Point Closer Than Thought From Warming
http://abcnews.go.com/Technology/story?id=3223473&page=1
‘Disastrous Effects’ of Global Warming Tipping Points Near, According to New Study
By BILL BLAKEMORE
May 29, 2007 �
Even “moderate additional” greenhouse emissions are likely to push Earth past “critical tipping points” with “dangerous consequences for the planet,” according to research conducted by NASA and the Columbia University Earth Institute.
With just 10 more years of “business as usual” emissions from the burning of coal, oil and gas, says the NASA/Columbia paper, “it becomes impractical” to avoid “disastrous effects.”
The study appears in the journal Atmospheric Chemistry and Physics. Its lead author is James Hansen, director of NASA’s Goddard Institute for Space Studies in New York.
The forecast effects include “increasingly rapid sea-level rise, increased frequency of droughts and floods, and increased stress on wildlife and plants due to rapidly shifting climate zones,” according to the NASA announcement.
Recent Climate Reports Underestimated How Soon
By heralding the new research paper, NASA is endorsing science that places considerably more urgency on the need to reduce emissions to avoid “disastrous effects” of global warming than was evident in the recent reports from the world’s scientists coordinated by the Intergovernmental Panel on Climate Change.
The new NASA release emphasizes the danger of “strong amplifying feedbacks” pushing Earth past “dangerous tipping points.”
Scientists have been warning for several years that such tipping points are the greatest threat from manmade global warming and what makes it potentially catastrophic for civilization.
‘Potentially Uncontrollable’ Feedback Loops
As the tipping points pass, “there is an acceleration, potentially uncontrollable, of emissions of vast natural stores of greenhouse gas,” according to Hansen, who reviewed the study for ABC News today.
Hansen explains that dangerous feedback loops are being tracked in various regions of the planet.
Many studies have reported feedback loops already observed in thawing tundra, seabeds and drying forests.
Hansen also points out that dark and therefore heat-absorbing forests are now expanding toward the Arctic, replacing lighter-colored areas such as tundra and snow cover.
The NASA research also reasserts the importance of the disappearing Arctic sea ice and snow, whose reflectivity has helped cool the planet by bouncing warm sunlight straight back into space.
The disappearance of that bright sea ice and snow is uncovering more and more dark water and bare ground creating another dangerous feedback loop.
These feedbacks all produce more heat, thus all reinforcing each other, leading to evermore thawing and thus releases of natural greenhouse gases (including CO2 and methane) in a viciously accelerating circle.
450 Parts Per Million
The recent IPCC summaries entertained “scenarios” of CO2 concentrations in the atmosphere ranging from 450 parts per million (ppm) up through 550 ppm and 650 ppm.
This new research says “C02 exceeding 450 ppm is almost surely dangerous.”
Hansen told ABC News today he believes the upper limit for avoiding dangerous climate change “could well be much lower” than 450 ppm.
In the NASA announcement, Hansen said, “‘business as usual’ emissions would be a guarantee of global and regional disaster.”
Earth’s CO2 concentration is currently 383 ppm, up from 280 ppm at the start of the industrial age.
Studies released earlier this month report human-made emissions now spiraling upward at an accelerating rate much faster than scientists expected only a few years ago.
The NASA release points out that a 1992 treaty was “signed (and ratified) & by the United States and almost all nations of the world,” which “has the goal to stabilize atmospheric greenhouse gases ‘at a level that prevents dangerous human-made interference with the climate system.’ ”
NASA says this new study thus helps “define practical implications” of that 1992 treaty the United Nations Framework Convention on Climate Change.
The study says that “only moderate additional climate forcing (which would mean only moderate additional warming from such emissions) is likely to set in motion the disintegration of the West Antarctic ice sheet” dubbed WAIS by polar scientists.
Many scientists say a disintegration of WAIS would mean catastrophically rapid sea-level rise.
The NASA/Columbia study is co-written by 48 scientists in the United States and France.
end quote
2 June 2007 at 10:34 AM
Boy, you can’t make this stuff up. Well, they can. Amazing what some will do, but they make nice archetypes for antagonists.
2 June 2007 at 10:51 AM
Re 150: For the most part I agree with John Mashey’s comments about different motivations and degrees of skepticism and denial, and that they need to be addressed differently.
In my experience when discussing climate change on general public message boards there are outright deniers who have already decided what their position is and who will seize on any and all arguments that seem to support their position or undermine its opposite, no matter how ludicrous the idea or how poorly they understand what their ‘evidence’ means or does not mean. It doesn’t really matter if they are from John’s type a group and bent on actively and deliberately sowing doubt and confusion, or from the type b1 group and simply repeating the type a arguments through ignorance or ideological loyalty. It is simply a waste of time responding to this sort of denier directly, beyond posting a brief message demonstrating how their particular assertion is simply wrong, with a link to evidence if possible, and even then mainly for the benefit of others reading or participating in the thread.
However, I have found that it is possible to carry on a civil and intelligent conversation with honest skeptics who fall into John’s type b2 group. Indeed, it is even possible to convince some of them one step at a time using the arguments and information posted here at RealClimate and other science sites. In the process you also better educate others reading or participating in the thread. Frankly I’m often as appalled by the lack of knowledge of some of those who accept the idea of AGW as I am by that of skeptics. Simple stuff, like the fact that water vapor is a greenhouse gas, or that historically CO2 rise has followed temperature rise, or that the sun really does drive climate, even with the greenhouse effect. In fact, I’ve found that correcting these misconceptions increases your credibility with skeptics, which may in part be why they become more amenable to understanding the science better as they discuss it.
2 June 2007 at 10:52 AM
Thomas Lee Elifritz (#152) wrote:
In the case of someone who is simply uninformed (which he self-admittedly is not), there is one other possibility: that they simply do not wish to know more due to lack of interest.
They either can’t see the consequences of action or inaction, the lives which are at stake or the implications for the economy if we continue with business as usual vs the implications for the economy if we try to reduce the carbon emissions. However, if this is due to difficulty understanding the science, it can be explained at an even simpler level than I have just done, even at the level that a ten year old could grasp the principles involved. If it is due to their no being convinced by the science, they should be willing to learn more - given the stakes. If it is due to lack of interest, then there is no reason to expect them to participate in the debate.
They can propose alternative explanations - and as those alternative explanations have been dealt with, we should be able to point them to the relevant literature. They can argue that a particular mechanism does not work. We can show them otherwise. They can argue that the empirical evidence is not strong enough. We can demonstrate otherwise.
In logic the alternatives are quite limited.
2 June 2007 at 1:04 PM
#145, #152:
it’s been years since I managed cognitive psychologists, but we could probably some here, as expertise in studying learning and belief systems would be helpful in a blog whose goals include education.
Google: cognitive psychology beliefs inventory
Thomas: do you think your approach will actually convince Kroganchor?
100%-NOT (denier) and NOT-PROVEN are at least sometimes different viewpoints.
Kroganchor: you seem at least open to data (you write of next decade confirming/disconfirming AGW, whereas for a real denialist, NO data will ever confirm AGW (or more precisely, doing anything to lessen fossil fuel use). Note that AGW’s existence/non-existence should be a science question, whereas “and we should do something about it” is a policy question, i.e., not for RC.
But briefly, in the way of beliefs inventory, help us understand where you’re coming from:
a) How long have you been following AGW?
b) How much have you read/seen, and do you have a couple specific favorite sources that you find credible and understandable?
c) Where are you located? [Since it is clear there is a strong geographic component to AGW beliefs. Amongst US states, Californians and Floridians(~80%) think AGW is real, and will cause trouble, whereas people in some states are less concerned. Likewise, in Canada, I think the overall average is about the same, but Albertans are noticably less concerned. Alberta has lots of fossil energy and no coasts.] I won’t ask political affiliation, but it is notable that people’s opinions about a scientific question are somewhat correlated with their political affiliation, i.e., a higher percentage of Democrats & Independents think AGW is real than do Republicans.
d) For instructive comparison, how familiar are you with the history of the tobacco industry and its approach to science, i.e., smoking/cancer linkage? {That may seem a weird question, but it isn’t.]
2 June 2007 at 1:12 PM
A skeptic is one who sees the arguments but still has valid questions about its veracity.
Of course, but that’s a circular argument, because the question must to be based upon evidence, which implies a familiarity with the subject, and most importantly, questions must be asked. To just come into an open forum and state ‘I am a skeptic’ without any justification or inquiry, is denialism.
Evidence in science is like energy in physics. It can take many forms, it evolves, yet it is still conserved.
2 June 2007 at 2:41 PM
Thomas,
My apologies.
Looking over what I posted (#160), I noticed that we had actually said they same thing, only I had been more wordy. I am afraid that my enthusiasm sometimes gets the best of me.
2 June 2007 at 2:53 PM
RE #156
Thanks, I am too old and dumb get a degree in physics. I appreciate the other comments responsive to my post. In the last year I have gone from being AGW 20/80 to AGW 80/20% as a result of reading RC and other sites.
2 June 2007 at 4:21 PM
Perhaps being an educator myself, it bothers me when people try to pigeon hole others as “understands the science,” or “skeptic” or “denialist.” Judging people based on what category we think they belong educates no one and serves no constructive purpose. People’s ideas and perceptions evolve with how much they know and come to realize. And this goes for everyone. Even your most accomplished nuclear physicist probably has plenty to learn about physics. Any one who doesn’t appreciate that, doesn’t appreciate scientific curiosity and progress. Sorry to sound like a Greek philosopher but realizing what you don’t know is what drives scientific knowledge forward, not grouping people into categories, taking an “us vs them” attitude or trying to one-up each other with rhetoric.
2 June 2007 at 5:19 PM
Kroganchor and other skeptics, can you see why I as a physicist, confronted with a system with increasing energy, pretty much have to believe in anthropogenic causation? I mean something must be increasing the energy of the system, right? We can quickly dismiss the #1 source of energy for climate, since solar irradiance has not increased enough to come even near explaining the increase in the energy of the climate. As a physicist, my next move is to look at the nest most important energy source for the climate–the greenhouse effect. The most important greenhouse gas is H2O. Could this be the culprit? Right away, I notice problems. H2O content varies considerably both spatially and temporally, and its residence time is measured in days–not really the characteristics you’re looking at when trying to explain an effect that persists over many years. It also hasn’t increased nearly enough, since further increases, increase warming only logarithmically. The next most important greenhouse gas is CO2. Hmm. A 40% increase over the period where we have experienced the warming. And the upper troposphere and stratosphere are dry compared to the lower troposphere where the effects of water are dominant. Could CO2 be playing the role of a second blanket over the bed on a cold night? Very plausible. And notice that not once have I consulted a computer model–all I’ve done is look at the known physics. Is there any other contributor that is likely of comparable magnitude to this. Well other greenhouse gases are much less important, have much shorter dwell times in the atmosphere, and contributors other than the greenhouse effect are small. Only now do we consult computer models of the global climate to find out if the possible effect of the CO2 is big enough to explain what we are seeing, and lo and behold, it is.
Now we ask whether there might be reason to be concerned. Well, yes, anthropogenic greenhouse gas emissions increase exponentially, and they are nowhere near saturated and are expected to increase logarithmically for some time to come. Certainly, such warming will be sufficient to melt much of the polar ice, causing sea levels to rise. More than 20 years of data confirm that if anything, this trend has been underestimated! There are other reasons for concern. We are seeing strange weather patterns that persist longer than we would tradiationally expect–e.g. drought in Australia and the western US. Extinction rates among sensitive species such as amphibians are rising. None of these things by themselves would have the finger print of global climate change, but so many things happening globally while we see behavior consistent with such oddities in the climate models. And there is more. Paleoclimate records show the past 10000 years to be a time of exceptional climatic stability. It also happens to be the time when we have developed all of human civilization. There is certainly evidence that many of our crops could have trouble in a warmer drier world, while many invasives, weeds and pests would do quite well. There is certainly evidence to believe that many human activities could be harmed–perhaps greatly so.
Now I do not like the implications of this theory that humans are altering the climate. Nevertheless, as a physicist and a scientist, what choice do I have but to act in accord with the evidence available to me? I would have to throw out everything including my belief in conservation of energy to do otherwise. So do you see why the overwhelming majority of scientists familiar with climate studies are concerned?
2 June 2007 at 7:18 PM
Re Kroganchor (#164)
On a personal level…
Undoubtedly there will be a great deal I will never fully understand. Quite honestly, I think it is probably just a little larger than any one mind can handle. And I am no expert.
But I have seen the diagrams. I have seen a fair number of the scientific studies. And I know that the question isn’t whether or not anthropogenic climate change is taking place, but “How bad is it going to get?” Part of the answer to this question involves the positive feedbacks, some of which we know about others that we don’t. For example, we know that the ocean is already losing its ability to absorb much of the carbon dioxide that we put out. We know the permafrost which has been frozen for centuries is melting - and in the process beginning to release methane and carbon dioxide. And it appears that plants are already losing their capacity to absorb much of the carbon dioxide that we put out, at least during the warmer, drier years.
I have also seen plenty of photos of what is happening to the glaciers and motion images of how the arctic polar ice has been melting over the past several decades - with the way it swirls around throughout the year, it looks like it is going down the drain, and it is disappearing much more quickly than they expected. Nearly every time I see something new about climate change, it is about how scientists have been too conservative in their projections, how they have underestimated the problem we face and how rapidly the positive feedbacks would kick in so that the process will take on a life of its own. They are worried - and that worries me. Our best minds and best models are telling us that we can’t wait ten more years for more evidence - and we have already waited twenty only to see that the best model we had (scenario B - the one that Hansen argued was the most probable at the time) from back then with the computer power they had at the time - was pretty much right on target.
But the width and breadth of evidence available has grown a great deal since then, the methods have become more sophisticated, and the computers far more powerful. For just one chapter alone of the IPCC WG1 AR4 cited well over six hundred peer-reviewed studies backing up its conclusions. Just a few years ago, the NEC Earth Simulator was doing a trillion calculations a second. We could wait a little longer just to be a little more certain, that we have just a little more computer power, and have even more evidence than we do now, but to what effect? The longer we wait, the more difficult it will be to adjust course - and the more we will need to adjust course. And at this point our best minds are saying that if we don’t start adjusting our course now, that if we wait another ten years, we are going to be locked into a trajectory they would very much like to see us avoid.
Whether one is looking at this in terms of the effects upon our water supply agriculture, the disintegration of the base of the ocean ecology and its effects upon fish harvests, the larger algae blooms which are already being swept into the coast lines just as our models said they would, the dying coral reefs or the effects upon the economy in the coming decades, this is something we need to start working on now, not ten years from now. They are saying that the longer we wait, the harder it is going to be, and in my personal judgment, given what I know, I know that they are right.
Anyway, like you there are limits to what I can understand, and I also suspect that there is a great deal to this that I won’t be around to see, probably even the fair majority of this century. But I know this is going to be really tough on a lot of people. And if I can do any thing in my power to help, I am going to try to make sure that it won’t be any tougher on them than it has to be.
2 June 2007 at 7:36 PM
PS
To my recent post to Kroganchor…
In all honesty, having been opposed to doing something about climate change, although probably a great deal less than I was a while back, I think you are probably in a much better position than many to do something about it. You have some understanding of why people might be opposed to doing what must be done. I suspect you will stand a much better chance of explaining to them what they need to understand in terms that they will understand so that they can make the right choices.
Something worth thinking about, perhaps.
2 June 2007 at 8:28 PM
2 June 2007 at 9:37 PM
The politicians are dodging and weaving around climate change denialism/realism everywhere at the moment it seems.
In Australia in the build up to our federal election later this year, the head-kicking, dodging and weaving has started to get frenzied. Our economy is humming along. We’re rolling in money. And an unprecedented drought has been giving us grief for years. So climate change and the environment are front-and-center in the national debate.
The following news articles give you the low down of where we are at right now.
* Australian government finally concedes to that climate change is real and begins to makes plan to catch up with public opionion, opposition and state government policy by implementing a carbon trading scheme.
* Opposition 20 points ahead in the polls, with climate change a major driver of opinion.
* Having given up on the federal government, Australian state governments proceed with national emissions reporting by June 2008, for all companies which emit more than 25,000 tonnes of greenhouse gas emissions per year.
* Meanwhile the record breaking trends to higher temperatures and lower rainfall continue.
My conclusion: leaders can only deny the bleeding obvious for so long on climate before it begins to sully their credibility and they are forced to play catch-up.
2 June 2007 at 9:49 PM
#161: John Mashey,
I agree with you pretty much. AGW is a science question. My doubts are in the area of
1) The mechanism of CO2 re-radiation, altitude, and can the effect be lab tested?
2) Does the measured tempurature record match that calculated given the increase in atmospheric co2 ?
3) Is the 20th century measured temperature rise within “normal” fluctuations?
It seems to me that there is disagreement among real scientists on these questions.
a) How long have you been following AGW?
With serious thought, about a year.
b) How much have you read/seen, and do you have a couple specific favorite sources that you find credible and understandable? No. RC is better than most.
c) Where are you located? Washington State.
I won’t ask political affiliation, but it is notable that people’s opinions about a scientific question are somewhat correlated with their political affiliation. My beliefs are libertarian, I vote Republican.
d) For instructive comparison, how familiar are you with the history of the tobacco industry and its approach to science, i.e., smoking/cancer linkage? {That may seem a weird question, but it isn’t.]
I am not familar. I don’t doubt that the Tobacco Cos “buy” their science.
There is no doubt that a persons beliefs are influenced by perceived self interest. Isn’t this effect independent of the correctness of those beliefs?
2 June 2007 at 10:05 PM
Figen Mekik (#165) wrote:
Although it may not be that relevant to the current situation, speaking from both personal experience and perhaps more personal observation, I would say that pigeon holing others is usually less of a problem than pigeon holing oneself.
But within this context, it might also pay to remember that Exxon has just recently renewed its campaign - and while it may just be a coincidence, some of what we got yesterday sounds a bit like what was coming out of Exxon just a day or so ago, especially in the case of #140. In fact, the author seemed like some sort of absurdist, one-line, post-and-poof caricture of any position someone might even pretend to take.
The “us vs them” is a problem - particularly when it causes one to fixate on winning an argument and each and every point rather than fixing on the discovery of the truth. The latter generally implies being willing to learn from the insights of others even when one disagrees with much of what they have to say. But somehow I think that the fixation on winning irrespective of the evidence is typically more of a problem for those who are unwilling to acknowledge either anthropogenic climate change or the magnitude of what faces us.
However, I agree that to some extent the “us vs. them” is a problem for those who recognize both. Some people will wander in here at times, with far less experience in this sort of thing, possibly even sporting a nice looking bullseye on the back of their leather coat, and a few may be trigger happy enough to start something reminiscent of the OK Coral. Somewhat understandable given the circumstances, but best avoided while getting a little clearer view of what one may be shooting at. It might help to see whether someone actually wishes to engage in a discussion or simply create the appearance of a legitimate disagreement.
My apologies if my own rhetoric seems a bit over the top at times (and as a matter of fact, I know it has on at least one occasion), but I sometimes feel like we are getting to the point at which we are being asked to debate whether the earth is flat - while enjoying a panoramic view of it from geosynchonous orbit. Undoubtedly others feel the same way, although perhaps with more justification.
At the same time, I know that what is obvious to some may not be at all obvious to others. A friend of mine who had difficulty with simplifying fractions had fallen seriously behind while taking a course in calculus. No small part of the problem in lay in the fact that her professor would see step two through nine as obvious and skip from one to ten. Another part appeared to involve her use of prepositions. But she was able to pick things up if she was walked through step by step. With only a few hours of preparation, she went from failing the three previous tests to acing the next.
Here is a thought: when someone comes in and states that they don’t believe that the evidence is strong enough, or that they don’t believe that the “theory” is sound enough or what have you, but without being specific in any way whatsoever, we could respond in the following fashion.
If they appear to be unclear about what principles are involved, we could explain those principles to them, preferably in our own words, or for that matter, the evidence, the trends and the support - but more or less at a schematic level - so that they get the lay of the land. Then we could ask them what specifically doesn’t seem strong enough to support the claims which have such widespread support within the scientific community and have a great deal of evidence in their favor, then go on from there.
Alternatively, if they believe that there is some alternative explanation for climate change, it should be easy enough to respond to that. Very few alternatives have been proposed, and all have been shown to be “problematic” to say the least. It may also help if we can discover what their genuine concerns are when it isn’t something they are immediately open about, but much of the time this isn’t the sort of thing which they seem willing to share.
It is an imperfect world. But admittedly there is room for improvement, and I believe ways of making things better.
2 June 2007 at 10:37 PM
K., have you read the AIP History? It’s the top link under Science, right side of page. It’s exhaustive, maybe exhausting too; the author knows some parts are difficult and has one point where he asks you how he’s doing (you’ll find it, if you work through). No math needed, and it doesn’t go past the late 1980s or so, so you won’t be trouble too much by current events. It will answer some of your questions. Note the carbon dioxide (infrared) laser uses the same physics that describe how CO2 behaves in the atmosphere, that sort of practical application of theory may help believe the science there.
3 June 2007 at 3:07 AM
re: #171, #173: Kroganchor:
Hank’s pointer is; http://www.aip.org/history/climate/index.html
That’s a fine discussion: good theories rarely spring into existence full-blown (like Minerva from the brain of Jupiter), but are often presented that way, which eliminates the history.
Kroganchor asks:
“1) The mechanism of CO2 re-radiation, altitude, and can the effect be lab tested?
2) Does the measured temperature record match that calculated given the increase in atmospheric co2 ?
3) Is the 20th century measured temperature rise within “normal” fluctuations?
It seems to me that there is disagreement among real scientists on these questions.
For 1) and 2): http://www.aip.org/history/climate/co2.htm
1) I think the sections you want is “The Speculation Vindicated (1950-1960)”
It explains the differences between sea-level labs and high atmosphere.
2) I think the section is “Carbon Dioxide as the key to Climate Change (1960s-1980s)”, looking especially for “Vostok”, and then go into “After 1988″.
http://www.aip.org/history/climate/aerosol.htm is also worth reading, for the aerosol dimming/cooling effect .
It may also be worth looking at http://www.ipcc.ch/SPM13apr07.pdf, especially Figure SPM.2, which shows the various forcing effects, including (very important) error bars and level of scientific understanding. That is a great chart, especially since it gives numbers and bounds, and immediately makes clear factors like current jiggles in solar irradiance, contrails, etc.
3) This has been discussed plenty, and others may summarize it differently, but I’d say the evidence is rather strong that:
- the rise from ~1850-1950 very likely had some rising solar irradiance, helped out by rising CO2, CH4, etc.
- since solar irradiance has been almost constant at a high level since then (modulo 11-year sunspot cycles), and since Milankovitch-cycle effects are slow,
and modulo the usual jiggles:
- spike down and up from volcanoes (like Pinataubo)
- spike up from big ENSO (1998)
what’s left is anthropogenic effects and their feedbacks:
- down/flat from aerosols, until Clean Air Acts
- up from CO2
Do you call the last 1M years “normal”? Based on orbital cycles, this is what we’d expect for quite a while, i.e., glaciations, with interglacials of various lengths. Of course, if you keep going back, you can find a planet with radically different conditions, continents in different places, higher temperatures&oceans, much higher CO2 [before ocean absorbed as much, and plants put it into the ground as oil, gas, and coal.] Those conditions are, hopefully, irrelevant.
We might or might not be at the same temperature as around 1000AD, and we’re likely not up to where we were 8,000-10,000 years ago … but from orbital cycles, it *should* be a little cooler now than then, and flat, or slowly falling, but instead, it’s going up exceptionally fast.
I don’t care that much about the exact current temperature, I care more about it’s first and second derivatives: the first is clearly positive, and I don’t think the second is negative, which means the temperature is going up for a while, based on simple physics.
Back to the IPCC SPM forcing chart:
With the current level of CO2, it will keep getting warmer, because the forcing in the chart is from the *current* level of CO2 in the atmosphere, not our rate of emissions, which is more like the first derivative of the level of CO2. Given its long atmospheric life, if we stopped emitting CO2 tomorrow, it would take many decades for enough CO2 to get absorbed to bring that forcing back to zero. When the IPCC does the next report, I’d expect CO2 (and its forcing) to be higher, not less .. and the second derivative may be positive as well.
Over in the RC thread “Glacier Mass Balance…”, you might want to look at Prof. Pelto’s nice discussion of glaciers, including Washington’s North Cascades, and his website: http://www.nichols.edu/departments/glacier/intro.htm
To go further back, in that thread, see #15 and #55, where I put together some glacier information, using the longest Swiss glacier, going back 3500 years. Basically, that glacier is retreating up the mountain at an unusual rate, and is heading off the 3500-year chart in a few decades.
I always recommend Ruddiman’s very readable “Plows, Plagues, and Petroleum”, which has a really nice description of climate history and the detective work that goes on.
Is there serious disagreement from real scientists? From my outside viewpoint, not much.
Richard Lindzen often proposes theories (like IRIS) to explain why Co2 warming will be canceled by certain atmospheric effects, but they haven’t been that convincing or well-supported. It would be wonderful if they were true! But I doubt it. Everybody agrees we need to understand clouds an aerosols better.
There are a few others, and there is a stream of hypotheses that just don’t make sense, or lack mechanisms to explain why they should be true, so I usually apply Occam’s Razor, knowing that the science behind CO2 forcing is rock-solid. If there’s a CO2 elephant running around my living room, I don’t really need cosmic rays, or random gremlins, or cycles-conjured-out-of-cherry-picked-data, or weird solar effects … to explain why the floor is shaking.
This is like:
You are hot. A bunch of world-class doctors come in with various thermometers, and they get 100 +/- 1.0, so they argue a lot about the measurements differences. They keep improving thermometers, and a while later, they get 101 +/- .5. They still argue about the differences. The next batch of thermometers arrives, and they get 102 +/- .1. They still argue about the +/- .1, but they agree that the scinece is settled that you have a nasty heat stroke, getting worse, and it would be really good to get you in an ice bath SOON.
Meanwhile, random scientists (not doctors) and others (not even scientists) visit you. Some just look at you, taking no measurements, and say you look fine, so no action needed. Some say you’re getting warmer, but it’s just the natural day/night cycle. Some say it’s better for you to be warmer than colder. Some say that it’s an exceptionally warm July. Some say the doctors are still arguing, and therefore more study is needed, so take no action before that. At 102, you’re still OK, and you probably shouldn’t leap into a freezer, but if you don’t do something, you will not be in good shape, pretty soon.
========
Regarding the relationship of smoking to AGW, and the question about how long you’ve been watching, it sometimes takes a while to assess credibility of sources, because you have to watch how positions change (or don’t change) as new data arrives. It took me several years, but might be easier now.
If you haven’t already, you might take a quick look at the George C. Marshall Institute (Frederick Seitz) and SEPP (Fred Singer).
Seitz was (very long ago) a famous solid-state physicist, was President of the US National Academy of Sciences (1962-1969), and then President of Rockefeller University. Singer was first Director of the National Weather Satellite Service (1962-1964), and has written several books on GW. Those are good-sounding credentials! However…
If you go look at their websites, you will find there is a clear viewpoint, and you may find originals/copies of much of the anti-AGW information that echoes around. You might check the contact address of GMI, which will may be informative if you follow Washington, DC.
If you look them up in www.sourcewatch.org and Wikipedia, you can learn about funding, and the connection with smoking & tobacco companies for both of them …
Re: Washington: if you haven’t, you may want to check http://seattlepi.nwsource.com/business/299234_climateecon11.html.
You have some of the same issues as here in California, although probably not as bad. We have the problem that most of our precipitation comes in 5 months of the year, with 5 other months where snowpack is rather crucial.
Finally, regarding beliefs and self-interest: I think rational self-interest is a good thing, and I much prefer systems designed to align self-interest and shared interests, so that good things happen because people decide it’s good for them.
But, I don’t think long-term good comes from distorting science via politics or special economics interests.
There is no doubt that it has *never* been in RJ Reynolds’ interest to have the smoking/cancer link get proven, and they were were very effective in delaying that, and then appealing to individual rights of adults (highly libertarian on the surface), and then coopting state governments with money. Since ~90% of adult smokers started when they were younger than they were 18, and since nicotine exposure during the teen/pre-teen years is far more effective in creating addiction than later exposure [due to specific brain changes going on in the earlier years], it was certainly in RJ Reynolds’ interest to do “Joe Camel” and candy-flavored cigarettes like Twista Lime. [They still can sell the latter, just without the delicious name.]
[If you get interested in that, as there are many parallels with the tactics of anti-AGW arguments, Allan Brandt’s “Cigarette Century” is a good recent book]. I think AGW is much more complicated than smoking, but there are far more powerful interests involved, and there may well be similar disinformation.
I would love to believe that AGW is a hoax and is going away; it would simplify my life, but…
Hopefully some of this is useful.
3 June 2007 at 3:29 AM
Re: Kroganchor…Yep! there are non so blind as those who do not ‘wish’ to see. None of wants to believe the world is in trouble, but those of us with eyes and common sense can see the situation unfolding and instead of sticking our heads in the sand and hoping it was all a big mistake and will go away; instead we all have to do everything we possibly can to at least try and avert what is ahead…for your family and childen sake as well.
3 June 2007 at 4:54 AM
K. wrote “There is no doubt that a persons beliefs are influenced by perceived self interest. Isn’t this effect independent of the correctness of those beliefs?”
The answer is YES! It is not just the sceptics who don’t want to believe that CO2 is driving climate change and that they will have to give up their sexy SUVs and 4X4s. The scientsts too, don’t want to believe that global warming is as bad as it is. They don’t want to accept that within ten years the Arctic ice will have gone, along with most of the NH glaciers. Apart from anything else, it means those specialists will be out of work. There won’t be any ice in the northren hemisphere for them to investigate, and all the best remaining jobs are already taken by the Antarctica specialists.
The top scientist at the head of NASA denied global warming was a problem, because it might mean an end to his pet project of sending a man to Mars. But worse than that, although the climate models do not work, the modelers insist that they do, because to admit they are wrong would mean losing face!
I shouldn’t be skeptical about climate models without providing some evidence so I will just remark that the current models are based on the concept of local thermodynamic equilibrium (LTE.) The second hit from a Google search for “local themodynamic equilibrium” is from the prestigous “Eric Weinstein’s World of Physics” where it says -
Real atmospheres are not in local thermodynamic equilibrium since their effective infrared, ultraviolet, and visible brightness temperatures are different. http://scienceworld.wolfram.com/physics/LocalThermodynamicEquilibrium.html
3 June 2007 at 5:51 AM
Our economy is humming along. We’re rolling in money.
And where, pray tell, do you think that wealth comes from?
You are burning fossil fuels, and extracting it from the environment.
3 June 2007 at 8:14 AM
Thomas (#174),
He wasn’t trying to argue that there is no need to cut emissions.
He was explaining why the politicians are finally beginning to situp and take notice of the situation. From what he says, Australians have wanted to do something about greenhouse emissions for some time, particularly with the extended droughts they have been experiencing which have been creating water shortages the likes which they have never seen before, but the conservative party wasn’t. Now the conservative party is at least beginning to acknowledge there is a problem and a need to act - which he considers a good thing. You don’t need to convince him any more than me.
Anyway, Australia is looking into some fairly important things. Desalination plants driven by solar energy - which could conceivably act as a prototype for other parts of the world where water is scarce. AgriChar - which would be a non-intensive way of greatly increasing the productivity of agriculture while sequestering carbon for centuries - and which could easily be adapted to Third World countries.
3 June 2007 at 9:12 AM
A few thoughts about convincing skeptics…
When people come in here and seem especially skeptical of the science, I suspect that a large part of it has to do with how they are worried about the effects of doing something about climate change on the economy - although I have noticed other concerns. Another has to do with their worrying about creating some sort of world government.
I can understand a bit of both concerns, maybe even more than a little bit.
I know that I am worried about the world economy. In fact it is a big concern for me as the state of the economy will determine how many resources we have for dealing with the enormous problems that climate change will create for humanity. A great deal is riding on it being in good shape. But if we don’t do something about climate change, there is every reason for thinking that the world economy will be wrecked by it. And it is worthwhile to keep in mind that a former chief economist for the World Bank has argued that by the end of this century, the world could be facing something as severe as the Great Depression - which is likely an underestimate.
As far as the United Nations goes, I of course realize that it is anything but a world government. Nevertheless, I would rather not see it turn into one, especially if it is handed too much power. Likewise, I would rather not see governments handed too much power. But the longer we wait before doing something about climate change, the harder it hits us, and the more likely people will become desperate enough to sacrifice their freedom to some demagogue - who will then in all likelihood be concerned with maintaining power than doing something about climate change.
A real nightmare scenario for me is a centralized world government with control of a single currency which attempts to finance its programs for dealing with all of the problems resulting from severe climate change by hyperinflating its currency. It could very well be 1920s Germany on a world scale - without the benefit of an outside world economy needed for economic recovery. In my view, this could set us back a great deal - more than I suspect most could imagine. But this becomes far more likely the longer we wait to do something about climate change.
Maybe if we learn to address some of these concerns earlier rather than later in a discussion, and if we point out that given their concerns, they should also be concerned with climate change, then we will actually stand a better chance of getting them onside. Sometimes I get the feeling that we oftentimes do a better job of convincing ourselves than convincing those who actually need the convincing. If we get them onside, it could really help - particularly since they will stand a far better chance of convincing others who are opposed to even acknowledging that there is a problem than many of us could do ourselves.
3 June 2007 at 9:41 AM
Kroganchor #171. Yes, re-radiation from CO2 has been observed both in the atmosphere and in the lab. The principle is called Kirchhoff’s law which holds that at thermal equilibrium a body will emit an equal amount of energy as it absorbs.
Now you are not the first to doubt this happens (there are even papers that snuck into print), but it is still wrong. Re-radiation in keeping with Kirchhoff’s law and our ability to model what happens was demonstrated in Applied Optics 35 1519 (1996) by Evans and Puckrin. (And yes I know about convection, but you just have to account for the additional energy flows)
The experiment was simple enough and it is elegant (IMHO) in the parsimonious way that it answers a complicated question.
They used a standard IR spectrometer and instead of turning on the glowbar light source placed a gold mirror at 45o above liquid nitrogen in a dewar, so that the detector looked through the spectrometer at the LN2 surface at 77K. They then placed a sample (they used a CFC, but the principle is what they were afterin the light path and measured the emission. Because the temperature of the “source” is so low, 77K, the
spectrometer is looking at a source of very low (almost no) emission and will not see any absorption of the light launched into the system, but only emission from any gas in the light path.
Evans and Puckrin showed that the radiative transfer codes based on spectroscopy and Kirchhoff’s law could perfectly reproduce the measured emission spectra.
This means that not only do you SEE the effect of that 0.03% CO2 in the IR emission spectrum, but you can, from first principles, calculate what it looks like.
On the other side, emission from CO2 has been seen in the atmosphere, again, in good agreement with the radiative codes.
To quote them:
“In atmospheric radiation codes such as FASCDIP, the absorption spectra of gases are used to calculate emission spectra. These emission spectra actually determine the atmospheric greenhouse radiation; any increase in this radiation will affect the surface energy balance and will cause global warming.
In large climate models and most radiation codes, Kirchoff’s law is assumed to be valid without any caveats. However, there have been questions raised recently by Barett as to the validity of Kirchoff’s law in the atmosphere. Hence an experimental verification of Kirchoff’s law for laboratory cells containing greenhouse gases which shows the validity of the radiation codes should be beneficial in answering such criticisms of the global warming theory. In this paper we have demonstrated that radiation codes predict the correct emission spectrum of CFC-12 from a laboratory gas cell even though the cell is not in a blackbody cavity. These laboratory measurements will also assist in the measurements of absolute greenhouse fluxes……”
As Ray Ladbury made clear, sensible physicists had no doubt about Kirchhoff’s law applying. The Evans and Puckrin paper did not raise any fuss because it confirmed the obvious, but still one constantly encounters the equivalent of Barretts denialist driven misreading of the science. When you are trying to beat back a pail full of spaghetti that is being thrown against the wall, some will get through and pollute the atmosphere. Witness the silly recent paper by Beck, and much more.
3 June 2007 at 10:17 AM
Eli Rabett, you say that “Kirchoff’s law is assumed to be valid without any caveats”, however, is this how the various models are run.
Let me ask you a couple of simple questions, at one of the wavelengths of you choice, what is the relationship between absorbance of a photon by CO2 and :-
A) A doubling of the CO2 concentration. So that at 380 [CO2] ppm; 50% of photons are absorbed, it follows that at 760 [CO2] ppm then X% of photons will be absorbed.
B) The attenuation of absorbance through the atmosphere at 380 [CO2] ppm, so that overall there is an absolute absorbance of 50% of the photos at a particular weavelength. What is the relationship bettwen distance from the earths surface and the absorbance?
3 June 2007 at 10:43 AM
What is a “climate Skeptic”? Please define this term, as this is not a trivial request. The entire so called global warming debate is being conducted with out basic terms defined. The IPCC definition of climate change is “Climate change refers to any change in climate over time, whether due to natural variability or as a result of human activity”. So are there 730 climate changes a year from an inter-day temp range or are 4 climate changes a year from the seasons, or one week there is a blizzard and the next week sunny and 75. What is climate change?
3 June 2007 at 11:37 AM
Jim Eager (#159) wrote:
I know that I was “skeptical” only a few weeks ago about water vapor being a greenhouse gas. But the fact is that it is a far more effective greenhouse gas than carbon dioxide. Some of what the skeptics get fed is true but it is fairly selective, and as one nineteenth century thinker wrote, “the true is the whole.” Water vapor is a far more effective greenhouse gas, but it remains in the atmosphere for only a short time before it falls out as rain or snow. In contrast, a great deal of carbon dioxide remains in the atmosphere for centuries - and it determines how the equilibrium level of water vapor.
Similarly, skeptics will sometimes point out that carbon dioxide has very little effect at near the surface. This is true. But carbon dioxide is quite effective in the stratosphere - which is quite dry.
Skeptics may point out that the stratosphere is becoming cooler. This is true. With increased water vapor, some of it is actually managing to make it to that part of the stratosphere which is high in ozone - and ozone is an effective greenhouse gas. The water vapor destroys ozone which leads to the cooling of the stratosphere. But the cooling of the stratosphere leads to an increased temperature differential between the surface and the upper atmosphere. This increases convection, winds near the surface of antarctica, the churning of the upper layers of the ocean which is rich in organics - leading to higher levels of carbon dioxide and methane being released into the atmosphere.
*
There is a tendency - even among the honest - to debate and disagree with every point being made by those who they disagree with. This is called “complementary schismogenesis,” and I have seen it marital ping pong and I seen it at the level of 20th century epistemology where schools of thought were divided between those who argued for the hierarchical nature of knowledge where it builds from a foundation of some sort (the foundationalists) and those who argued for the interdependence of the elements of our knowledge (the coherentialists). After a while they were each arguing against strawman versions of the other’s position.
*
I went to St. John’s college. It was devoted to the Great Books of western civilization, beginning with ancient greek philosophy, reading the original Origin of the Species and working through proofs in Lobachevskian hyperbolic geometry. Despite my student loans, it is an experience which I wouldn’t trade for anything.
One of the points which they emphasized was being able to hold discussions with those who have different views, that this would often reveal a great deal more of any given work than if one were simply studying it by oneself. Sometimes all this would result in were bull sessions, particularly when people hadn’t done their reading. But on occasion, it would work beautifully. It was almost as if the linear text on the two-dimensional pages had risen into the air forming some sort of three dimensional structure. At such times, even the dullest among us seemed capable of deep insights, and when you finally walked out of class, you would feel like you were six feet off the ground in a near dazed state for the next hour.
But what was the principle behind this?
Well, it was largely mathematical. If you have one individual with three insights, they are able to make only three connections between any two of them. But if you have two people with three insights each, the number of connections becomes fifteen. By the time you have five people, a hundred and five connections are possible. By the time you have twenty people actively participating, you probably have a cacophony of confusion. Too many cooks, I suppose.
But the principle is real.
And even when you are having a conversation with someone who is unwilling to acknowledge any of the insights you have brought to the table, you can still walk away with more than you had when you first arrived. But if you are willing to acknowledge what is true in what they have brought to the table, then show how it all fits together, at least among those who are more honest, they are more likely to start listening - because they will realize that you are listening. They will be less likely to fall into the trap of viewing everything in terms of “us vs. them.” There will undoubtedly be a great many people that this won’t work with, but it will work with some. And those who it works with will likely be able to reach people you can’t.
Anyway, I figure this is part of what Figen Mekik was getting at back in #165.
3 June 2007 at 11:45 AM
Timothy Chase 179> A few thoughts about convincing skeptics… Maybe if we learn to address some of these concerns earlier rather than later in a discussion, and if we point out that given their concerns, they should also be concerned with climate change, then we will actually stand a better chance of getting them onside.
That is a very good point. I am sympathetic to reducing the negative effects of AGW, but most of what I see politicians and governments actually doing (such as carbon trading) is creating opportunities for corruption:
http://business.guardian.co.uk/story/0,,2093816,00.html
…reveals major flaws in the global system designed to reduce emissions
As most economists recommend, a carbon tax (which could replace other taxes), would give everyone clear incentives to conserve and develop new technology to replace fossil energy. Of course, it does not give politicians the opportunity to directly pick winners and losers…
3 June 2007 at 12:09 PM
One of the counter claims by GW skeptics is that evaporation feedbacks against warming, so we don’t have so much to worry about after all. How credible is that? It would be easier to deal with the whole picture if all sides would let go their singular obsession over just temperature changes. If more water evaporates to help compensate for the warming forces, then we’d expect dew points to rise, not just (or even, instead of) temperatures. I suspect that they have, but I don’t see enough about that - what’s the story?
3 June 2007 at 2:23 PM
Making connections
Sorry to post this again.
Hopefully someone will be kind enough to delete the earlier version. A few of the sentences were bizarre hybrids of alternate ways of expressing the same thought. Somehow I suspect this would be distracting if not outright confusing.
Jim Eager (#159) wrote:
I know that I was “skeptical” only a few weeks ago about water vapor being a greenhouse gas. But the fact is that it is a far more effective greenhouse gas than carbon dioxide. Some of what the skeptics get fed is true but it is fairly selective, and as one nineteenth century thinker wrote, “the true is the whole.” Water vapor is a far more effective greenhouse gas, but it remains in the atmosphere for only a short time before it falls out as rain or snow. In contrast, a great deal of carbon dioxide remains in the atmosphere for centuries - and it determines the equilibrium level of water vapor.
Similarly, skeptics will sometimes point out that carbon dioxide has very little effect near the surface. This is true. But carbon dioxide is quite effective in the stratosphere - which is quite dry.
Skeptics may point out that the stratosphere is becoming cooler. This is true. With increased water vapor, some of it is actually managing to make it to that part of the stratosphere which is high in ozone - and ozone is an effective greenhouse gas. The water vapor destroys ozone which leads to the cooling of the stratosphere. But the cooling of the stratosphere leads to an increased temperature differential between the surface and the upper atmosphere. This increases convection, winds near the surface of antarctica, the churning of the upper layers of the ocean which is rich in organics - leading to higher levels of carbon dioxide and methane being released into the atmosphere.
*
There is a tendency - even among the honest - to debate and disagree with every point being made by those who they disagree with. This is called “complementary schismogenesis,” and I have seen it in marital ping pong and I seen it at the level of 20th century epistemology where schools of thought were divided between those who argued for the hierarchical nature of knowledge where it builds from a foundation of some sort (the foundationalists) and those who argued for the interdependence of the elements of our knowledge (the coherentialists). After a while they were each arguing against strawman versions of the other’s position.
*
I went to St. John’s college. It was devoted to the Great Books of western civilization, beginning with ancient greek philosophy, reading the original Origin of the Species and working through proofs in Lobachevskian hyperbolic geometry. Despite my student loans, it is an experience which I wouldn’t trade for anything.
One of the points which they emphasized was being able to hold discussions with those who have different views, that this would often reveal a great deal more of any given work than if one were simply studying it by oneself. Sometimes all this would result in were bull sessions, particularly when people hadn’t done their reading. But on occasion, it would work beautifully. It was almost as if the linear text on the two-dimensional pages had risen into the air forming some sort of three dimensional structure. At such times, even the dullest among us seemed capable of deep insights, and when you finally walked out of class, you would feel like you were six feet off the ground in a near dazed state for the next hour.
But what was the principle behind this?
Well, it was largely mathematical. If you have one individual with three insights, they are able to make only three connections between any two of them. But if you have two people with three insights each, the number of connections becomes fifteen. By the time you have five people, a hundred and five connections are possible. By the time you have twenty people actively participating, you probably have a cacophony of confusion. Too many cooks, I suppose.
But the principle is real.
Even when you are having a conversation with someone who is unwilling to acknowledge any of the insights you have brought to the table, you can still walk away with more than you had when you first arrived. But if you are willing to acknowledge what is true in what they bring to the table, then show how it all fits together, at least among those who are more honest, they are more likely to start listening - because they will realize that you are listening. They will be less likely to fall into the trap of viewing everything in terms of “us vs. them.” There will undoubtedly be a great many people that this won’t work with, but it will work with some. It might even help with those who aren’t participating in the conversation at the time - but who are listening.
Anyway, I believe that some of this is part of what Figen Mekik was getting at in #165.
3 June 2007 at 2:37 PM
Timothy Chase:
Yes, water vapor is a greenhouse gas. Then, wouldn’t it be even worse for any other effect to increase water evaporation?
PS - I have heard great things about the “barefoot St. Johnies.”
3 June 2007 at 3:17 PM
Neil B (#185) wrote:
Evaporation will certainly lead to a cooling of the surface of the ocean, but it would also lead to an increased temperature in the atmosphere. So that would be first effect. However, water vapor in the lower atmosphere is a highly effective greenhouse gas, so it will lead to greater absorbtion of infrared, heating the lower atmosphere, and given the feedback of absorbtion and re-emission between the atmosphere and the surface (including the ocean) it will actually tend to raise the temperature of the ocean over time.
Additionally, the atmosphere will be able to hold more water vapor only by achieving a higher temperature - and as it becomes saturated with water vapor, this will tend to reduce the amount of evaporation which can take place. So for a given temperature, there will be an equilibrium level of water vapor, and the higher this level is, the greater water vapor is contributing to the greenhouse effect.
Now of course water vapor will also condense into clouds and clouds have an albedo effect where they scatter sunlight back into space. This will reduce the amount of sunlight which gets absorbed at the surface, and thus reduce the thermal energy which enters the system. In this sense, they lead to a negative forcing.
However, clouds will also tend to trap infrared radiation which might otherwise escape at night. This is why you will notice that overcast nights tend to be warmer than clearer nights. It is actually nightime which concerns us most when it comes to the greenhouse effect - because it is at this time that thermal energy tends to be lost into space.
There are other effects, of course, but this is a good start.
*
Incidently, unlike water vapor, carbon dioxide itself isn’t that effective a greenhouse gas. But it is effective in the sense that it will tend to stay in atmosphere much longer than water vapor. With a relatively small initial rise in average temperature, it starts a positive feedback loop where water vapor raises the temperature leading to more water evaporation. This raises the water vapor content of the atmosphere until a new equilibrium is established - with the level of carbon dioxide being the determining factor - at least until you get to the positive feedback loops associated with the carbon cycle.
3 June 2007 at 3:48 PM
The situation with water vapour is that its atmospheric concentration depends on the surface temperature. The hotter the surface the more water vapour is evaporated and the greater is its greenhouse effect.
Carbon dioxide is also a greenhouse gas and is dominant when the there is little water vapour. This is true in deserts, but also above ice covered surfaces. Thus the altitude of the snow line is not only set by latitude, but also by atmopheric CO2 concentration. This is why the glaciers are melting globally.
Carbon dioxide sets the base greenhouse effect and water vapour amplifies it. The problem is that we do not know how much this amplification (climate sensitivity) is. But I can give you one clue.
Saturated water vapour density increases almost exponentially with temperature over the range 0 to 100 C. The higher that the base temperature is set by CO2, then the higher will be the rate of increase in water vapour. In other words, as the base temperature is raised by us pumping more CO2 into the atmosphere, then the climate sensitivity will increase (exponentially?) Think about it!
However, there is another big player in the greenhouse effect stakes and that is clouds. More water vapour, more clouds, less sunshine and then we have to sweat it out under a cloudy sky which not only hides the sun but heats us up with its greenhouse effect.
3 June 2007 at 4:15 PM
Neil B (#187) wrote:
Certainly.
For example, methane is (I believe) about forty times more effective, gram to gram, as carbon dioxide. But it tends to remain in the atmosphere for only a few decades - before being converted into carbon dioxide. Increased sunlight would obviously be effective. So is nitrous oxide - a product of the combustion of many biofuels. But the central question, as I understand it is, “How long?” In a simple world with just carbon dioxide and water, once you remove the carbon dioxide, the system will begin to return to its original equilibrium. The same is true of any other forcing.
But of course the world isn’t quite so simple. There is, for example, the positive feedback from the melting of the arctic cap lowering the albedo, increasing the absorbtion of solar energy and thus the amount of thermal energy entering the system.
I don’t know the origin of that expression, although it might have something to do with the Greeks. Socrates was in essence the school mascot. I will have to check with Moira - she was both undergrad and grad, and she spent time at both schools. One is in Santa Fe where I was at, the other in Annapolis. But a little bit of news gets back and forth. For example, from what I understand, the Johnies at Annapolis often got the Naval Academy’s goat. Something of a tradition, I believe.
3 June 2007 at 6:22 PM
Re #189:
“Saturated water vapour density increases almost exponentially with temperature over the range 0 to 100 C. The higher that the base temperature is set by CO2, then the higher will be the rate of increase in water vapour. In other words, as the base temperature is raised by us pumping more CO2 into the atmosphere, then the climate sensitivity will increase (exponentially?) Think about it!”
Luckily for us, the greenhouse forcing from a given amount of H20 is logarithmic. ln(e^(x)) works out to simply kx (a linear function), so an exponentially increasing amount of water vapor will only increase climate forcing linearly. The end effect is that water vapor will multiply the CO2 forcing by a constant.
My understanding is that climate models are quite effective at simulating the direct (greenhouse effect, not clouds) feedback from H20 and it’s well incorporated into global warming projections.
3 June 2007 at 6:23 PM
The reason many skeptics are skeptics, is because of comments like this:-
�Additionally, the atmosphere will be able to hold more water vapor only by achieving a higher temperature - and as it becomes saturated with water vapor, this will tend to reduce the amount of evaporation which can take place. So for a given temperature, there will be an equilibrium level of water vapor, and the higher this level is, the greater water vapor is contributing to the greenhouse effect.�
Timothy Chase
�The situation with water vapour is that its atmospheric concentration depends on the surface temperature. The hotter the surface the more water vapour is evaporated and the greater is its greenhouse effect.�
Alastair McDonald
Don�t you realize what system you are describing? The Earth rotates once every 24 hours. The system is never at equilibrium, the system can be better described as a steady state, but even then only over a yearly time scale. If you are trying to describe changes in the Earths climate you need to understand the transfer of Heat. The idea that you can pack more and more water vapor into the atmosphere, for very small increases in energy input, is nonsense. If you really want to persuade skeptics, you need to decend from the moral high ground you inhabit and produce data, or at least models supported by data.
So what happens to the water vapor pressure in 24 hours ?
How is heat transferred from water vapor during the gas/liquid state transition that occurs during the night ?
What happens to the concentration of water soluble gases, like N2, O2 and CO2, when water undergoes this phase transition ?
How does CO2 affect the rates at which the phase transition occurs?
How does CO2 affect the direction of IR emission?
What are the albedo values for different loacalities (e.g. ocean, grassland, snow, sandy desert) for reradiated IR?
[Response:The system is very complicated but to first order all the signs are that relative humidity stays roughly constant; so warmer air means more water vapour in it - William]
Finally, why do you insist that CO2 has such a long half-life?
[Response:http://www.realclimate.org/index.php/archives/2005/03/how-long-will-global-warming-last/ - William]
What has happened to the C14 generated by atmospheric H-bomb testing, it is gone. The linger time of C14O2 in the atmosphere indicates that the half-life of CO2 in the atmosphere is between 9-15 years. (I know the radioactive halflife of C14 is 5600 years).
3 June 2007 at 7:07 PM
“Re: Kroganchor…Yep! there are non so blind as those who do not ‘wish’ to see. None of wants to believe the world is in trouble, but those of us with eyes and common sense can see the situation unfolding and instead of sticking our heads in the sand and hoping it was all a big mistake and will go away; instead we all have to do everything we possibly can to at least try and avert what is ahead…for your family and childen sake as well.”
Comment by Lawrence Coleman
This RC website is evidence for a thirteenth tipping point in climate change.
http://www.motherjones.com/news/feature/2006/11/13th_tipping_point.html
3 June 2007 at 9:31 PM
Is there a reason for the variablity of data sets in the graph (1) above in the time periods between 800-1800?? It seems as though all of the data in more recent years is much more uniform. Why is this? For example DWJ2006 and ECS2002 appear to vary in measurements by as much as .5C or more in some cases versus JBB1998 and MJ2003. Even if they are using different models why would they all begin to move in lock step as time moves closer to present? Is the data set just more accurate now?
4 June 2007 at 12:28 AM
yartrebo (#189) wrote:
Yep. Approximately 2.8 degrees Celsius, judging from a recent paleoclimatological study. But it should be remembered that when we speak of a constant climate sensitivity, we are generally thinking equilibrium level - and it takes a while to get there.
Please see:
Climate sensitivity constrained by CO2 concentrations over the past 420 million years
Dana L. Royer, et al
Nature 446, 530-532 (29 March 2007)
Abstract Only: http://www.nature.com/nature/journal/v446/n7135/abs/nature05699.html
Clouds and their albedo effects are included in the models. However, there is still considerable room for improvement - and it is quickly being made. For example, HADGEM1’s clouds tended to be too thick (vertically) but too narrow. This no doubt resulted in an underestimate of the albedo effect, but it would have also resulted in an underestimate of the thermal radiation being trapped by clouds at night. However, HADGEM3’s clouds are far more realistic.
It is also worth noting we have recently detected a twilight zone around clouds, invisible to the eye, but extending for kilometers. The effects of the twighlight zone no doubt will soon be incorporated into the models - and given us a sharper image of what is going on.
For more on this, please see:
Widespread ‘Twilight Zone’ Detected Around Clouds
May 3, 2007
http://www.nasa.gov/centers/goddard/news/topstory/2007/twilightzone_particles.html
4 June 2007 at 12:56 AM
>181, the answer would be “it depends on the air pressure”
I’m not a physicist, I”m just reading this stuff —- but I recognize the questions having read some history.
You should read the AIP History section on radiation physics; it’s the first link under Science, in the sidebar.
Your questions in 181 are like those the researchers were posing back the 1930s, and you can read the history to see how they got past those.
It took World War II and the development of the first computers to do enough math to get to the 1950s level where they understood what happened with radiation physics, particularly how CO2 behaved at the very low air pressure in the upper region of the atmosphere.
Remember, an emitted photon can go off in any direction; only those emitted at the edge of space that happen to go outbound have a fair chance of actually carrying energy away from the planet.
4 June 2007 at 6:44 AM
[[The idea that you can pack more and more water vapor into the atmosphere, for very small increases in energy input, is nonsense.]]
Google “Clausius-Clapeyron law.”
4 June 2007 at 7:55 AM
Re #192, to William…
I had assumed that as the atmosphere is heating faster than the oceans, that worldwide, the average relative humidity was is the decline. The analogy is a bathroom… in order the get a bathroom less “steamy” (without getting rid of the water) is to heat the room (not the water). I assumed this is the reason that the tendency to drought is becomming widespread.
William, am I wrong?
4 June 2007 at 9:15 AM
wade shatara 182 wrote:
For “Climate” and “Climate Change,” I would suggest the following:
Typically, when I use the term, “climate skeptic,” I simply assume that someone who labels themselves a “climate skeptic” is a climate skeptic. In this sense, it would be a matter of self-labeling. But what I take this to mean is that they deny that the scientific case for anthropogenic climate change has been made when it is accepted by the vast majority of scientists. By this, they will typically mean that they do not believe that the scientific case for one of the following has been made:
1. Carbon dioxide absorbs infrared radiation and therefore traps thermal radiation in the atmosphere, raising the temperature above what it would be otherwise.
2. Humans have been responsible for substantially raising the level of carbon dioxide in the atmosphere.
3. The extent to which we have raised the level of carbon dioxide in the atmosphere has had a significant effect upon the average temperature of the earth as a forcing where the level of water vapor is raised by means of a positive feedback loop.
4. The level of carbon dioxide is now well above what it has been for the past 500,000 years.
5. The level of carbon dioxide in the atmosphere is now high enough that it will cause substantial climate change.
However, “skeptic” often has a positive connotation - which is part of the reason why they will use the term. But it is useful to keep in mind that there are also evolution skeptics, big bang skeptics, relativity skeptics, and heliocentric skeptics (yes - they are still around). I myself might prefer the term “contrarian” as it is more neutral while implying that their position is at a variance from the accepted scientific consensus - but this is often taken to imply that they actually deny one or more of the above propositions.
In any case, you might want to look at the following:
How to be a real sceptic
19 Dec 2005
http://www.realclimate.org/index.php?p=210
*
If someone wants to be properly skeptical of the case for the propositions numerically listed above, I would suggest that one begins by asking what the scientific case for one or more of those propositions is. Then within the context of a discussion, it is possible to examine how strong the scientific case for each of those propositions is and whether skepticism is warranted.
4 June 2007 at 10:32 AM
It states on front page: â??Climate scepticsâ?? do not like this (graph showing temperature rise) and keep coming up with their own temperature histories.
Climate sceptics invariably do not question the rise in temperature just the cause being put down to the wrong light bulbs being used, etc.
4 June 2007 at 10:43 AM
Error Correction from receently sent comment:
“It is strange what weather we have had all this winter; no cold at all, but the ways are dusty and the flies fly up and down, and the rosebushes are full of leaves; such a time of the year as never was known in this world before here.
Samuel Pepys’ diary, England, January 1661. A hundred years later in winter the Thames froze.
4 June 2007 at 12:37 PM
#192, DocMartyn, William gave an inline reply pointing out the misunderstanding underlying your first two questions there.
I urge you — as I did in reply to your #181 —-read the AIP History. Your questions are those asked in the 1930s and earlier, before most of what we know.
You also asked,what happened to the C14 from nuclear tests, then stated your belief that it’s all disappeared.
Why do you believe that? I find no support — except statements by creationists visiting physics forums — for that belief.
You can look this stuff up.
http://www.radiochem.org/paper/JN62/jn6206.pdf
Temporal Variation of Carbon-14 Concentration in Tree-ring Cellulose for the Recent 50 Years
Journal of Nuclear and Radiochemical Sciences, 2005
http://www.llnl.gov/tid/lof/documents/pdf/312713.pdf
Discussion: reporting and calibration of post-bomb 14 C data
PJ Reimer, TA Brown, RW Reimer - Radiocarbon, 2004
Look for articles with footnotes that give sources, not just statements of belief. What are your sources?
4 June 2007 at 12:37 PM
re 155: Tim Chase wrote: (We know that it is our carbon dioxide which has been entering the atmosphere because of isotopic analysis - the carbon we put into the atmosphere has an extra neutron - making it heavier…
Hi Tim, I’m not challenging you…just asking for clarification.
My understanding about how we know that the increasing CO2 (carbon dioxide) is anthropogenic (from human sources) from carbon isotope analysis (not to mention other ways as well) is the following from memory:
1) The heavier carbon 14’s nucleus is no longer radioactive in the atmospheric samples in question. (ie. the half-life has expired so that the carbon is well over ~70,000 years old…ie not going through the short carbon cycle of oceans to air to oceans or to biomass like plants trees soil, etc…ie. it comes from fossil fuel sources.
2) The carbon 12 to carbon 13 ratio is *lighter* toward more carbon 12 because the carbon’s source is plant based (fossil fuel based because plants have enzmyes that selectively exclude a lot of the heavier C13 and most fossil fuels come from plants) instead of more heavier carbon 13 which would be volcanic in origin (from Earth’s mantle).
So how do you get “heavier” CO isotopes showing the CO2 is anthropogenic…or did I miss something?
If I have missed something about the carbon 14 or something is off about my explanation above…please let’s discuss it.
Thanks,
4 June 2007 at 12:44 PM
So how do you get “heavier” CO isotopes showing the CO2 is anthropogenic…or did I miss something?
The evidence actually is that the 13C/12C ratio in the atmosphere has been declining, as I understand it.
It’s my understanding that deep ocean carbon is also depleted in 13C (due to the operation of the oceanic biological carbon pump), so the argument should really include a reason why increased upwelling/outgassing from the deep ocean can’t be the reason for increased atmospheric CO2 (not that I think it is, just that the possibility needs to be addressed in the argument).
4 June 2007 at 12:45 PM
Earlier I had mentioned various effects of glacier melt - the practical importance of glaciers - but I lacked figures. The following, which simply focuses upon the glaciers of Tibet should give us some sense of the magnitude of the problem.
With regard to flooding caused by glacier melt (in some places), I would suggest the following:
*
With regard to water shortages and their effects upon people, agriculture, and ecology, one might start with the following:
… and here is something more recent:
Global warming: Tibet’s lofty glaciers melt away
Research by scientists shows that the ice fields on the roof of the world are disappearing faster than anyone thought.
By Clifford Coonan
Published: 17 November 2006
The Independent/UK
http://environment.independent.co.uk/climate_change/article1990381.ece
It has been estimated that the glaciers of Tibet are being cut in half every decade. It also appears to be the case that they strongly influence global climate patterns. I myself will be digging into this some more in my own personal reading.
4 June 2007 at 12:56 PM
Paul Dietz #203 wrote:
Richard (#202), I don’t mind being challenged, and Paul, I don’t mind being corrected. I was simply under the impression that the reason why C13 was a marker for human emissions was that plants prefer C12, but if I am wrong, then it means that I have learned something.
4 June 2007 at 1:24 PM
>202, 155
Tim Chase had that backward when he wrote in #155 “the carbon we put into the atmosphere has an extra neutron …” if he meant fossil fuels. That would describe carbon-14, produced by hydrogen bomb tests in excess of the background produced by cosmic rays.
See this earlier thread:
http://www.realclimate.org/index.php?p=81
16 Dec 2004 How do we know that recent CO2 increases are due to human activities?
“… a very nice record of atmospheric 13C variations through time, and what we find is that at no time in the last 10,000 years are the 13C/12C ratios in the atmosphere as low as they are today. Furthermore, the 13C/12C ratios begin to decline dramatically just as the CO2 starts to increase — around 1850 AD. This is no surprise because fossil fuels have lower 13C/12C ratios than the atmosphere.
“The total change is about 0.15%, which sounds very small but is actually very large relative to natural variability. … .”
and many other examples
http://www.springerlink.com/content/mw3850g185v8tvp1/
4 June 2007 at 1:47 PM
Hank Roberts (#207) wrote:
That is what I was looking for. I stand corrected - and I am grateful.
Thank you, Hank.
4 June 2007 at 2:30 PM
Richard Ordway (#203) wrote:
This is probably what I was mis-remembering within the context of evolution - specifically with respect to carbon dating fossils, although it is actually the radioactive decay of C14 which comes into play. Now everything fits together. Fossil fuel from plants, plants preferentially uptake the lighter C12 - and bingo! The smoking gun. Or would that be a tailpipe?
4 June 2007 at 3:19 PM
Hi Tim,
If I remember correctly, at least one peer-reviewed study also mentioned that there is a high probability that the exact C13 to C12 ratio is a signature for each individual plant type (ie. ferns, palms, etc)!…so perhaps fossil fuel burning has a signature C14 to C12 ratio as well…anyone?
4 June 2007 at 3:20 PM
Oops,
I meant C13/C12 ratio above not C14 to C12. Sorry.
4 June 2007 at 3:32 PM
Re #203, 204, 207, 208, 209
Part of the reason why I picked Real Climate is because I tend to move quickly, perhaps a little too quickly, and not as systematically as I probably should. As such, I will tend to over-extend myself. At times I will make mistakes. In the past, I have belonged to forums where I needed to be corrected, but no one had either the expertise or willingness to do so.
I suspected that Real Climate would be different. I am glad to see that, at least with respect to this, I was right.
4 June 2007 at 3:37 PM
Dear Hank,
“#192, DocMartyn, William gave an inline reply pointing out the misunderstanding underlying your first two questions there.
I urge you — as I did in reply to your #181 —-read the AIP History. Your questions are those asked in the 1930s and earlier, before most of what we know.”
The very simple questions I asked have not been answered. I ask again;
What is the relationship between absorbance of a photon by CO2 and :-
A) A doubling of the CO2 concentration. So that at 380 [CO2] ppm; 50% of photons are absorbed, it follows that at 760 [CO2] ppm then X% of photons will be absorbed.
B) The attenuation of absorbance through the atmosphere at 380 [CO2] ppm, so that overall there is an absolute absorbance of 50% of the photos at a particular weavelength. What is the relationship between distance from the earths surface and the absorbance?
I am neither stupid, nor poorly read. I wish someone on this site to state an answer to these very simple questions.
“You also asked,what happened to the C14 from nuclear tests, then stated your belief that it’s all disappeared.
“Why do you believe that? I find no support — except statements by creationists visiting physics forums — for that belief.”
I was under the impression that the majority of the posters here would be rather well informed as to the isotope record and so neglected to give any links. However, I will show two data set representations, from Germany and New Zealand.
http://cdiac.ornl.gov/trends/co2/graphics/cent-scgr.gif
http://www.niwascience.co.nz/rc/prog/greenhouse/info/3
It can be seen that since the Test ban treaty, the levels of 14CO2 in the atmosphere are declining. It is also true that there will be some dilution effect from the addition of Human generated CO2 injected into the atmosphere over the same time period. However, ignoring the human part for a moment, it is obvious that the atmospheric half-life is about 12 years, consistant with my estimate for an average half-life of 9.2 years for CO2.
http://i179.photobucket.com/albums/w318/DocMartyn/Atmosvsinput.jpg
The dilution artifact may extend this by a maximium of about 6 months, by a back of the envelope calculation, but the mixing artifact of injecting 14CO2 into the upper atmosphere, during the H-Bomb tests themselves, is probably greater than this. When I have a little more time I will model it more acurately.
BTW “except statements by creationists visiting physics forums”, do you not think that statement was insulting?
4 June 2007 at 3:39 PM
And as to why fossil fuels have a low 13C/12C ratio — it’s because the carbon was selected by living organisms that favor C12 slightly over C13.
http://www.nsf.gov/news/frontiers_archive/3-97/3rocks.jsp
http://www.bio.net/hypermail/plant-biology/1994-February/002619.html
Astronomers pay close attention to that C12/C13 ratio in stars and comets; both are produced in fusion reactions.
The Isotope Ratio C^{12}/C^{13} in a Comet
A Stawikowski, JL Greenstein - The Astrophysical Journal, 1964
http://www.journals.uchicago.edu/cgi-bin/resolve?id=doi:10.1086/148023
Both isotopes are stable (they don’t fission spontaneously); changes in the ratio occur in living systems:
Plants do selectively favor C12 over C13; metabolic paths also differ; the C12/C13 ratio distinguishes cane sugar from beet sugar (both sucrose))
http://links.jstor.org/sici?sici=0006-3568%28197204%2922%3A4%3C226%3ANAOTSI%3E2.0.CO%3B2-G&size=LARGE&origin=JSTOR-enlargePage#abstract
The ratio is also used to distinguish endogenous mammalian testosterone from supplements made from plant sources (in drug testing for athletes)
R Kazlauskas, G Trout - Therapeutic Drug Monitoring, 2000 - drug-monitoring.com
… The most commonly used endogenous steroid has been testosterone (T) … T used in pharmaceutical preparations has a lower C12/C13 ratio than naturally …
[I’d double check wherever you find the ratio stated: C13/C12 is not the same as C12/C13, but don’t assume secondary sources got it right — hr]
Those living organisms have pre-selected the carbon that ends up buried and changed over time into fossil coal and petroleum.
Watch carefully where religious beliefs get involved; the physics of radiocarbon dating
http://www.c14dating.com/int.html
causes problems for some people’s belief systems, and you’ll find a whole lot of beliefs stated as facts in discussions about carbon isotope issues in physics.
For example, freshwater mussels are very low in carbon-14 –you can look this stuff up: http://www.ncseweb.org/resources/articles/8052_issue_08_volume_3_number_2__12_4_2002.asp#Answers%20to%20Creationist%20Attacks%20on%20Carbon-14%20Dating
Always ask and check the cites.
Trolls don’t footnote, perhaps the devil is in the details.
4 June 2007 at 3:49 PM
Paul Dietz, Re #204. I can think of 2 reasons and one test that show the carbon in the atmosphere is not coming from the Oceans. 1)Since the overturn time of water in the Oceans is of order hundreds to thousands of years, that would imply that at some point in the past few thousand years, the oceans got a big infusion of CO2. I don’t know where this would have come from except from the atmosphere, and we know that carbon in the atmosphere is higher than it has been in at least 650000 years. Second, if the carbon is coming from the oceans, the carbon content of the oceans ought to be decreasing–it is doing the opposite as indicated by the increasing acidity. The test would be to look at the C-14 to C-12 ratio. The water from the oceans ought to have at least some C-14, while that from fossil fuels ought to be 100% depleted. So it all depends on whether the C-14 in the atmosphere is decreasing as rapidly as expected given the C13 to C12.
4 June 2007 at 4:04 PM
Ray, Re #215: it’s not clear it would imply the oceans got a big CO2 infusion. Wouldn’t a sudden change in the rate of upwelling cause a sudden change in the rate at which CO2-rich water was brought up, for its CO2 to escape? This would cause a change in total oceanic CO2, but not necessarily in surface waters — it would cause a decline in CO2 stored in the deep ocean, somewhere, which one might argue has been missed.
14C would be the way to rule out this hypothetical release, since even deep ocean carbon will not have had all the 14C decay away.
4 June 2007 at 4:21 PM
Re 200 & 201 Bob Gardiner: “Climate sceptics invariably do not question the rise in temperature just the cause being put down to the wrong light bulbs being used, etc.”
They also invariably ignore the well understood science of the greenhouse effect, dismiss the nearly 38% increase in atmospheric CO2 from burning fossil carbon fuels, and fixate on past natural climate variability as an explanation for the current unnatural warming trend.
4 June 2007 at 5:14 PM
RE Decline of C14 in atmospheric carbon dioxide
I am at work at the moment, but here is a little material which might be helpful…
The Discovery of Global Warming
Roger Revelle’s Discovery
Spencer Weart
http://www.aip.org/history/climate/Revelle.htm
CARBON-14 MEASUREMENTS IN ATMOSPHERIC CO2 FROM NORTHERN AND SOUTHERN HEMISPHERE SITES, 1962-1993
NDP-057 (1996)
http://cdiac.ornl.gov/epubs/ndp/ndp057/ndp057.htm
4 June 2007 at 5:18 PM
DocMartyn, let me try to explain the decay of carbon-14 in the atmosphere. First, you are looking at the carbon content of the entire atmosphere–not just the CO2. So, we do not know what form the carbon was in. Some of it could have been soot or methane. However, even if it was CO2, how quickly an individual atom of carbon resides in the atmosphere is not that relevant. CO2 is chemically very stable. Even when it reacts with water to form H2CO3, the H2CO3 decays into H20 and CO2 again. OK, so if a CO2 molecule containing a C-14 atom goes into the water and becomes a carbonic acid molecule, another carbonic acid molecule will react to give another CO2 molecule. But there is much less C-14 in the oceans, so the new CO2 molecule will most likely be a C-12 or maybe a C-13. And the concentrations of CO2 and H2CO3 stay the same, because the surface of the ocean is in equilibrium with the atmosphere. The only way to get rid of a carbon atom for any length of time is for it to travel to the deep ocean–and that doesn’t happen that often. So, while the individual carbon atom will spend time in the atmosphere and in near-surface waters, the CO2 concentration will stay high. Even biomass yields its carbon back on a relatively short timescale–at most a few hundred years for old-growth forest.
Now, as to your questions.
A. I believe the probability of an IR photon in the carbon band escaping decreses roughly logarithmically with increasing CO2 content–thus double the content an the photon is about 70% less likely to escape.
B. OK, in effect you are asking the mean-free path. This reference is relevant:
http://atol.ucsd.edu/sio209_rad/stephens-rtebook/AT622_section4.pdf
4 June 2007 at 6:59 PM
The paper to get which first fully modeled and accounted for all the C14 released during the nuclear tests would be:
Duffy, P.B., and K. Caldeira, A three-dimensional model calculation of ocean uptake of bomb 14C and implications for the global budget of bomb 14C, Global Biogeochemical Cycles 9, 373-375, 1995.
Unfortunately I do not have it yet.
However, the basic problem with DocMartyn’s approach is that while he is correct that the “half-life” for carbon dioxide entering the ocean is roughly ten years, as was concluded before, he is not taking into account the carbon dioxide which is being released from the ocean - and as the carbon dioxide entering the ocean since the test ban is undoubtedly much smaller than the sink-source that it is entering, we shouldn’t expect to see the C14 consitute a particularly large fraction of the carbon dioxide leaving the ocean. Nevertheless, it is significant enough that it can be measured, and this has been invaluable in understanding the carbon cycle. For example, we know that some boreal forests are now net emitters of carbon dioxide. Moreover, we will now be in a position to determine when the ocean becomes a net emitter.
With regard to the boreal forests, please see:
Two more links which may be of interest:
The Discovery of Global Warming
The Carbon Dioxide Greenhouse Effect
http://www.aip.org/history/climate/co2.htm
Letters
More Notes on Global Warming
May 2005, page 16
http://www.physicstoday.org/vol-58/iss-5/p16a.html
4 June 2007 at 7:06 PM
DocMartyn–
Look at this search: http://www.google.com/search?q=c14+decline+atmosphere
This is what people are reading online.
First hit, I recommend and will quote from below.
Second and third are from creation-science-prophecy.com. That’s Google search rank, it’s what people are reading.
You’re confusing the rate of cycling of CO2— balanced in the atmosphere and oceans for millenia — with the removal of a huge sudden increase in C14, which is diluting into oceans that had only a tiny natural background amount.
Consider the proportions. .
C14 increased perhaps 5x from surface fusion bomb testing in just a few years. Of course C14 disappears rapidly.
C12/13 have been in balance for millenia, and we’ve added a few percent more in excess in recent centuries — about half the excess from fossil fuel is accumulating in the atmosphere and the oceans, because natural sinks aren’t removing it.
See the difference?
This may help:
http://yarchive.net/chem/carbon_14.html
“From: rparson@spot.Colorado.EDU (Robert Parson)
Newsgroups: sci.chem
Subject: Re: Global Warming Higher Than Expected
Date: 16 Jul 1999 16:57:49 GMT
In article <7mdmqv$odk$1@node2.nodak.edu>, wrote:
Superdave the Wonderchemist
>
>Interesting… So what is the 14-C dilution factor? Fossil fuels contain
>almost no 14-C (since they’ve been underground for too many millions of
>years). Therefore, C-14 dilution should be a wonderful way to determine
>anthropomorphicly induced atmospheric CO2 increases.
Indeed it is - it even has a name, the “Suess Effect”, after the
geochemist who first detected it in the 1950’s. The original reference
is H. Suess, _Science_ _122_, 415 (1955); a more recent one is
M. Stuiver and P. D. Quay, “Atmospheric C-14 changes resulting from
fossil fuel CO2 release and cosmic ray flux variability”, _Earth and
Planetary Science Letters_, _53_, 349, 1981. Figure 2 of this paper has
exactly what you’re looking for, tree-ring derived atmospheric C-14
from 1820 to 1954. There is a clear secular decline in Delta-C-14
of about 25 per mil betweenm 1900 and 1950.
As others have remarked, the nuclear tests of the 1950’s, which doubled
atmospheric C-14 over a period of a decade, throw a monkey wrench into
this analysis. Since the cessation of the tests in ~1963 atmospheric
C-14 has been rapidly declining, with Delta-C-14 dropping from nearly
twice the pre-bomb level in 1965 to about 20 percent above the pre-
bomb level in 1990. (R. Nydal and J. S. Gislefoss, _Radiocarbon_ _38_,
389, 1996). This decline is due primarily to atmosphere-ocean exchange
the effect of fossil-fuel dilution is in the noise by comparison. (In
fact, the atmospheric C-14 decline is one of the primary methods for
measuring the rate of carbon exchange between air and seawater, a very
complicated problem involving nasty multiple ionic equilibria plus
the effects of wind speed and ocean temperature. If you want somebody
who _really_ understands ionic equilibria in aqueous solution, look for
a chemical oceanographer.)
4 June 2007 at 7:35 PM
RE #128 and my previous post #51
I too noticed that the general trend in IPCC report matched Beck’s and showed a ~1 degree variation even after elminating the last hundred years. My question was what accounted for this?
According to IPCC, it is volcanism and solar variation.
However, there is a question of how much variation really occurred. When we look at the graph, it is only the purple lines that show the ~1 degree variation. The other studies show much less variation.
Either I missed it or didn’t understand, but I can’t tell from IPCC report what accounts for the variation in the studies. I can see that they used different proxies but are some better than others? Are we to average out the studies? Is this just a judgment call and nobody really knows?
Also, what would happen if we extended the global temperature graph for the entire Holocene? Is this possible? I thought I read that 8,000 years ago was warmer than today?
4 June 2007 at 8:57 PM
Absorption of light along a path is governed by Beer’s law
ln (I/Io) = - sigma N L where Io is the incident intensity, I the intensity at the end, sigma the absorption cross-section (a function of wavelength), N the number density and L the path length
(see any elementry physics or chemistry text) however that does not account for emission, for that see Kirchhoff’s law.
“The very simple questions I asked have not been answered. I ask again;
What is the relationship between absorbance of a photon by CO2 and :-
A) A doubling of the CO2 concentration. So that at 380 [CO2] ppm; 50% of photons are absorbed, it follows that at 760 [CO2] ppm then X% of photons will be absorbed.”
Meaningless as stated because you do not specify the length of the path or the wavelength. At atmospheric pressure and 380 ppm on a strong line this is a few meters.
“B) The attenuation of absorbance through the atmosphere at 380 [CO2] ppm, so that overall there is an absolute absorbance of 50% of the photos at a particular weavelength. What is the relationship between distance from the earths surface and the absorbance?”
The absorption is much stronger that this, but there is also emission on the same lines from CO2 in the atmosphere.
“I am neither stupid, nor poorly read. I wish someone on this site to state an answer to these very simple questions.”
You need to learn about spectroscopy and radiative processes. You also need to tone it down. It is hopeless to try bullying people who know about things you are ignorant about.
4 June 2007 at 8:58 PM
#216, Paul, a change in ocean upwelling of that magnitude would have other observable effects–most notably a drop in temperature of the surface waters–again, the opposite of what we are seeing. Keep in mind that the change would have to be sustained and to follow an exponential trend–both quite unlikely.
4 June 2007 at 9:59 PM
Note that C14 measures vary from site to site; here’s a summary for the Pacific Ocean:
http://geoweb.princeton.edu/people/resstaff/key/woce/C14.Changes/key.html
4 June 2007 at 10:09 PM
Also very relevant and interesting: http://www.crafoordprize.se/download/18.51ddd3b10fa0c64b24800021404/Craf_adv06.pdf.
18 January 2007
Advanced information on the Crafoord Prize in Geosciences 2006
Earth�s operation as a chemical, physical, and biological system
Recommended reading. The article concludes:
“… Broecker has been a strong and active teacher of his subject and an
educator, producing accessible and engaging books and articles that can capture the
attention of the general public and students, while avoiding the trap of �dumbing
down� the subject to make it palatable to non-specialists. Annoyed by the high prices
charged by publishers of both journals and books he has, since 1982, been publishing
his own works at cost price, via the “eldigio” press, to make them available to the
widest possible readership. Several of his books and articles have served to present
the basic science with great clarity to a non-specialized audience (Broecker 1974;
Broecker 1985; Broecker 1992a, b), while another (Broecker and Peng 1982) has been
the classic chemical oceanography textbook for almost 25 years.”
Perhaps worth adding to “Start Here” as well?
4 June 2007 at 10:11 PM
Being in that class, I found Timothy’s words on skeptics (199) to be quite good. I would like to tweak it a bit, though. The “disbelief” of the listed points might not be so absolute. E.g., I don’t disbelieve the radiative absorption/re-emission properties of GHGs, like CO2; but I question (am skeptical of) the precise mathematics and observations that make up the forcing and temperature quantifications from it. There is likely more granulation in the degree of skepticism. I guess I would call myself “not convinced” as opposed to “skeptical”, but that’s getting too refined for practicality — just plain skeptical is easier.
The referenced Pyrrho story is meaningful, but cuts both ways. It made no mention of the cost of Pyrrho pulling his instructors head out of the mud (though implied it was virtually zero cost.) One post a while back was chastising skeptics for just looking out for our economics interests. Well, DUH! Now I’m not a skeptic because of that, but it is a major reason why I press the skepticism hard. Despite the sanguine economic prognostications offered (often by physicists… [;-) by many, it’s not clear in the least that reducing our carbon emissions by magnitudes in a couple of decades won’t wrack economic havoc. To the extent possible the science and arguments of AGW needs to be exercised and tested excruciatingly. (A democratic vast majority doesn’t come even close!) But I also have to admit the other side, which causes me angst from time to time. Like while Pyrrho thought about it, his teacher (presumably) died, there is the prospect that the AGW boys (and girls) might prove to be right, but after finally satisfying us well-intentioned skeptics it’s now too late to recover and we all die (or somethin’). Just can’t win for losing.
5 June 2007 at 4:51 AM
Rod B. One way I would distinguish between a skeptic and a denialist clothed in the robes of a skeptic is that a skeptic could be convinced if they saw some critical missing piece of information. A denialist would rationalize any new information and remain “skeptical”. They often would not even make an effort to understand the new information. So I ask, Rod, what would it take to convince you?
5 June 2007 at 6:42 AM
Rod, are you familiar with the term ’sunk costs’? It’s part of the evidence against the faith that markets are rational.
It refers to the problematic behavior of sticking with a bad investment, ‘riding it down’ — once people have ‘invested’ (sunk) so much wealth (cost) in their choice, they have trouble letting go of it even when it’s known bad.
It’s typical human behavior — it takes a rare and disciplined understanding of economics to avoid it.
People generally have enormous trouble recognizing that something they invested a lot of money in can be worth a lot less than they thought it would be — the costs are sunk, lost, gone.
The ‘monkey puzzle trap’ is supposedly a large nut in a small-mouthed heavy jar, so the monkey can see it, reaches in, grabs it, then can’t get its closed fist out of the narrow opening and is trapped by holding on, unable to let go even as the hunter approaches. That may be apocryphal — we know people have this problem, but I don’t know that any other animal does.
The costs we didn’t know about — externalized, not accounted for — from fossil fuel use are like that. But the time span is longer than a human lifetime so the pain comes mostly for the next generation after we’ve taken the pleasure.
It’s real —the losses are _known_ continuing for several hundred years more just from the committed change already in the climate system. One costs are sunk and recognized as lost, there’s nothing smart to do but believe the loss and walk away. That’s our problem here.
5 June 2007 at 6:52 AM
It appears that we have some agreement, the rate of atmospheric [CO2] efflux (to all sinks) is approximately 0.076 year-1; so that 50% of the CO2 enters the Earths sinks at 9 years and 90% is gone at 30 years. Of course the system is a pseudo-steady state and so influx into the system occurs at the same rate.
We also know that the steady state atmospheric CO2 concentration was about 280 ppm before humans began to inject large quantities of CO2 into the atmosphere, so that the natural background influx (from all) was about 21 GT year-1, current emissions are a third of this value.
Now all we need to know is if these sinks can be saturated. There are two ways to do this; a plot of anthropogenic CO2 vs. atmospheric CO2 would be non-linear if we were saturating the various CO2 sinks; however the line is linear indicating that the Earths various sinks are not saturated.
The second way is from the disappearance of C14 from the atmosphere. The disappearance of 14C from H-bomb testing shows that the flux into the atmosphere of 14CO2, captured from the Earth carbon sinks, is as small as to be trivial; therefore the CO2 buffing capacity of the Earths CO2 sinks is more than two orders of magnitude greater than the rate at which CO2 is removed from the atmosphere. The Earths sinks are nowhere near saturation, indeed the system can be described as a simple steady state system where the natural rate of atmospheric CO2 influx into the atmosphere is 2 GT per year and the efflux into the earths sinks is 0.076 year-1, supporting a natural atmospheric [CO2] of 280 ppm. Such a model also indicates that to reach 2xCO2 (560 ppm) will occur when human CO2 emissions reaches approximately 20 GT per year.
————————————————————————
It also appears that the majority of members of this debate now accept that CO2 atmospheric absorbance follows the Beer-Lambert Law, which is encouraging.
———————————————————————–
“You need to learn about spectroscopy and radiative processes. You also need to tone it down. It is hopeless to try bullying people who know about things you are ignorant about.
Comment by Eli Rabett â�� ”
I have been doing spectroscopy for more than 20 years. I do not bully, I just hate when people do not answer simple questions. I also hate complicated maths, when simple maths will do.
5 June 2007 at 6:57 AM
[[“It is strange what weather we have had all this winter; no cold at all, but the ways are dusty and the flies fly up and down, and the rosebushes are full of leaves; such a time of the year as never was known in this world before here.
Samuel Pepys’ diary, England, January 1661. A hundred years later in winter the Thames froze. ]]
Yes, and that shows why it’s not good to generalize from too small a sample. One warm winter doesn’t prove much. On the other hand, for the present global warming, we have 120+ years of time series data and proxies going back, in some cases, 650,000 years. That’s a fair sample.
5 June 2007 at 7:03 AM
[[What is the relationship between absorbance of a photon by CO2 and :-
A) A doubling of the CO2 concentration. So that at 380 [CO2] ppm; 50% of photons are absorbed, it follows that at 760 [CO2] ppm then X% of photons will be absorbed.]]
One CO2 molecule is only likely to absorb one photon at a time. When there are more CO2 molecules in the air, more photons are likely to get absorbed.
Most of the radiation from the ground is absorbed fairly close to the ground (i.e., in the first few kilometers). But absorption of the ground IR isn’t the only factor involved. Absorption between layers of air is important as well, and it’s easy to show that even if all the IR from the ground was absorbed by the lowest level of air, more CO2 in the air would still heat the ground further. Let me know if you want the explanation as to why.
5 June 2007 at 8:20 AM
Alright, time for me to show my ignorance.
All this talk about CO2 and photons and other such things — isn’t it more likely that these photons, after being absorbed and emitted and reabsorbed and reemitted will simply escape into space, even if only because of the curvature of the atmosphere and the simple fact that there’s less air up there to absorb all those photons? Dittos for the longwave radiation given off by condensation of water vapor, even moreso because the moisture content of air increases exponentially with temperature.
This probably should have been asked when we were talking about simple models, but this is the hot thread today
5 June 2007 at 8:27 AM
DocMartyn, I’m sorry, but that is just flat wrong. How on Earth do you get that atmospheric CO2 is rising linearly? Look at this graph:
http://www.globalwarmingart.com/images/5/52/Carbon_History_and_Flux_Rev.png
Now go ahead and just try to fit a straight line to that–that’s an exponential rise. Here’s a caveat: Never judge the form of a curve based on too short a data set. Remember the taylor series for the exponential: e^x=1+x+x^2/2!+… For very small x, the linear terms dominate–but that doesn’t mean the trend is linear.
Second, your reasoning on the C-14 is just flat wrong. First, the influx of C-14 from the bomb tests can be viewed as an impulse source, that rapidly doubles the C-14 in the atmosphere. Now what will happen? Let’s look at one sink to simplify–the oceans. There’s 2x the C-14 in the atmosphere as is the equilibrium level with the oceans, so the net flux of C-14 will be toward the oceans–UNTIL YOU NEAR EQUILIBRIUM. Then the flux will stabilize. That does not mean that you aren’t still getting an atom of carbon into the atmosphere (or rather, 90 atoms of carbon for 92 into the oceans). It just means that only about one in a trillion will be C-14. So:
1)CO2 in the atmosphere is increasing exponentially; and
2)The sinks are saturating, and will be moreso as temperatures rise.
5 June 2007 at 8:34 AM
I do not bully, I just hate
You can get help for that. There are public services available.
5 June 2007 at 8:46 AM
FurryCatHerder,
Reradiation is not the only possible outcome, the IR radiation excites a vibrational state of CO2, and this can couple electromagnetically or mechanically to the mechanical motion of adjacent atoms. Also, keep in mind that the re-emission can be in any direction over 4-pi steradians–so on average half the radiation gets sent back toward the ground, where it can again be absorbed. (Remember the atmosphere is only about 100 km thick, so even at the top of the angle, Earth subtends nearly a 2-pi Sr angle.) In essence, the atmospheric CO2 becomes a new source of radiation incident on Earth.
5 June 2007 at 9:13 AM
Re DocMartyn #230 (sequestration of carbon)
Given your approach, I would like to know how exactly you interpret the chart on pg 3 of the following:
Tracing the Role of Carbon Dioxide in Global Warming
Science & Technology Review March 1998
http://www.llnl.gov/str/pdfs/03_98.2.pdf
What I see is the level of C14 being relatively constant prior to the bomb tests, a large pulse entering the system, and the C14 approaching a new level which approximates an asymptotic path. Just eye-balling it, I suspect that just about anyone will see something odd: the level which it appears to be approaching asymptotically is substantially higher than the relatively constant level it was at prior to the bomb tests.
5 June 2007 at 10:23 AM
Dear Timothy Chase, that is exactly what one would expect. The rate at which 14C is produced is typically dependent on the amount of N2 in the atmosphere and the amount of cosmic ray radiation. Though the latter varies, it means that the level of 14C in the Earths various CO2 sinks would have been in a steady state before mankind started burning fossil fuel and exploding thermonuclear devices in the atmosphere.
H-Bomb testing produced an atmospheric spike of 14CO2, puterbing the steady state distribution beween the various sinks. This purtubation quickly (3 decades) reverted to steady state again. Exactly what one would predict of there was rapid exchange between the various sinks.
Dear Ray Ladbury
“Also, keep in mind that the re-emission can be in any direction over 4-pi steradians–so on average half the radiation gets sent back toward the ground, where it can again be absorbed. (Remember the atmosphere is only about 100 km thick, so even at the top of the angle, Earth subtends nearly a 2-pi Sr angle.) In essence, the atmospheric CO2 becomes a new source of radiation incident on Earth.”
True, however the concentration of CO2 in the atmosphere is inhomogenous, there is much more at the surface and little at the top, where the photons are ultimately lost to space. What we have is a case of non-equlibrium theromdynamics. Space is a sink for photons and the surface is not. Photons that migrate downward encounter more CO2 molecules and those that go upward less. If you do a random walk deffusion type analysis you will note that the overall transfer is from the surface and into space; the sink will always win.
The question is what effect will the CO2 have on heat trapping? Will an increase in CO2 from 280 ppm to 560 ppm have a large effect on the surface temperature. The answer has got to be no, given that the effect will be about a change in the trapping efficency of about 12%.
5 June 2007 at 11:09 AM
Gavin, in the link in 237, there’s a model prediction re C14; can you comment on that one? It’s testable, interesting.
5 June 2007 at 11:24 AM
Hank Roberts (#239) wrote:
You mean the part where the carbon dioxide which we are putting into the atmosphere begins to flush the radiocarbon out of the ocean so that there is a net influx of the radiocarbon into the atmosphere from the detonations prior to the test ban? I was wondering when someone would notice.
5 June 2007 at 11:42 AM
DocMartyn (#238) wrote:
Doc, you appear to be seeing only that half of the chart (see #237) which you want to see. What I was specifically pointing to was that the equilibrium level of radiocarbon from before the tests will not be reached again except in geologic time. There is only so much of the pulse that the ocean will absorb.
And as a matter of fact, there will soon come a point at which there will be a net efflux of radiocarbon from the ocean into the atmosphere - our emissions will be flushing it out. Then at some point, perhaps only a handful of decades from now, there will be a net efflux of carbon dioxide from the ocean as the rise in global temperature causes the ocean to become an emitter.
Sure - early on the actual curve approximates the hypothetical exponential decay of the pulse from the atmosphere which you envisioned. But it is also true that over a suitably short extension of a curve, line will approximate that. But for this to follow the kind of exponential decay (even in approximation) that you envisioned, the latter part of the curve would have to be settling down close to the original level.
It isn’t.
5 June 2007 at 12:28 PM
re Ray Comment 234
“DocMartyn, I’m sorry, but that is just flat wrong. How on Earth do you get that atmospheric CO2 is rising linearly? Look at this graph:
http://www.globalwarmingart.com/images/5/52/Carbon_History_and_Flux_Rev.png
Now go ahead and just try to fit a straight line to that–that’s an exponential rise”
If you look at the graph I presented would would have noticed that I plotted Human release of CO2 in GT on the x-axis and atmospheric [CO2] ppm, at yearly peak and trough, on the y-axis.
Now the intercept of this plot should give the historic atmospheric [CO2], even though the data set doesn’t include it. The plot at x=0 is about 280 ppm, so, so-far so-good.
The gradient of the slope gives 1/CO2 atmospheric efflux rate year-1. Which is 0.076 or a half-life of 9.2 years. This value is very close to the rate at which H-bomb generated 14CO2 disappeared from the atmosphere following the Test ban treaty, so again, so-far so-good.
From the intercept at x=0 and the efflux rate we can calculate that the “natural” CO2 influx rate into the atmosphere, independent of human activity, is about 21 GT per year.
———————————————————————–
The difference between atmospheric [CO2] ppm in the spring and autumn is also quite interesting. Does anyone have the average sea surface temperatures, per area, for the whole planet in April and October?
From this data I could estimate the effect of global sea temperature changes on the level of atmospheric [CO2].
5 June 2007 at 12:54 PM
RE: 230 It is implied that one obtains 21 GT CO2 year-1 for the natural background influx based upon a steady state CO2 conc of 280 ppm and an efflux rate to all sinks of 0.076 year-1. I don’t understand how one can get any influx rate unless you have the total mass of the atmosphere.
5 June 2007 at 1:06 PM
DocMartyn #242 wrote:
I am sure you could - by neglecting anything beyond the local effects of the change in temperature. You need to look at the long-term behavior - not just the local tangent - or even an exponential curve which fits the first couple terms of local behavior. By looking at the seasonals, you are factoring out all of the long-term effects.
It takes a little bit of time for the relevant layer of the ocean to warm up. (This would be roughly the first meter - if one is thinking in terms of a few decades.) It has thermal inertia. Largely a function of its mass, I believe. Long-term effects require the ocean to warm up, not just the atmosphere.
5 June 2007 at 1:23 PM
Correction to my most recent post in response to DocMartyn’s #242 -
What I was recalling was the diffusion of CO2 into the ocean. But what is most significant to DocMartyn’s “seasonal analysis” of the effects of temperature upon atmospheric CO2 will be the rate of heat diffusion through the layers of the ocean. Global warming is detectable as far down as 1500 meters. But either is sufficient to invalidate his “seasonal analysis” - demonstrating that such a short-term analysis neglects the long-term effects.
5 June 2007 at 1:40 PM
DocMartyn,
You can use NOAA’s atlases (2005- readily available on line, just type in NOAA Atlas 2005 into Google) for all the sea surface temperature measuremnts you need, annual averages, seasonal averages, etc. Also they provide the same info for various water depths from the surface to 5500 meters. This is free access to all.
5 June 2007 at 1:55 PM
> the concentration of CO2 in the atmosphere is inhomogenous,
> there is much more at the surface and little at the top …
What do you mean by “concentration” there?
You’re not referring to Dr. Wegman’s answer to Rep. Schakowski, are you?
“Prof. WEGMAN: Carbon dioxide is heavier than air…. if the carbon dioxide is close to the surface of the earth, it’s not reflecting a lot of infrared back.”
5 June 2007 at 1:56 PM
RE: 243 Comment by Don Fontaine “I don’t understand how one can get any influx rate unless you have the total mass of the atmosphere.”
We know how much CO2 we added every year. We know the relation ship between the amount we add and the amount of [CO]2 in the atmosphere. If we extend the line so that y=0, the intercept point is equal to -Natural CO2 influx. Remember at steady state, influx equal efflux. So we can calculate the eflux at any point along the curve.
5 June 2007 at 2:19 PM
DocMartyn #242 wrote:
A few more questions regarding your proposed calculations…
Just out of curiousity, have you considered the seasonal nature of our CO2 emissions? Have you considered how the wind patterns change throughout different times of the year? Have you considered how unevenly distributed the CO2 emissions are? Would you be measuring the CO2 levels at Mona Loa? It takes time for such emissions to reach Mona Loa. Years, roughly on the order of a decade from some parts of the world, and it is through a process of diffusion. This would blur the seasonal effects of temperature upon CO2 levels if this were where you were performing your measurements.
And if not there, then where? And what about these other factors?
5 June 2007 at 2:42 PM
> Does anyone have the average sea surface temperatures, per area,
> for the whole planet in April and October? From this data I could
> estimate the effect of global sea temperature changes on the level
> of atmospheric [CO2].
There’s a gap in your logic there.
Look up the actual measurements of CO2 in the ocean. This is a big research area, lots published, and a real area of concern as ocean pH is changing fast.
http://www.princeton.edu/~mhiscock/OCCC.pdf
Eos, Vol. 86, No. 42, 18 October 2005
— excerpt—-
Ocean biogeochemistry is a critical component
of the Earth�s climate system, regulating
on timescales of decades to millennia the
atmospheric levels of carbon dioxide (CO2),
and other radiatively active gases. Since the
pre-industrial era, the ocean has taken up
about half of the carbon released by fossil
fuel combustion, partially mitigating climate
change.The future behavior of this oceanic
sink, however, is not well understood and remains
one of the major climate uncertainties
[Sarmiento and Gruber, 2002].
The ocean carbon inventory depends, in
part, upon the complex responses of the
natural ocean ecosystems and carbon system
to changes in ocean circulation, dust
deposition, ocean pH, ultraviolet radiation,
and other factors [Fasham, 2003].Addressing
this problem requires an integrated research
effort on a variety of fronts, ranging from
monitoring the temporal evolution of the
ocean inorganic carbon inventory to innovative
studies of poorly known biological and
chemical dynamics.
As part of the new Ocean Carbon and Climate
Change (OCCC) program [Doney et al.,
2004], (sponsored by the multi-agency U.S.
Global Change Research Program�s Carbon
Cycle Science Program), a science workshop
called The Ocean Carbon System: Recent
Advances and Future Opportunities was held
recently at the Woods Hole Oceanographic
Institution ….
More than 100 scientists participated ….
Electronic versions of many of the plenary
talks are available
[the published link is outdated; this will get you to the material –hr]
http://www.whoi.edu/search.do?q=OCCC+workshop&btnG=Search&ie=&site=WHOI_External&output=xml_no_dtd&client=WHOI_External&lr=&proxystylesheet=WHOI_External&oe=
… findings on biogeochemical cycling across
the air-sea interface, … the quantification of the oceanic
uptake of anthropogenic CO2 and the resulting
geochemical and ecological impacts due to
ocean acidification; and the application of new
technologies and methods to ocean biogeochemistry.
— end excerpt—–
Or you can look at the Mauna Loa information:
At Mauna Loa, in the annual variation, it’s explained — you’re looking at CO2 from photosynthesis in North America, primarily, lagged by the time it takes to arrive. This isn’t new.
See here: http://www.atmos.ucla.edu/~ben/PUBLICATIONS/Buermannetal2006.pdf
The changing carbon cycle at Mauna Loa Observatory
— excerpt—-
The amplitude of the CO2 seasonal cycle at the Mauna Loa Observatory
(MLO) increased from the early 1970s to the early 1990s but
decreased thereafter despite continued warming over northern
continents. Because of its location relative to the large-scale
atmospheric circulation, the MLO receives mainly Eurasian air
masses in the northern hemisphere (NH) winter but relatively more
North American air masses in NH summer. ….
…
The seasonal cycle of
atmospheric CO2 at the MLO, with a maximum at the beginning
of the growing season (May) and a minimum at the end of the
growing season (September/October), records the ��breathing��
of the northern hemisphere (NH) biosphere, that is, the seasonal
asynchrony between photosynthetic drawdown and respiratory
release of CO2 by terrestrial ecosystems (e.g., refs. 1â��3)….
…
Our analysis of the increasing trend in the
MLO amplitude from the early 1970s to the early 1990s extends
the analysis of Keeling et al. (1) by attributing the photosynthetic
drawdown to North America and enhanced cold-season respiration
to Eurasia. The time series of the MLO amplitude beyond
the early 1990s shows behavior and controls very different
from the earlier two decades. Our analysis suggests that throughout
the last two decades, the MLO CO2 seasonal amplitude has
recorded a changing North American carbon sink that is dominated
by shifts in the North American hydrologic regime rather
than by temperature trends. The decline in the MLO amplitude
since the early 1990s captures the effects of North American
droughts, especially those of 1998�2003, on growing-season
carbon uptake on the continent. The amplitude decline is also
attributed to reduced cold-season CO2 transport from Eurasia in
the early 1990s arising from changes in large-scale atmospheric
circulation, especially in the NH spring.
—- end excerpt—–
Direct measurement of CO2 in the ocean water is done routinely.
This is simple physical chemistry, not complicated mathematical modeling of radiation physics. Ocean pH is decreasing — that’s a problem independent of global warming and more urgent.
This may help:
http://www.terrapub.co.jp/e-library/kawahata/pdf/045.pdf
— excerpt ——
“A primary motivation for studying deep circulation is that the deep ocean is a major component of the global carbon cycle. The world ocean has approximately 38,000 Pg-C (1015 grams C), which dwarfs the atmospheric and terrestrial biospheric reservoirs that respectively have about 730 and 2200 Pg-C (Houghton et al., 2001). Since most of the oceanic carbon resides in the deep ocean, even a small change in its carbon budget can significantly impact the atmospheric budget and hence the global climate. Under natural conditions, the chances of such an event may seem remote, because the deep ocean is a slow component compared to the atmosphere, upper ocean, and terrestrial biosphere.
However, measurements from polar ice cores provide abundant evidence for
multiple, abrupt climate changes in the last glacial cycle (Dansgaard et al., 1993), some of which may have involved changes in the deep ocean (Broecker, 1998, 2003). Abrupt climate change may be a real possibility today, when human activities that modify the physical environment are increasing globally (Alley et al., 2003; Broecker, 1997).
Another important reason for accurately characterizing the deep ocean is the need to validate ocean carbon cycle models. These models are used frequently to predict the response of the ocean to increasing atmospheric CO2. Projections of future carbon uptake by the ocean (Houghton et al., 2001) inevitably involve the deep ocean. We would be hard pressed to place confidence in projections from any model that does not reproduce the modern deep ocean behavior reasonably well. In this work, we use the new measurements from the World Ocean Circulation Experiment (WOCE) conducted during the decade of 1990s to present for the first time objectively gridded global maps of deep natural 14C.
… The long time scale associated with the deep ocean circulation are readily appreciated when 14C abundance is converted to 14C age (Fig. 2). The difference of about 1000 years between the Atlantic and Pacific is the basis for characterizing the global overturning circulation as having millennial time scale.
—- end excerpt—-
5 June 2007 at 2:49 PM
I just wanted to thank you for an excellent site. I am somewhat skeptical to the ‘climate-change story’. However, being a scientist in an unrelated field, I am painfully aware of how little I know about the science behind ‘the story’.
This site helps a lot by presenting the science both in sufficient detail and in an accessible way. The fact that you also seriously address counter-arguments on the net is a very important feature of your work.
If anyone are to rid me of ‘climate skepticism’ it will be realclimate.org :-).
5 June 2007 at 4:04 PM
DocMartyn, could you please understand that the atmosphere is not in steady state? The increase of 1 to 2 ppm per year disproves the steady state assumption.
The natural carbon influx is NOT 21 GtC. In fact, the net effect of nature is actually a carbon sink, not an influx, on the order of 3 GtC.
The “lifetime” of CO2 is NOT 9 years. While it is often approximated as 100 years, I believe that William pointed you at a Realclimate discussion on the limitations of assigning CO2 a lifetime at all.
The reason that C14 disappears quickly from the atmosphere is that there are large balanced fluxes into and out of the ocean and into and out of the ecosystem (look up net ecosystem production, net primary production, net gross production - NEP, NPP, NGP to see different orders of magnitude for these)
And finally, the difference between spring and autumn is going to be much more an effect of vegetation growth and decay than any sea surface temperature effect.
I suggest you read http://ipcc-wg1.ucar.edu/wg1/Report/AR4WG1_Pub_Ch07.pdf the IPCC chapter on geochemistry and the carbon cycle in particular.
5 June 2007 at 5:09 PM
DocMartyn (#242) wrote:
The biggest problem with this is the seasonal variation itself. Plant exhalation is during the winter and peaks in April, just as the weather is beginning to warm up. The inhalation maxes around October. This is entirely out of phase with the effect you wish to measure. However, even if it were in phase, it would swamp the effect you wish to measure. Eliminate it, and you still have the seasonal effects of human emissions - which you would still have to factor out.
5 June 2007 at 5:22 PM
This shows the seasonal variations at Mauna Loa…
NOAA In Situ Carbon Dioxide (CO2) Measurements
http://www.mlo.noaa.gov/programs/esrl/co2/co2.html
Atmospheric CO2 reaches a maximum in April, minimum in October - and the cause in plant respiration - where plants take on CO2 during the warm months and release CO2 during the cold months.
5 June 2007 at 5:31 PM
Dear Marcus Re #252,
“DocMartyn, could you please understand that the atmosphere is not in steady state? The increase of 1 to 2 ppm per year disproves the steady state assumption.”
It does not by any means, please not that the seasonal variation in CO2 in greater than 4 ppm. It is therefore quite reasonable to treat the system as a steady state.
“The natural carbon influx is NOT 21 GtC. In fact, the net effect of nature is actually a carbon sink, not an influx, on the order of 3 GtC.”
This argument means you have no understanding of kinetics. Imagine the atmosphere from 100 BC to 1900; according to the ice record the steady state concentration of CO2 in the atmosphere was approx. 280 ppm for 200 years. During all that time the amount of CO2 entering the atmosphere was the same as that exiting the atmosphere.
Are you by any chance confusing the term “natural”, which means without human interference and “Biotic” which means a process caused by the presence or activity of living things?
“The “lifetime” of CO2 is NOT 9 years. While it is often approximated as 100 years, I believe that William pointed you at a Realclimate discussion on the limitations of assigning CO2 a lifetime at all.”
So you and Willam are correct and the actual data is wrong? The summing of rate constants, based on guesstimates, is not a way to work this out.
Half-life is a real kinetic term, and does not only apply to first order rate kinetics, it is what it says, the average time it takes for 50% of something to disappear. We can talk about the half-life of CO2 or 14CO2 in the atmosphere and we can also measure it. I have shown two calculation which demonstrate that the half-life of 14CO2 and CO2 is between 9 and 12 years. I am prepared to read and debate other other data sets or other interpretations of the datasets already presented. However, I will not accept the argument that I am wrong becuase I am wrong and someone else is right.
“The reason that C14 disappears quickly from the atmosphere is that there are large balanced fluxes into and out of the ocean and into and out of the ecosystem (look up net ecosystem production, net primary production, net gross production - NEP, NPP, NGP to see different orders of magnitude for these)”
Why are fluxes “balanced”? Do CO2 molecules get issued with a map and a set of instructions everyday telling them where to go?
Actually, your first line is essentially correct for a system at steady state, the influx and efflux from the atmosphere is equal. The efflux is the sum of all processes that result in CO2 disappearing from the atmosphere and the influx is the sum of all the input sources with respect to time. This is why we know that influx of 12CO2 and efflux of 14CO2 resulted in half the atmosphere being turnedover in a decade or so.
“And finally, the difference between spring and autumn is going to be much more an effect of vegetation growth and decay than any sea surface temperature effect.”
This is what is known in the trade as a postulate, it hasn’t even got as far as being a theory. This is a possible reason, but has not yet been established that it is the correct one. I suspect that the change may be due to the difference in the surface temperature of the Earths ocean/water surface at different times of the year and its productivity. So I would like to know, if possible, the monthly changes in water surface temperature and chlorophyll, world wide averged for the actual water surface.
“I suggest you read http://ipcc-wg1.ucar.edu/wg1/Report/AR4WG1_Pub_Ch07.pdf the IPCC chapter on geochemistry and the carbon cycle in particular.”
I think you will find that many people walked away from this simplistic box method of kinetic analysis in the late 70’s and then moved on to both steady state and flux control analysis. The reason for this was that adding up individual rate constants and assigning amplitudes to bits and pieces doesn’t actually work. Complicated systems are actually both simpler and and more complex than they seem.
5 June 2007 at 5:36 PM
Re 238: Perhaps I’m missing something here, but I find that the argument that CO2 is more abundant close to the surface and therefore its effectiveness as GHG is reduced does not make sense. First, is CO2 not considered as a well mixed gas for all practical purposes? Second, if the surface is the emitter of IR radiation, the most effective reflective layer will be close to the source. Higher, the reduced density and increased relative surface area would make it a loss less effective. I other words, if you want to keep heat with a blanket, you don’t suspend it a meter high from the body but instead you wrap it around. So I don’t see how having the CO2 more concentrated near the surface (if it actually is) makes it less effective as a GHG.
5 June 2007 at 6:59 PM
O.K. let me put it another way. Your bedroom is cold and so you put on a thermally insulated blanket, still cold so you add another blanket. At what stage to you need to get to before adding additional blankets will not have a great effect? Each blanket added to your bed only changes the heat transfer rate by a fraction or the heat loss.
So at the moment with 380 ppm CO2 no IR from the major CO2 absorbtion peals from the surface is tranfered above 10 meters. The only heat being trapped is from IR emissions from the atmosphere. If IR from the surface can’t move more than 10 meters up, why should IR generated at 11 meters be able to move down?
5 June 2007 at 7:11 PM
Philippe Chantreau (#256) wrote:
CO2 (and ozone) are responsible for the greenhouse effect as it takes place in the stratosphere - which is especially dry. Water vapor is responsible for the greenhouse effect as it takes place in the troposphere - near the surface.
Please see:
5 June 2007 at 7:43 PM
re: #251 Arne B
Maybe you can help out, given that the good folks who run this site like to provide info for people who will actually consider data. I’m very interested in why people think what they think about this, so perhaps you’d consider quick comments on the following:
1) How much time have you spent looking at AGW? and for how long? Have you been watching long enough to see which positions change (or don’t) as new data arrives?
2) If you’re skeptical (in the classic sense, not in the hardcore denialist sense), where are you on a 1-99% scale, i.e., if following the IPPC, virtually certain = 99% on the proposition:
“GW is happening, and the rise since 1950 is mostly caused by humans?”
I ask because when someone calls themselves a skeptic, it means different things:
80%: I think it’s real, but I still have a few reservations.
50%: more like “Not proven, but could very well be true”
and
1%: “I really don’t believe it, and it would take a lot of evidence”
3) Scientists tend to believe believe by default that strong scientific consensus in another domain is probably a good approximation, even while reserving judgement. So,if not:
a) Is this from “Haven’t had a chance to study in depth yet, and I never believe anything until I know more”?
b) Is it from irritation at some of the well-known “alarmist” exaggerations, especially from before the evidence had accumulated? Put another way, classic skeptics often see irrational/rational fights. Exposure to alarmism often pushes normal skeptics, not into the usual rational-skeptic (scientist) group, but into a 3rd group (denialists), where they stick via anchoring effects, plus the work that it takes to sort through the organized disinformation. 3-way fights are confusing to people used to 2-way ones, comparedto peopl who are not so normally skeptical, and just willing to take mainline science’s word.
4) Do you have a specific list of reservations/reasons to doubt and could you share those? and maybe which ones used to be reservations, and got crossed off? [For example, my list once had the disagreement between ground stations and satellites, but that got crossed off.]
5) Are there particular sources from which you derive these? Which ones do you like?
5 June 2007 at 7:43 PM
DocMartyn (#257) wrote:
Because… it gets re-emitted? Because… the atmosphere gets warmer and has its own thermal radiation?
The thermal radiation isn’t trapped at 10 meters or 20 meters or 1000 meters or whatever forever. The system ultimately rises in temperature to the point that the thermal radiation going out equals the thermal radiation going in, but with greenhouse gases absorbing the infrared and re-emitting it in both directions, the temperature has to go up for this to occur. This is the principle behind the greenhouse effect. It is the reason why the average temperature of the earth isn’t 0 degrees Fahrenheit.
It helps to understand a theory before you try and attack it.
PS
Thank you for providing me with a foil. I now consider the lesson complete.
5 June 2007 at 8:05 PM
Re: 257 DocMartyn said, “The only heat being trapped is from IR emissions from the atmosphere. If IR from the surface can’t move more than 10 meters up, why should IR generated at 11 meters be able to move down? ”
Now you are just being silly. You do realize that Zeno’s paradox was solved, right? Some IR does get back to the ground precisely for the same reason that some of it escapes to space–the photons are emitted isotropically each re-emission. You can do a Monte Carlo calculation and figure what fraction escapes and what fraction winds up reabsorbed by Earth.
In answer to your blanket analogy, Earth’s thermal insulation could certainly be more efficient, given that our neighbor toward the Sun finds itself at about 750 Kelvins, while we are at a pleasant 300 Kelvins. The greenhouse effect is good for about 30 degrees for Earth, while most of Venus’s temperature is due to its greenhouse effect (it only gets about 2 times as much solar radiation as Earth). We really do understand the greenhouse effect. Really.
5 June 2007 at 11:32 PM
DocMartyn: The fact that the seasonal variation in CO2 is larger than than the year-to-year change does not mean that a steady state approximation is reasonable. Note that the decadal increase is almost 20 ppm - that’s much larger than the 4 to 6 ppm yearly variation - does that help you understand what a non-steady-state system looks like?
Effectively, there are two reasons that the system is not in steady state:
1) Humans are dumping 7+ gigatons of carbon into the atmosphere/ocean/biosphere system. Given that the long term sinks (carbonate weathering and deposition of carbonates in the deep ocean) are less than half a gigaton, this alone would keep us out of any steady state.
2) The ocean has not had sufficient time to equilibrate with the new atmospheric concentration. If we were to magically hold CO2 concentrations in the atmosphere constant at 380 ppm, the ocean would keep absorbing carbon for centuries (the circulation of deep ocean currents is on the order of 1000 years, and there really aren’t any fast mixing processes between the upper ocean layers and the deep ocean)
William, I, the many authors of IPCC Chapter 7, the vast majority of scientists who work in the field, _and_ the data are all correct. You might want to take this as a hint that you should reconsider whether there might be a flaw in your method.
Fluxes are balanced (or almost balanced) precisely because for several thousand years before humans started burning fossil fuels the system was in equilibrium. Every tree that grows eventually dies. The ocean is in equilibrium with the atmosphere - every CO2 molecule that enters is eventually balanced by a CO2 molecule that leaves. These fluxes are LARGE in comparison to human emissions. However, humans are taking fossil fuels that were not part of this short term (eg less than geologic time) carbon cycle and moving more carbon into the atmosphere. This actually leads to a small imbalance in fluxes. The increased atmospheric concentration leads (because of basic laws of thermodynamics) to the ocean absorbing carbon from the atmosphere. It also leads (because of carbon fertilization effects) to the ecosystem also absorbing carbon from the atmosphere.
Because these fluxes are large, you can’t use the C14 tracer to do what you want it to do. Here’s a thought experiment: you have two jars. One has 20 white marbles (call it the ocean), one has 10 white marbles (call it the atmosphere). Every day, you take ten marbles out of each jar, and swap them. Now, add 1 black marble to the atmosphere jar. Now, when you do your swap, there is a 91% chance that the black marble will move to the ocean jar. By your logic, this means the half-life of carbon is much less than a day. But look! There are still 11 marbles in the atmosphere jar. From now on, by the rules of this game, there will _always_ be 11 marbles in the atmosphere jar. Therefore, even though marbles exchange rapidly between jars, the addition of a marble to one jar has effectively an infinite lifetime. Now, this isn’t _quite_ parallel to our situation: when we add marbles to the atmosphere jar, thermodynamics tells us that we actually increase the rate of marble movement to the ocean jar, until partial pressures balance again. But it is closer than your model.
Now, go read that IPCC chapter. The numbers they have are not derived using “guesstimates of rate constants”, but rather experimental data, using both bottom-up and top-down methods. People measure the carbonate in the ocean, they measure the carbon in soils and trees, and use these measurements to derive the carbon fluxes into the various components of the atmosphere/ecosystem/ocean systems. There is still uncertainty in the precise values: but there are two numbers which are fairly well known. That is the human fossil emissions (~7 GtC) and the increase of carbon in the atmosphere (4 GtC). The difference between these two numbers (3 GtC) MUST be the net carbon sink by the land/ocean system.
Also, on my postulate about ecosystems being the cause of the seasonal CO2 cycle: given that the spring/autumn cycle is much larger in the northern hemisphere (with large land masses) than in the southern (small landmass, large ocean), it makes much more sense to attribute it to ecosystems than to oceans. Plus, we can measure the CO2 emitted by leaf litter decay and show that it is of the right magnitude to cause this cycle.
Now, please go read the IPCC chapter and think about it. And look at your model, and think about where the carbon is going: if humans burn fossil fuels, and the carbon goes into the atmosphere, where does it go? It has to go into the ocean, or into plant matter, or it stays in the atmosphere.
Now, your little kinetic model has it magically disappear. You have human emissions, and you have natural emissions, and you have a half-life which basically says that carbon goes “poof”. But it doesn’t.
And now, I should go do something useful with my time…
6 June 2007 at 7:11 AM
[[isn’t it more likely that these photons, after being absorbed and emitted and reabsorbed and reemitted will simply escape into space, even if only because of the curvature of the atmosphere and the simple fact that there’s less air up there to absorb all those photons?]]
Certainly. The Earth will continue to radiate just as much energy as it absorbs from the sun. But how that energy is distributed while it’s in the Earth system can change radically depending on how your atmosphere is composed and distributed (and other factors, but that’s the main one).
The point about the greenhouse effect is that radiation from the ground gets absorbed by the greenhouse gases, thus heating up the atmosphere. The hotter atmosphere radiates more, and some of that radiation goes back to the ground, making the ground hotter than it would be otherwise. The distribution of temperature from ground to space can change even though the amount of energy lost at the top remains about the same.
6 June 2007 at 7:16 AM
[[True, however the concentration of CO2 in the atmosphere is inhomogenous, there is much more at the surface and little at the top, where the photons are ultimately lost to space.]]
CO2 is well mixed throughout the troposphere, due to convection.
[[ What we have is a case of non-equlibrium theromdynamics. Space is a sink for photons and the surface is not. Photons that migrate downward encounter more CO2 molecules and those that go upward less. If you do a random walk deffusion type analysis you will note that the overall transfer is from the surface and into space; the sink will always win.
The question is what effect will the CO2 have on heat trapping? Will an increase in CO2 from 280 ppm to 560 ppm have a large effect on the surface temperature. The answer has got to be no, given that the effect will be about a change in the trapping efficency of about 12%. ]]
The answer has not got to be no, since that would contradict everything we know about radiation physics and the greenhouse effect. Doubling CO2 from 280 ppm to 560 ppm would raise the temperature of the ground 1.2 K by itself, or about 3 K with feedbacks.
6 June 2007 at 7:25 AM
[[I have shown two calculation which demonstrate that the half-life of 14CO2 and CO2 is between 9 and 12 years.]]
You’ve been told before why this is wrong, and you just keep on repeating it. You’re tracing the half-life of one molecule or one parcel of CO2 and ignoring the fact that parcels are coming into the atmosphere almost as fast as they are coming out. An individual CO2 molecule will spend about 5 years in the air before entering (say) the ocean. But that doesn’t give you the half-life of the CO2 in the atmosphere as a whole, which is closer to 200 years. Your calculation simply does not take into consideration all the relevant factors. It’s like proving that the Earth’s equilibrium temperature has to be 279 K because that’s the temperature a black iron ball at Earth’s distance from the Sun would have. You have to factor in the Earth’s albedo, and for the surface temperature rather than the equilibrium temperature, you have to get more complicated yet. Your calculations are simplistic and therefore wrong.
6 June 2007 at 7:30 AM
[[at the moment with 380 ppm CO2 no IR from the major CO2 absorbtion peals from the surface is tranfered above 10 meters. The only heat being trapped is from IR emissions from the atmosphere. If IR from the surface can’t move more than 10 meters up, why should IR generated at 11 meters be able to move down? ]]
Your 10 meter figure is completely bogus. For a concentration of 400 ppm, 99% of surface radiation is absorbed at 18 meters for the 1.9-2.1 micron band, at 82 meters for the 2.6-2.9 micron band, at 625 meters for the 4.1-4.5 micron band, and for the 13-17 micron band, where the CO2 greenhouse effect does most of its work, at 7,800 meters. Want the math?
6 June 2007 at 8:27 AM
Re 257
Dear Dr Martyn,
You are of course correct. The greenhouse effect does not work through back radiation in the way described by Gavin in his Learning from a Simple Model. Explaining his model he wrote:
“Point 1: It’s easy to see that the G (and hence Ts) increases from S to 2S as the emissivity goes from 0 (no greenhouse effect) to 1 (maximum greenhouse effect) … ”
In the case of the planet Venus we have an effective temperature of 227K, and nearly a maximum greenhouse effect of 1. Therefore the temperature of Venus should be 2 * 227 = 454 K but in fact it is 750 K. (Actually the maximum model surface temperature = (2 * 227^4)^0.25 = 270 K.) Therefore, as is known, the models do not work for Venus. See for instance:
‘It’s very disturbing that we do not understand the climate on a planet that is so much like the Earth,’ said Professor Fred Taylor, a planetary scientist based at Oxford University and one of the ESA’s chief advisers for the Venus Express mission. ‘It is telling us that we really don’t understand the Earth. We have ended up with a lot of mysteries.’ Venus: the hot spot
The way greenhouse gases warm the surface was described by Jack Barrett in a notorious paper: Barrett, J. (1995a) �The roles of carbon dioxide and water vapour in warming and cooling the Earth�s troposphere� Spectrochimica Acta 51A, pp. 415-417. Citing McIlveen, he pointed out that all the radiation in the greenhouse gas bands is absorbed in the bottom 30 m of the atmosphere. The greenhouse gas molecules are relaxed by collisions with other air molecules so heating the air. Barrett argued that since all the radiation is already being absorbed, increasing the concentration of CO2 will not cause further warming. However, as Hug has pointed out, with higher concentrations of greenhouse gases the radiation will be absorbed closer to the ground and so the air there will be heated more. From the Beer-Lambert Law it can be seen that if all the radiation is absorbed in 30 m with preindustrial levels (280 ppm) of CO2, then when CO2 is doubled the bottom 15 m will receive the same amount of heat. Heinze Hug claimed that this would not cause global warming because the hot air would convect away. But in deserts the hot air does not convect away. The air density has to be reduced by mixing it with water vapour before it convects. A point to note here is that with the current models it is predicted that the surface temperature will increase with the log of the concentration. With the Barrett/Hug scheme the heating is greater since it increases linearly with concentration.
If Barrett and Hug are right, why then is the planet warming? The answer is that it is more complicated than they describe. The absorption decreases exponentially with distance from the surface. Thus the strongest absorption is closest to the surface. The laminar surface layer below 1cm does not convect and it warms the surface by conduction. Here, is where water comes into play on two fronts. First, the warmer surfaces evaporates more water vapour which is also a greenhouse gas. But more importantly in the present climatic regime, the warmer surface leads to a melting of snow and ice. It is CO2 which is directly leading to the melting of the glaciers world wide, and to the sea ice and ice shelves in the polar regions. This leads to the ice albedo feedback which also causes warming.
One final reference to back all this up is that it agrees with what Philipona is reported. See http://www.realclimate.org/index.php/archives/2005/11/busy-week-for-water-vapor/
6 June 2007 at 9:52 AM
re 257
Forgive me, but I couldn’t resist.
“If IR from the surface can’t move more than 10 meters up, why should IR generated at 11 meters be able to move down? ”
Air currents.
I’ll shut up now.
6 June 2007 at 10:23 AM
Poking around I see someone with the DocMartyn userid actively posting statements about climate in other forums, obviously having a lot of fun keeping the ball in the air, repeating stuff that gets a lot of attention. I don’t see a lot of learning taking place. I’d like to see some.
If any of these others are the same person, consider getting it together in one place and focusing on basic science. Twenty years ‘doing spectroscopy’ means it’s been a long time since school, eh? Science has moved on a bit.
Arithmetic still works the same though, and logic can still be relied on for basics.
If you gain twelve pounds every winter, and lose eleven pounds every summer, are you gaining weight year after year? If not, why not?
6 June 2007 at 11:21 AM
Follow-up to post 102 et seq. about NASA’s Michael Griffin’s arrogant comments regarding global warming: http://www.msnbc.msn.com/id/19058588/print/1/displaymode/1098/
His “regrets” are nearly as misguided as his original comments as they show that his comments were not driven by the scientific data but by his politics. The worst possible background for a supposed *scientific* agency administrator.
6 June 2007 at 11:52 AM
Barton Paul Levenson (#266) wrote:
Is there a link or offline article? This sounds like interesting stuff - not that I expect to be able to follow it. But I guess there is always hope.
6 June 2007 at 11:57 AM
Marcus, Tim and Ray, thanks for the clarification.
6 June 2007 at 12:03 PM
PS to #271
I would assume that a large part of this has to do with the density of the gas, the temperature and thus blackbody radiation which is being emitted at a particular level, then the strength and width of the absorbtion bands. Is this correct? If so, I would gather that the altitude will change as the temperatures at given altitudes change as the result of climate change. Either way, I would still be interested in seeing the math.
6 June 2007 at 1:05 PM
Re 270. Dan, Mike Griffin really has no business answering a question like that. He is not a climate expert–not even really a scientist. He is an engineer with a job to do, and as such, one of the most blinkered and narrow-focused animals on the planet. I believe Griffin is convinced that without a reinvigorated manned program that NASA will wither on the vine. He may be right–the US public certainly has given no indication of enthusiasm for the science NASA produces. Thinking that he will also have to shepherd through a bunch of climate satellites and that funding may be drawn away to pay for alternate energy programs is just a nuissance to his achieving his goal.
We keep hearing how complicated the climate is, and that is true. Nonetheless the real issues people need to understand are pretty simple:
1)The energy in Earth’s climate is increasing well beyond the limits of “normal variability”
2)That energy has to come from somewhere
3)Looking at the energy drivers of climate
a) Solar variability can’t come close to explaining the changes we see
b) Water vapor (the most important ghg) can’t come close
c) CO2 (the 2nd most important ghg) can explain it easily
d) All the other energy drivers are pretty far down the scale or aren’t changing
That’s pretty much it. If you get into details, then people can get confused. For instance the fact that CO2 does most of its work in the upper troposphere and above where there isn’t much water vapor is a fact most people miss. And a lot of the potential effects of the warming aren’t all that obvious–e.g. the effects it will have on agriculture, infectious disease, availability of water… That is why the biggest resistance seems to come from either people who don’t have a clue or those who, while educated in their narrow discipline, do not have a broad scientific education that would enable them to fully understand details of the subject. Griffin’s sin was answering a question on an area he really doesn’t understand. That was unwise and unfortunate, but it’s probably should not be a firing offense. If it were, we’d all spend a lot of time in the bread line.
6 June 2007 at 1:10 PM
Marcus,
Thank you for your post #262. You have a flair for presenting complex concepts in a manner understandable to laypeople such as myself. I have wondered if much of the difficulty in communicating the science behind AGW is the shortage of images/models/metaphors an average non-scientist can comprehend.
So I’ll pass along (somewhat tongue in cheek) a metaphor I’ve used with skeptical friends.
Many people have heard of the Butterfly Effect, the concept that small perturbations to a system can have large effects. As the theory goes, the wings of a butterfly in the Amazon can trigger a hurricane. Okay, now picture a butterfly weighing 7 gigatons, that’s 14,000,000,000,000 pounds. (That’s more than Oprah and Kirstie Alley combined.) We’ll call it Mega-Mothra. That’s the perturbation our annual consumption of fossil fuels is having on our atmosphere. The consequences won’t be negligable, and they won’t be benign. And remember, this is not a one-time oops, every year we’re hatching another Mega-Mothra out of our smokestacks and tailpipes. A lot of things we hold dear and take for granted are in danger from the effect of this butterfly. There are some who want to mitigate AGW through geoengineering, sort of like building a Robo-Godzilla to battle Mega-Mothra. But we know from experience that everytime we try that Tokyo gets flattened. The only low-risk, long-term solution is to sharply cut back on the CO2 we emit by reducing our consumption of of fossil fuels.
I think that’s a simple enough explanation that even a President could understand it.
6 June 2007 at 1:17 PM
Re #273
Timothy, greenhouse gases do not emit blackbody radiation. Greenhouse gases emit line radiation at frequencies that match their vibrotational excitation, not their temperature. The line width depends on pressure so the lines become narrower with altitude, but since the pressure altitude relationship depends on gravitation and mass of the air neither of which change, then that has no effect on global warming.
6 June 2007 at 1:49 PM
Well, its not the actual equations, but…
There is more in case people are interested. But part of what I find interesting is the fact that re-emitted photons are more likely to be absorbed if they are re-emitted in the direction of space rather than towards the ground.
6 June 2007 at 1:50 PM
Tim, the footnotes to this section might help:
http://www.aip.org/history/exhibits/climate/Radmath.htm
“Callendar himself pointed out in 1941 that the way CO2 absorbed radiation was not so simple as every calculation so far had assumed. He assembled measurements, made in the 1930s, which showed that at the low pressures that prevailed in the upper atmosphere, the amount of absorption varied in complex patterns through the infrared spectrum. Nobody was ready to attempt the vast amount of calculation needed to work out effects point by point through the spectrum, since the data were too sketchy to support firm conclusions anyway.(6)
“Solid methods for dealing with radiative transfer through a gas were not worked out until the 1940s. The great astrophysicist Subrahmanyan Chandrasekhar and others, concerned with the way energy moved through the interiors and atmospheres of stars, forged a panoply of exquisitely sophisticated equations and techniques. The problem was so subtle that Chandrasekhar regarded his monumental work as a mere starting-point. It was too subtle and complex for meteorologists.(7)They mostly ignored the astrophysical literature ….
“Most experts stuck by the old objection to the greenhouse theory of climate change â�� in the parts of the spectrum where infrared absorption took place, the CO2 plus the water vapor that were already in the atmosphere sufficed to block all the radiation that could be blocked. Therefore a rise in the level of the gas would not change anything….
“… In the early 1950s precision measurements at low pressure, backed up by lengthy computations, showed that adding more CO2 really would change how the atmosphere absorbed radiation. While the total absorption might not change greatly, the main site of absorption would shift to higher, thinner layers. And as Callendar had explained, shifting the “screen” in the atmosphere higher would mean more radiation going back down to warm the surface.
…
“… Laboratories began to gather good data only in the 1950s, motivated largely by military concerns.(8)
…
“Some later developments are described in the essay on simple models. However, this Website does not cover technical developments in radiation models (nor details of the other increasingly sophisticated components of general circulation models) from the 1980s forward.”
————–
For science as for history:
“Those who cannot remember the past are condemned to repeat it.”
Much of what’s being asserted is what was believed in the 1930s.
6 June 2007 at 2:27 PM
Ray, good and reasonable question (228). The difficulty mostly comes from this: us skeptics express what we see is a chink in the armor. The protagonists reply with an answer. But we don’t completely buy the answer, even though it may be well thought out and researched. That makes it annoying and the protagonist eventually goes away shaking his head and mumbling profanities — maybe rightly so! We come across as irrational (though I’ll contend we’re not) primarily because most skeptics (current skeptical climate scientists excepted) do not have the detailed background or research to back up our concerns. I’m not a climate scientist; I haven’t launched my own satellites or got tied into their data repositories; I’ve never conducted radiometric absorption tests with my (non) lab supply of CO2; I’ve never published my concern in a peer-reviewed journal (or anywhere for that matter); etc. It’s understandable that we are looked upon askance.
But I think our questioning is valid. As long as we have a decent scientific mind and background, especially with ample experience with real world realities, have developed a decent crap detector ( avoiding the normal phrase “bull**** detector”, which implies that the person is knowingly giving out bad information, which is not the case here.) — does it pass the sniff test?, and understands the process where well-intentioned people can err. (The downside is, of course, that us well-intentioned somewhat credentialed skeptics might also be dead wrong.) While we don’t have the premier credentials of the people we are questioning, we’re still under no per se obligation to simply roll over.
So we’re a hard and seemingly (but not really) irrational sell. On that basis I can fully understand why you would eventually give up trying. None-the-less, as long as we maintain ourselves on this side of cantankerous trolls and blind deniers, we’re still in the right even if later we’re proved not right (sorry).
Specific concerns that first come to mind are, in the process arena, the excessive reliance on non sequiturs to “prove” the science: “we out number you 100 to 1″ (the consensus shot); “we have way more peer reviewed papers than you skeptics”, and the liberal use of ad hominems (though you clearly don’t have a monopoly here, nor is it universal) toward folks that don’t immediately accept your assertions. These taint your credibility. On the science side, e.g. 1) The argument that when the CO2 in the path length within a constrained bandwidth is absorbing near all of the IR radiation (as it is today in some cases), more CO2 will absorb lots of the radiation outside the nominal bandwidth in some kind of fringe process. CO2 (and other gasses) absorb radiation at a specific resonant frequence (within some bandwidth); It doesn’t sound right that it will start absorbing many photons outside of resonance just because the resonant frequencies are “full”. (btw, many have patiently tried to explain it, but I still didn’t buy it, and they got tired of answering and I got tired of questioning.) 2) I have trouble with the accuracy claimed for measurements — GLOBAL average temperature to 0.1 degree accuracy decades ago (though I tend to accept the slight increase over the last century or so) and satellite measurement of ocean heights to 1mm or even less, then translating those measurements into grand sweeping effects.
There are others, but I’ve worn out my welcome.
6 June 2007 at 3:00 PM
RE # 270
Thanks for that link, Dan.
As if Griffin was pained by the controversy he stirred up, he went on to blame the media - not himself.
He said:
[â??Doing media interviews is an art. Their goal is usually to generate controversy because it sells interviews and papers, and my goal is usually to avoid controversy,â??]
Putting both feet into his mouth, he was not yet satisfied. He went on to serve himself even more ridicule.
Obviously, Griffin is not goal oriented. Dangerous for NASA.
Put him out to pasture.
6 June 2007 at 3:34 PM
JS has it right, it is the constant emission and absorption of the IR that leads to the greenhouse effect. A good way of thinking about it, is that radiation from the surface heads out. Absorption and emission redirect this into 360 degrees. Another way is to think of what would happen if you shot a bunch of balls (photons) into a bunch of pinball machine bumpers (CO2 molecules). The more bumpers the longer it would take for any one ball to reach the drain (space). To keep the number of balls reaching the drain (keeping the total energy radiated to space constant) per second, you would have to shoot more balls (e.g. heat up the surface so that more photons are emitted per second).
6 June 2007 at 3:38 PM
Alastair, Barrett was wrong for a lot of reasons, mostly because he did not account for emission from CO2 molecules and had not a clue about radiative and collisional transfer of energy.
6 June 2007 at 3:57 PM
#271 Barton, would you expect the lapse rate to increase at 7 or 8 Km? Been seeing some steep lapse rates during the long Arctic night at about that altitude, specially last December, mainly frequent 7 to 8 C/Km and a few 9 C/Km layers were observed in total darkness. For the steadfast contrarians appropriately mulling over AGW theory, these are strong facts, imagine that, high altitude warm air in prolonged darkness (2 months long).
6 June 2007 at 4:54 PM
Pinball Wizard Eli Rabett (#281) wrote:
This is pretty good. I had been thinking about an analogy along much the same lines. However, part of the problem with this approach is that you have the same number of pinball/photons entering the system - assuming the only thing you are varying is the carbon dioxide. So basically, the pinball machine has new bumpers added - representing more carbon dioxide molecules - and as such, the pinballs bounce around more and take longer to get to the bottom. At first, fewer pinballs reach bottom - meaning that more energy is entering the system than is leaving the system. However, as the number of pinballs in the pinball machine increases, more and more pinballs will reach bottom at any given more. More pinballs in the system means more photons which means more energy which means a higher temperature. Balance is achieved once the number of pinballs entering the system equals the number leaving, but with more bumpers, there are going to be more pinballs in the machine for such a balance to be achieved.
Incidently, the pinball and bumpeer idea works well for a good approximation of Beer’s Law, too. If a given number of randomly distributed bumpers results in fifty percent of all pinballs hitting at least one bumper, this implies that half of the pinballs didn’t hit a bumper. Double the bumpers and one-quarter of the pinballs will avoid all the bumpers. Double the bumpers again, and the number will be one-eighth. Of course, this works best if you have tiny pinballs, tiny bumpers, a great many of each, and they are all widely-space.
6 June 2007 at 5:21 PM
Eli, Barrett did make several errors but he was right on the one point that the radiation is absorbed in the bottom 30 m of the atmosphere. Oke and McIlveen both agree on that, as does Barton see #266. It is only in most of the rest of the atmosphere that LTE exists.
Thank you for the reference to Evans & Putrin that you posted elsewhere. I have read it, but it contains nearly as many errors as Barrett. Barrett did not say Kirchhoff’s Law was wrong, and he explicly agreed in his reply to Prof. Braterman that he accepted the Schwarzschild equation. Moreover, there are two views of Kirchhoff’s Law and Evans & Puckrin (E&P) proved neither.
First, the law is normally stated as good absorbers are good emitters, or as absorption equals emission in thermal equilibrium. This is trivially true for solids since it follows from the conservation of energy. If the temperature of a body is steady, then any radiation in must equal the radiation out. In E&P the radiation in was from the temperature of liquid nitrogen, and they claimed that the output radiation was at the ambient temperature. That is hardly radiation in equals radiation out!
The second form of Kirchhoff’s Law is that blackbodies radiate with a spectrum that is describe by Planck’s function B(). The spectrum emitted by the CFC was line radiation quite unlike that of a blackbody.
But Kirchhoff’s Law only applies in thermal equilibrium which is not the case for air at the surface of the Earth. Its temperature is continually changing as a result of the diurnal solar radiation cycle.
Schwarzschild’s equation was invented by an astrophysicist for the interior of the Sun. It was the another astrophysicist Chandrasekhar who advocated its use with planetary atmospheres, but the meteorologists have managed fine without it, because it does not apply to the surface temperatures with which they are concerned.
HTH,
Cheers, Alastair.
6 June 2007 at 6:35 PM
Alastair McDonald (#276) wrote:
Similar to a laser - where the gas or crystal has only one excitation level responsible for absorption and re-emission, as we are dealing with the same wavelength, but different insofar as it is incoherent and isotropic - although I have heard of a stellar atmosphere actually achieving the stimulated emission of radiation before. Unfortunately the story was at the popular level, and I didn’t dig any further.
In the idealized layer model, they find it useful to treat the atmosphere as if it acts as a blackbody in the infrared - absorbing and emitting all wavelengths. Something to be disabused of. Makes for a more interesting world: there would have been real limits to our understanding of the greenhouse effect prior to the discovery of quantum mechanics. In effect, this is an intersection between quantum mechanics and thermodynamics.
6 June 2007 at 7:13 PM
Dear Barton Paul Levenson, Re 266
“Your 10 meter figure is completely bogus. For a concentration of 400 ppm, 99% of surface radiation is absorbed at 18 meters for the 1.9-2.1 micron band”
Whats 10 meters between friends, I was guesstimating the extinction from a google image; however the science reamins the same
“at 82 meters for the 2.6-2.9 micron band, at 625 meters for the 4.1-4.5 micron band, and for the 13-17 micron band, where the CO2 greenhouse effect does most of its work, at 7,800 meters. Want the math?”
No need for the math, I didn’t realise you were going to include the wings. But none the less you believe that incresing CO2 by a factor of two, hence changing the transmission by 12% will heat the world by 2- 5 degrees.
————————————————————————
Tim said in #277
“If an IR photon is emitted lower in the atmosphere, its probability to be (re-) absorbed at a higher elevation is high: Because of the higher elevationâ??s lower temperature, a higher amount of molecules is in an absorbing, lower vibrational state. The opposite is true for atmospheric inversions, leading to a further cooling of the atmosphere already at lower temperatures (example: greenhouse gases generally lead to tropospheric heating due to its negative lapse rate, and stratospheric cooling due to its positive lapse rate).”
I have heard this argument before, and I found it very unconvincing. The logic why this heat transfer method will not work is that it ignore the temperature effect on both absorbtion and emission line broardening.
Now the CO2 molecule has an a complex absorbtion and emmission spectrum, however we can simplyify matters by pretending that the major peak is a gaussian. At high temperatures this peak has a higher width and lower extinction at its peak, compared with at low temperature. So although it is true that the cold gas, with sharpe absorbance peaks, is ready to absorb IR, it has a smaller bandwidth than the IR emissions of hot gas.
It is simple to model, take two gaussians, each with the same area under the curve, but with one 30% or more width. Take one away from the other. You can see that the hot emissions are going to bypass much of the cold gas.
Can I prove it? No. Nor should I have to, this should be done in a lab by people who work in the area. Expirementally is easy, almost all the assumptions made by people who model atmospheric heat transfer are testable, with simple physical expirements, they do not get done.
——————————————————————–
Hank #278
“And as Callendar had explained, shifting the “screen” in the atmosphere higher would mean more radiation going back down to warm the surface.
…”
If true then another way to describe it would mean that the Earths “true surface”, where the temperature matchs 250.22 K you get from appling Stefan-Boltzmann law and 222.3 watts/meter2, has just moved vertically by 500 feet (or 1.2 degrees). Why does the heat have to reach the ground?
——————————————————————
To Eli Rabett #28
“Another way is to think of what would happen if you shot a bunch of balls (photons) into a bunch of pinball machine bumpers (CO2 molecules). The more bumpers the longer it would take for any one ball to reach the drain (space). To keep the number of balls reaching the drain (keeping the total energy radiated to space constant) per second, you would have to shoot more balls (e.g. heat up the surface so that more photons are emitted per second)”
Which assumes that temperature is the only variable, changes in volume or pressure appear to be not allowed. Strange that in the upper atmosphere that an expansion is not allowed, given that it would increase the surface of the radiator.
———————————————————-
Alastair #285.
I can’t hep thinking that people are missing the point of what temperature and heat actually are. You are absolutely correct that the day/night cycle is key. The CO2 arguments outline in this tread would only make sense if we were to observe changes in the rate at which the South pole cools and warms, during its day/nigh cycle. During the whole time that we have been making measurements, there has been no change in the RATE at which cooling and heating occurs. However, during the same time CO2 has increased by 30%. The same arguments for IR absorbtion/emission should be more valid here than they are anywhere, as:
1) The Pole is a desert so there is no need to factor in water vapor changes.
2) There is no conversion of water to ice and vise versa, simplifing everything.
The final points for tonight are these:-
A) If CO2 has a half-life in the atmosphere of greater than 100 years, why and how did 14CO2 in the atmosphere have a decay of 10 years or so?
Did the 14C pixies take it. How can a susbset of total atmospheric CO2 have a decay rate of 10 year-1, if the bulk CO2 has a decay rate of >100 years -1. If you can’t answer this, then all your models are incorrect. No if, no buts, wrong and proven wrong. The 100+ half-life before sequestration does not match the 14CO2 half-life before sequestration. Why and How.
During the day and night cycle, it is both hotter and colder in the desert (Albedo 0.24) than it is in Grassland (0.19 ) or the forest (0.13). Doesn’t this give you some sort of clue to what is pumping out heat during the night and absorbing it during the day?
If the problem of run away green house gases is going to be caused by a decrease in ice reflecting away sunlight, should we be making deserts by bombarding plants with agent orange?
6 June 2007 at 7:40 PM
> the meteorologists have managed fine without it, because
> it does not apply to the surface temperatures …
But it does apply at the top of the atmosphere. Don’t forget that.
Rod, do look at the quote I posted pointing to Spencer Weart’s History; first link under Science, right side of the page.
6 June 2007 at 8:27 PM
Re #263:
Barton,
Thanks for the explanation. I understood that what you described was happening. It took the later “pinball” analogies for me to get the parts I was missing.
6 June 2007 at 9:10 PM
Perhaps a review of Learning from a simple model is in order?
If you look at the first figure you will see a dotted line representing the greenhouse gas layer. As the article notes, it’s a simplification because there are really many layers in an atmospheric model (think of the atmosphere as a stack of transparent pancakes for the purposes of looking at radiative fluxes).
An overview of the historical development is at http://www.aip.org/history/climate/Radmath.htm - and if you want more gory technical details, simply type in “radiative transfer model” in quotes in Google. Here’s one for Jupiter!
Where does this leave the non-atmospheric physicist/modeler? One thing that can be done is to compare the output of these highly complicated models to observations - and the new IPCC report addresses this in a lot of detail. Here’s the link to Chapter 8: http://ipcc-wg1.ucar.edu/wg1/Report/AR4WG1_Pub_Ch08.pdf (6.4 MB pdf file).
The section of interest appears to be 8.3.1.1.2 “The balance of radiation at the top of the atmosphere”.
Let’s start with reflection of incident sunlight:
At most latitudes, the difference between the multi-model mean zonally averaged outgoing SW radiation and observations is in the annual mean less than 6 W m-2 (i.e., an error of about 6%; see Supplementary Material, Figure S8.5). Given that clouds are responsible for about half the outgoing SW radiation, these errors are not surprising, for it is known that cloud processes are among the most difficult to simulate with models
Now, for the infrared �greenhouse� emissions:
At the TOA, the net SW radiation is everywhere partially compensated by outgoing LW radiation (i.e., infrared emissions) emanating from the surface and the atmosphere. Globally and annually averaged, this compensation is nearly exact. The pattern of LW radiation emitted by earth to space depends most critically on atmospheric temperature, humidity, clouds and surface temperature. With a few exceptions, the models can simulate the observed zonal mean of the annual mean outgoing LW within 10 W m-2 (an error of around 5%; see Supplementary Material, Figure S8.7).
However, we live in a fluid environment, so transport processes matter:
For a climate in equilibrium, any local annual mean imbalance in the net TOA radiative flux (SW plus LW) must be balanced by a vertically integrated net horizontal divergence of energy carried by the ocean and atmosphere. The fact that the TOA SW and LW fluxes are well simulated implies that the models must also be properly accounting for poleward transport of total energy by the atmosphere and ocean. This proves to be the case, with most models correctly simulating poleward energy transport within about 10%.
There’s more in there about seasonal variations, and ensemble model runs vs. individual model runs, but that’s the general idea. If you compare the very complex models to the observations, they do match well - and the models are not ‘fit’ to the observations, but rather are based on solid physical principles.
Free hint for skeptics: if you want to attack climate models, there are many other areas you might want to take a look at - the cryosphere, the ocean circulation, the vegetation, the overall carbon cycle… although these are areas where observations seem to indicate that the models are underestimating, not overestimating, the climate response… so perhaps that’s a bad idea.
6 June 2007 at 10:31 PM
“At high temperatures this peak has a higher width and lower extinction at its peak, compared with at low temperature. So although it is true that the cold gas, with sharpe absorbance peaks, is ready to absorb IR, it has a smaller bandwidth than the IR emissions of hot gas.
It is simple to model, take two gaussians, each with the same area under the curve, but with one 30% or more width. Take one away from the other. You can see that the hot emissions are going to bypass much of the cold gas.
Can I prove it? No. Nor should I have to, this should be done in a lab by people who work in the area. Expirementally is easy, almost all the assumptions made by people who model atmospheric heat transfer are testable, with simple physical expirements, they do not get done.”
Why yes, that is well known and observed and one of the ways that SOME OF THE emission from CO2 molecules low down escapes. Note that the absorption per molecule at line center is HIGHER for colder molecules. Gilbert Plass was looking at these issues in the 1950s. This is built into all of the radiation transfer codes. Your ignorance is your problem.
6 June 2007 at 10:32 PM
Alastair, a molecular in a thermal bath obeys Kirchhoff’s law. The difference is that the absorbtivity/emission is a strong function of wavelength.
6 June 2007 at 10:42 PM
“If true then another way to describe it would mean that the Earths “true surface”, where the temperature matchs 250.22 K you get from appling Stefan-Boltzmann law and 222.3 watts/meter2, has just moved vertically by 500 feet (or 1.2 degrees). Why does the heat have to reach the ground?”
Which heat? Energy moves from the surface where the visible sun light strikes the ground and heats it, to the level at which it is emitted to space as IR. The higher the greenhouse gas concentrations, the slower the rate at which energy reaches the altitude where it is emitted. The surface has to warm in order that sufficient energy can reach the layer from which the energy is emitted (it is a few km, not 500 m)
6 June 2007 at 10:44 PM
One of the effects of global warming IS to raise the level at which the earth radiates. Of course, the density is also lower so the increase in emission rate is not as large as you would think. This point was made in John Houghton’s reply to Barrett. Y
7 June 2007 at 1:11 AM
FurryCatHerder (#289) wrote:
I took a guess that Gavin’s “simple model” could be understood in terms of a series of transfers or “steps” - and modeled it with a static spreadsheet with rows for the steps and columns for each quantity. It worked - giving me his results. But… the pinballs help me, too. Then again, one could use a bath tub analogy - I have heard that before. But I think I prefer the pinballs or marbles.
Maybe it has something to do with having been born after 1905. Nearly anyone in the modern world will tend to think of light as consisting of photons - and when you have photons, you want to know where each one is at.
The bath tub works just fine if you are thinking of it in terms of energy - as if it were water. Turn on the faucet, water pours in, then eventually pours out at the same rate that it enters the tub. Make the tub a little deeper, water will continue to pour in from the faucet, eventually reaching the rim and then pour out at the same rate that it enters the tub - but the tub has more water in it. The increased carbon dioxide consists of the higher walls.
I suppose it is easier to think of water as something continuous but light as something discrete, even though water is made of molecules and photons aren’t strictly particles - but then neither are electrons - since an electron can pass through two slits in the same screen and interfere with itself on the other side. Then again, the tub is missing something: it doesn’t get at the effect of doubling the CO2 like the pinball/bumper analogy does. The tub of water works qualitatively, but the pinballs works both qualitatively and quantitatively. Additionally, the absorbtion and re-emission can be thought of as the before and after of a collision - with pinballs.
Come to think of it, the pinballs are better from a number of different angles - and more than I listed here.
7 June 2007 at 4:41 AM
Re #291 Eli,
It is true that the altitude at which carbon dioxide radiates to space is elevated by an increase in its concentration, but this does not affect the amount of radiation. Looking from space you would see a solid wall of CO2 molecules radiating, because all the other air molecules are transparent. Thus the density of the air is irrelevant, as is the height at which this wall appears to be!
If you inspect a spectrum of OLR taken from space you can see that the CO2 band is flat. Ths is because the radiation is coming from the edge of a line emitted at the base of the atmosphere and is not absorbed by molecules above it with narrower lines of absorption and emission.
One mistake that is made it to think that radiative balance to space is achieved by a variation of outgoing longwave radiation. In fact the balance is mainly achieved by clouds altering the incoming solar radiation.
On Earth the clouds are formed from water, on Venus from sulphur dioxide, and on Mars from dust.
Houghton and Shine did not show that Barrett was wrong. Houghton mistook what Barrett wrote (perhaps understandably :-)) and Shine conceded that the models use Planck’s function for blackbody radiation to calculate line emissions. They then both restated the current thinking, but that did not answer Barrett’s criticism of it.
Saying that the surface temperature is set high in the troposphere does not make it true. In fact, that idea is based on the assertion that the troposphere is tightly coupled. The troposphere is rhe region of overturning circulation, which has an inversion above the Boundary Layer. Asserting that the troposphere is tightly coupled does not make that true either!
7 June 2007 at 5:28 AM
Re #292 “Alastair, a molecular in a thermal bath obeys Kirchhoff’s law. The difference is that the absorbtivity/emission is a strong function of wavelength.”
Eli, only if the bath is isotropic. If it is being heated (or cooled) by radiation from the Earth’s surface below, it is not isotropic. Treating the atmosphere as an isotropic thermal bath is a simplification too far. It may be true for stellar interiors but it is totally inappropriate for a planetary atmosphere especially one which contains a condensing greenhouse gas.
7 June 2007 at 6:28 AM
#295
“Why yes, that is well known and observed and one of the ways that SOME OF THE emission from CO2 molecules low down escapes. Note that the absorption per molecule at line center is HIGHER for colder molecules. Gilbert Plass was looking at these issues in the 1950s. This is built into all of the radiation transfer codes. Your ignorance is your problem.”
I know the extinction coefficient at peak is higher for cold molecules than for hot ones, I even stated it, but what happens at either side of the absorbance peak?
Take two gaussians representing emission and absorbance, give the cold absorption peak half the line width of the hot emission peak. Take one away from the other and you find that 32% of the emission gets through, even though 100% is absorbed at the peak. Its not complicated.
7 June 2007 at 6:38 AM
[[The way greenhouse gases warm the surface was described by Jack Barrett in a notorious paper: Barrett, J. (1995a) �The roles of carbon dioxide and water vapour in warming and cooling the Earth�s troposphere� Spectrochimica Acta 51A, pp. 415-417. Citing McIlveen, he pointed out that all the radiation in the greenhouse gas bands is absorbed in the bottom 30 m of the atmosphere. The greenhouse gas molecules are relaxed by collisions with other air molecules so heating the air. Barrett argued that since all the radiation is already being absorbed, increasing the concentration of CO2 will not cause further warming.]]
Barrett is a pseudoscientist. As I show above, the 30 meter figure is bogus. And increasing the concentration of CO2 would cause further warming even if the 30 meter figure were legitimate, because it’s not just absorption of surface IR that matters, it’s absorption among and between all levels.
7 June 2007 at 7:44 AM
Re #287
Dr Martyn,
In theory the South Pole would be a good place to test my theory, but its unique features mean that the climate there does not behave in the same manner as the rest of the planet. The South Pole is the only pole that is situated at high altitude at the centre of a continent. (The other pole is at the centre of a small ocean.) Being polar it only has one day and one night during the year, and so it is not suitable for testing normal diurnal behaviour. As a result of its position, its weather is dominated by a polar vortex which brings stratospheric air to the surface. The stratosphere has been cooled by the destruction of the ozone layer as the result of the emission of CFCs. Thus any warming that might be recorded there due to higher CO2 concentration will be offset by the loss of the ozone layer.
Although most people like to think that global dimming was caused by pollution, it was first recorded in Australia far from the Asian Brown Cloud. Investigations in Israel found that it was related to clouds forming earlier in the day, and this would fit with CO2 accelerating the evaporation of surface water, ie an increase in rate of the diurnal cycle.
You are correct that there is a mystery with the fate of C14, but it does not have a bearing on the residence time of CO2. CO2 is cycled through the atmosphere in a period of about 7.5 years. See: http://www.whrc.org/carbon/index.htm Where it all goes to is not known
http://www.whrc.org/carbon/missingc.htm but much of it gets transported to the deep ocean by the thermohaline circulation. That is replaced by CO2 that has remained in the deep ocean for around 1000 years, which is depleted in C14. But since the CO2 which is removed equals the amount escaping from the ocean, then the increase in CO2 concentration due to the burning of fossil fuels will remain, although that CO2 enriched in C13 will also enter the deep ocean.
I did not follow your final remarks, but turning the world into a desert, while it might restore the planetary albedo and lead to a cooler climate does have a major disadvantage. All animal life depends on plants as food, either directly for herbivores, or indirectly for carnivores. They eat herbivores. However, one solution to a reduction in albedo due to a loss of ice would be to increase the albedo of deserts.
HTH,
Cheers, Alastair.
7 June 2007 at 7:45 AM
[[Barton Paul Levenson (#266) wrote:
Your 10 meter figure is completely bogus. For a concentration of 400 ppm, 99% of surface radiation is absorbed at 18 meters for the 1.9-2.1 micron band, at 82 meters for the 2.6-2.9 micron band, at 625 meters for the 4.1-4.5 micron band, and for the 13-17 micron band, where the CO2 greenhouse effect does most of its work, at 7,800 meters. Want the math?
…..
Is there a link or offline article? This sounds like interesting stuff - not that I expect to be able to follow it. But I guess there is always hope. ]]
Sure. The transmissivity of a column of air is:
exp(-k p L)
where k is the absorption coefficient, p the partial pressure, and L the path length. I’m using Essenhigh’s (2001) reductions for the absorption coefficients, which seem to be correct even though he applied them wrongly in his article. For k the units are reciprocal meter atmospheres (m-1 atm-1). Pressure (misnamed “concentration” in Essenhigh’s article) is in atmospheres, and path length L is in meters. The units all cancel, giving a dimensionless answer.
For CO2 the coefficients for the four major infrared bands (at 1 atmosphere pressure and 288 degrees K. temperature) are:
1.9 - 2.1 microns: 656
2.6 - 2.9 microns: 139.4
4.1 - 4.5 microns: 18.37
13 - 17 microns: 1.48
The absorptivity is simply 1 minus the transmissivity, since scattering is negligible for the infrared in Earth’s atmosphere. (It has to be taken into account for Venus’s atmosphere, though.)
For the path lengths, just substitute 0.99 for the absorptivity and solve for L.
Essenhigh’s article can be found at:
http://pubs.acs.org/subscribe/journals/ci/31/i11/html/11box.html
He makes the same mistake that DocMartyn and Barrett make — assuming that since most of the ground IR is absorbed close to the ground, adding more CO2 won’t have any effect.
7 June 2007 at 7:49 AM
Re #283 — yes, the lapse rate generally increases with altitude in the troposphere. It starts out at about 4.75 K/km near ground level and increases to almost 9.8 K/km near the tropopause. The average is around 6.5 K/km, which is what NASA/NOAA/USAF used for the 1976 Standard Atmosphere.
7 June 2007 at 7:58 AM
[[On Earth the clouds are formed from water, on Venus from sulphur dioxide, and on Mars from dust.]]
At Venus temperatures, sulfur dioxide is a gas. The Venus clouds are a 75%-85% aqueous solution of sulfuric acid (H2SO4.H2O). They are, like Earth clouds, drops of liquid.
The Mars clouds are water droplets and ice droplets, and also CO2 liquid and ice. Mars does have dust in its atmosphere much of the time, but generally at a much lower altitude than the clouds.
7 June 2007 at 8:08 AM
Re #299 Barton,
Writing that Barrett is a pseudoscientist is both incorrect and an ad hominen argument, so not worth discussing.
You wrote “For a concentration of 400 ppm, 99% of surface radiation is absorbed at 18 meters for the 1.9-2.1 micron band, at 82 meters for the 2.6-2.9 micron band, at 625 meters for the 4.1-4.5 micron band, and for the 13-17 micron band, where the CO2 greenhouse effect does most of its work, at 7,800 meters. Want the math?”
I think that 30 m makes a fair average of your figures, especially if water vapour is included. The point is that the absorbed radiation is not re-emitted because the excited molecules are relaxed by collisions with the other air molecules. The energy that would go to provide the energy for re-emission has gone to heat the air. It is really quite simple.
What is not so obvious is that increasing CO2 concentration will warm the surface, but it does by conduction. What is obvious is that radiation changes near the top of the troposphere cannot drive the surface temperature 10 km away!
7 June 2007 at 8:48 AM
Re #303
At the surface temperature of Venus sulphur evaporates and forms a gas which condenses and forms a cloud. The surface temperature of Venus is set by the vapour pressure of sulphur, just as the surface temperature of the Earth is set by the vapour pressure of water, roughly speaking. Mars heats up until there is a dust storm which cools it down. Planetary climates are dynamical systems where at times either positive or negative feedbacks dominate. Mostly the negative feedbacks dominate because they are stable, but short catastrophes due to positive feedbacks can happen.
7 June 2007 at 9:22 AM
“I know the extinction coefficient at peak is higher for cold molecules than for hot ones, I even stated it, but what happens at either side of the absorbance peak?
Take two gaussians representing emission and absorbance, give the cold absorption peak half the line width of the hot emission peak. Take one away from the other and you find that 32% of the emission gets through, even though 100% is absorbed at the peak. Its not complicated.”
GIGO. The most obvious effect of changing altitude is to change the number density of the CO2 molecules. This changes the total band absorption in a straight forward manner
There are two major effect of changing temperature. The first is to change the distribution of ground vibrational level quantum states, which changes the opacity of the system as a function of photon frequency. The second is to change the thermal distribution of population in the first excited level of the two degenerate bending modes, which means that the intensity and frequency distribution of the emission changes. Both of these are simple to calculate on a line by line basis that should be in the reach of a senior year physics or chemistry major.
In all cases up to well above the stratosphere, collisional energy transfer assures local thermodynamic equilibrium (equivalent to saying that the distribution among quantum states can be described by a temperature)
A second order effect is to change the pressure and temperature broadened line shapes of the individual ro-vibrational lines, which means that some extra light sneaks through colder, less dense air above warmer denser volumes. The study of line shapes is fascinating. They are not gaussian, but best described as a combination of gaussian and lorentzian with a very small continuum contribution.
Suffice it to say that people have spent lifetimes studying these things and they are well modeled. There is a government/commercial product called HiTRAN which allows one to calculate all these effects.
7 June 2007 at 9:46 AM
Alastair, is this your own theory? Do you have sources supporting the idea you base it on?
I go looking for support but what I find when I search is you saying this in many places, and others disagreeing, like this:
http://forums.edgcm.columbia.edu/showthread.php?t=649
but I haven’t found where you’re getting it from.
7 June 2007 at 10:39 AM
Re 279: Rod B., First, let me state that when I comes to climate science, I am not an expert. I know enough physics to follow most of the arguments up to a certain point, and I find that they make sense based on what I know. For the portions that are too technical for me to follow closely, I have relied on the summaries prepared both by climate scientists and by independent reviewers from outside the field–e.g. the National Academy of Sciences. What is more, I have had the opportunity to meet some climate researchers and discuss issues with them. Suffice to say that radical and rash are not adjectives that apply to them. My question is that given that the climate scientists are not stupid, and that the research they do has been reviewed to death by outside panels without the basic conclusions being significantly changed, and given that the predictions have erred, if at all, on the conservative side, wouldn’t it take a certain temerity on my part to assume that I could tell the community of climate scientists how to do the job that many of them have been doing for >20 years?
I think that what climate scientists find frustrating is the fact that for most of them their real objections arise from the economic or political costs of addressing climate change, while what they attack is the science–which they rarely understand. In my opinion, if one’s objections arise from economics, it would seem to be more profitable to focus one’s efforts toward ensuring that the remediation is economically sound. If from politics, it would seem that ensuring the remediation is narrowly focused and does not verge toward social engineering. Instead, most so-called skeptics attack the science–the easiest point to defend and the place where their offensive weapons are weakest. Not good strategy.
As to your technical objections, the assertions of scientific consensus have nothing to do with any type of vote. Scientific consensus has to do with the strength of evidence–specifically whether it is sufficiently strong to convince the vast majority of experts. The goal is not to convince ALL the experts, precisely because it is realized that some scientists are nuts. In fact any scientist is nuts when it comes to some issues. Einstein was implacably opposed to quantum theory. Should we have said, “Oh, well, don’t try making that laser or that transistor. It needs more study?”
Pressure broadening of spectral lines is well understood and has been measured in the lab. Why should it suspend itself in the atmosphere?
As to your qualms with the “accuracy”–do you deny that significant warming is occurring? Given the effects we are seeing, I would call the estimates of warming conservative if anything? And if you believe that we are seeing significant warming, the question becomes where the energy is coming from. Climate scientists have developed an answer to this question. It is based on known physical mechanisms. It is of sufficient size to explain the effect. The underlying cause is known to be present and is understood as well. Looking back, it also explains a lot about past warming epochs. Pretty much all the evidence is consistent with this mechanism–or is becoming so. There is no alternative explanation that comes close to explaining the mechanism. Models based on this hypothesis have shown good ability to predict effects like the eruption of Mt. Pinatubo. I would argue that by opposing good science when you have nothing better to offer and no concrete objections other than you own suspicion, you undermine your credibility.
7 June 2007 at 11:07 AM
Alastair, what are you talking about when you say, “What is obvious is that radiation changes near the top of the troposphere cannot drive the surface temperature 10 km away!”. This is a gross mispresentation of how these processes work.
Radiation changes at the top of the atmosphere are the result of processes integrated throughout the atmosphere… again, see the above links to the IPCC and to AIP in #290:
The issue here is all about …the flow of heat and radiation up and down through a vertical column that rose from the ground to the top of the atmosphere. You started with the radiation, tracking light and heat rays layer by layer as gas molecules scattered or absorbed them. This was the problem of “radiative transfer,” an elegant and difficult branch of theoretical physics. (from Weart, AIP)
There are a number of ways an excited-state molecule or atom can relax to the ground level (photosynthesis is an area where such concepts are very important).
At low temperature and pressure, there is less opportunity for molecules to collide with one another (think top of the atmosphere). At higher pressures and temperatures, the molecules are more likely to interact, which leads to a broadening of the absorption lines. This is the reason that if you wander into an experimental spectroscopy lab, you will usually find tanks of liquid nitrogen and or helium for immersing samples in - spectroscopists use this effect to get sharper, more discrete spectra (from which more information can be extracted).
So, let’s review Basic Radiation Math (Weart) again:
As for CO2 itself, the old measurements made at sea-level pressure had little to say about the frigid and rarified air in the upper reaches of the atmosphere, where most of the infrared absorption takes place. In the early 1950s precision measurements at low pressure, backed up by lengthy computations, showed that adding more CO2 really would change how the atmosphere absorbed radiation. While the total absorption might not change greatly, the main site of absorption would shift to higher, thinner layers. And as Callendar had explained, shifting the “screen” in the atmosphere higher would mean more radiation going back down to warm the surface.
Here is a figure which reveals the effect for oxygen at the 0, 3, 10 and 20 km levels in the atmosphere. You can see the broad, smooth absorption at sea level, and the ‘picket fence’ effect at high altitudes. The same ‘pressure-temperature band broadening effect’ applies to CO2 (the rate of molecular collisions depends on both temp and pressure). Adding CO2 to the upper atmospheric levels results in increased absorption as a result - one could say that the picket fence is being raised.
One interesting result of all this absorption and emission is that as the troposphere warms due to greenhouse gases, the stratosphere cools. That doesn’t seem to be the only reason the stratosphere is cooling; ozone destruction is also involved. See Why does the stratosphere cool? The stratospheric cooling rules out increases in solar radiation as the cause of global warming. (Keep in mind that the stratosphere is where temperature increases with height - but at low pressure - thus CO2 in the stratosphere helps cool the atmosphere via infrared emission to space. O2 and N2, the main components, don’t have much IR emission - see the figure in the above link).
The basics of these phenomena seem to have been understood some 50 years ago. So why are they brought up over and over again by skeptics and contrarians? Is it all just to create the false appearance of controversy and scientific disagreement?
As far as ‘ad hominem’ arguments (’against the person’) - well, if a person repeatedly ignores factual evidence, distorts basic scientific facts and makes false claims, over and over again, even after being pointed repeatedly to the actual facts of the matter, then they lose credibility. The first rule in science is that you have to be willing to admit error - otherwise, you’re just pushing some position - most likely for political or economic reasons.
7 June 2007 at 11:28 AM
302 Barton, I believe that the standard Atmosphere at 80 N calls for a lower lapse rate at the higher levels of the troposphere. A key here is to look for real time effects of CO2, ideally this is done in prolonged darkness.
304 Alastair, I do know if a segment of the Upper Atmosphere is changed the rest follows, all levels affect each other hydrostatically. A warming in the Upper Atmosphere affects the lower atmosphere. By the Way, many news releases have shown that models underestimated current warming, they were wrong in intensity of the warming but not on the trend.
7 June 2007 at 11:58 AM
Re# 304
Please please please pick up a textbook on radiative transfer……when I have some time I can even recommend some to you.
PS. The higher the temperature the more emission. Google Kirkof’s law it is quite valid for altitudes below about 100km or so. Most of the lab work to verifiy this is decades old. However, Eli Rabbet some days ago gave a good reference even to some nice lab work (Evens and ?) demonstrating very very good agreement between IR radiative transfer calculations and lab observations. Not to mention tonnes of surface radiation balance observations and closure studies (google baseline surface radiation network (BSRN) )
7 June 2007 at 12:32 PM
Actually Astair forget the BSRN it is not as informative as I thought it was….was thinking of some other siye but can not think of it right now.
Anyways…have you ever considered that if IR rad transfer worked like you think it does then how could the atmosphere emitt IR radiation to space at all ? In fact what would stop the temperature of the whole system from ever increasing ?
7 June 2007 at 1:09 PM
Re #312
Hi David,
Some radiation is emitted to space from the surface through the “window”, and CO2 emits radiation at a blackbody temperature of around 220K, but you are right. The surface temperature would go through the roof. This is what has happened on Venus. It stopped rising when the surface melted and the sulphur dioxide clouds formed. The Earth is similar, only the clouds of water are formed by a much lower surface temperature than that on Venus.
Everyone thinks that the climate is driven by a nice simple negative feedback system, but it is not. It can also be chaotic.
7 June 2007 at 1:18 PM
Re #311
I read lots of books on radiative transfer and they are all wrong, except the “Handbook of Atmospheric Science” by Hewitt and Jackson, 2003. They write “Clearly the temperature in the tropsophere does not vary in this way.” p. 44.
Kirchhoff’s Law is not valid for the 30 m of the atmosphere nearest the surface. There the radiation is absorbed and heats the air. It is not re-emitted. Compared with the 100 km you mention 30 m is very insignificant but that is where greenhouse effect works. And that is where we live!
7 June 2007 at 1:24 PM
Re #310
Wayne,
Changes in the pressure of the upper atmosphere can affect the lower surface, but changes in radiation that is absorbed by greenhouse gases are only transmitted 30 m, and can no way reach 10 km down to the surface.
7 June 2007 at 1:34 PM
Re #309
Ike, You quote Weart As for CO2 itself, the old measurements made at sea-level pressure had little to say about the frigid and rarified air in the upper reaches of the atmosphere, where most of the infrared absorption takes place.
But most of the infrared absorption happens at the base of the atmosphere. Just think about the Beer-Lambert Law. it is only solar radiation that is absorbed at the top of the atmosphere.
7 June 2007 at 2:05 PM
Re #307
Hi Hank,
It would be wrong for me to claim that it is all my own thinking since it was Jack Barrett’s paper that gave me the clue. Heinz Hug has also supported Barrett. You will find some of their ideas on John Daly’s site ie http://www.john-daly.com/forcing/hug-barrett.htm . Of course all three of them are out and out sceptics, but I was puzzled how Jack Barrett got a paper published in the peer reviewed journal Spectrochimica Acta 51A, 415-417 (1995). The reason was he had a point. I was already suspicious of the models because they cannot reproduce abrupt climate change. The outgoing radiation scheme is paramaterised and does not use physical laws unlike most of the rest of the code in the GCMs. Therefore, that seemed the most suspect area. It is only now, after five years of research, that I really understand how it is wrong, and how wrong it is!
Here is a link to a short paper I wrote a couple of years ago, with a few references, but never got published. http://www.abmcdonald.freeserve.co.uk/brief/brief.htm
7 June 2007 at 3:08 PM
Re #310 again.
Wayne wrote “By the Way, many news releases have shown that models underestimated current warming, they were wrong in intensity of the warming but not on the trend.” What I am saying is that with my model the greenhouse effect increases in proportion to the CO2, whereas the standard predict that the greenhouse effect will only increase with the logarithm of the CO2 concentration. What you wrote supports my theory - that global warming will be worse than predicted.
Re #311 again
I replied to Eli regarding Evans and Puckrin in post #285. Basically, they don’t address the real issue which is that the bottom 30 m of the atmosphere are not in thermodynamic equilibrium so Kirchhoff’s Law does not apply there.
7 June 2007 at 7:35 PM
# 290 Compare and contrast:-
“At the TOA, the net SW radiation is everywhere partially compensated by outgoing LW radiation (i.e., infrared emissions) emanating from the surface and the atmosphere. Globally and annually averaged, this compensation is nearly exact. The pattern of LW radiation emitted by earth to space depends most critically on atmospheric temperature, humidity, clouds and surface temperature. With a few exceptions, the models can simulate the observed zonal mean of the annual mean outgoing LW within 10 W m-2 (an error of around 5%; see Supplementary Material, Figure S8.7).”
“With a few exceptions”, how droll, no one can accuse the author of not having a sense of humour.
So the models do +/- 10 w m-2 do they.
Hansen, J.E., 2003. The global warming time bomb? Natural Science
“Climate sensitivity is the response to a specified forcing, after climate has had time to reach a new equilibrium, including effects of fast feedbacks. A common measure of climate sensitivity is the global warming caused by a doubling in atmospheric CO2 concentration. Climate models suggest that doubled CO2 would cause 3 °C global warming, with an uncertainty of at least 50%. Doubled CO2 is a forcing of about 4 W/m2, implying that global climate sensitivity is about 3/4 °C per W/m2 of forcing.”
http://www.naturalscience.com/ns/articles/01-16/ns_jeh.html
Doubling is 4.4 w m-2.
Now in most studies the fact that the models resolution is twice the reported signal would mean that the model was classified as “crap”. But I have been led to believe that this is not the case in this field; would these models be classified as “robust”?
———————————————————————–
#309
I note more flim-flam
“Here is a figure which reveals the effect for oxygen at the 0, 3, 10 and 20 km levels in the atmosphere. You can see the broad, smooth absorption at sea level, and the ‘picket fence’ effect at high altitudes. The same ‘pressure-temperature band broadening effect’ applies to CO2 (the rate of molecular collisions depends on both temp and pressure). Adding CO2 to the upper atmospheric levels results in increased absorption as a result - one could say that the picket fence is being raised.”
What you figure shows is that more of the emission spectra of O2 at low altitude can sneak through the gaps between the peaks at high altitude.
Take one line away from the other and you will get another set of picket fences that poke out into space.
—————————————————————–
can someone please tell me if the 14C02 pixie ate up the atmospheric 14Co2 generated by the H-bomb tests, or can someone tell me who it had a half-residence time of a decade while the rest of the CO2 has a half-residence time of 100 years. I am so dumb that I don’t understand how different isotopes of 14C02 and 12Co2 can have different sinks.
—————————————————————–
If the high atmosphere responds to increased levels of CO2 by heating the ground level. Why has the cooling and heating of the South pole been unchanged in the past 50 years, even though CO2 has risen by 30%.
Again, I am so dumb that I don’t know how the CO2 molecules in the atmosphere know that the antartic platau is higher than the majority of the Earths surface and decide not to send IR radiation here. Can someone tell me the mechanism by which the CO2 knows where on Earths surface it should radiate?
7 June 2007 at 8:27 PM
There is a lot of complex and contradictory information presented here on how the greenhouse effect actually works. I would like to step back and describe three different models that encapsulate some of these ideas.
1)The Blanket Model:
Greenhouse gases are like a blanket that trap radiation. There seems to be agreement that water vapor at the bottom 30 m of the atmosphere absorbs most of the longwave radiation from the surface. This models says that is where most of the greenhouse effect takes place. As the amount of carbon dioxide in this layer is low, the implication is that increasing carbon dioxide will make little difference.
Question: Is there any validity to the idea that when a greenhouse gas molecule absorbs radiation, this induces vibration which transfers motion, thus heat, to the surrounding atmosphere?
2) The Reflector:
This model recognizes that when a greenhouse gas absorbs radiation, it re-radiates it in all directions, including up and down. Greenhouse warming is caused by the portion of longwave radiation that is returned to the surface. Adding more greenhouse gas reduces the amount of radiation that is prevented from leaving the Earth and is instead returned to the surface. More of the greenhouse effect takes place higher in the atmosphere where the ratio of carbon dioxide to water vapor is higher, implying that carbon dioxide is a relatively more important greenhouse gas than in the first model.
Question (a) Eli Rabett in #306 talks about the effect of temperature (thus altitude) on emission of radiation from a greenhouse gas. If I understand correctly, this is due to a change in the vibration and rotation states that can occur in the molecule. But how does this affect the intensity of the radiation? Eli also mentions that atmospheric pressure broadens the absorption spectrum. Can this effect under Earth conditions be quantified, ie. is it relevant? I know it is important on Venus.
Question (b) Can the downwelling longwave radiation be measured at the surface? Can we tell from the wavelength which greenhouse gas it came from? Roger Pielke Sr. has a page that appears to do this, using a model rather than measurements. I don’t know if the data reported is accurate, but I think the miniscule effect of increasing carbon dioxide it suggests is not correct.
3) Radiation Balance
The radiation balance model begins with the observation that the temperature of the Earth is determined by the balance between incoming and outgoing radiation. The rate of outgoing radiation is determined by the temperature of the surface. Greenhouse gases effectively raise the radiating surface into the upper atmosphere, which is cooler, so less energy is lost and the Earth warms.
According to this model, the only greenhouse gases that matter are the ones that radiate into space, which are high in the atmosphere. As carbon dioxide is relatively larger compared to water vapor at these altitudes, it is a significant greenhouse gas.
Question: Is it correct that a greenhouse gas molecule radiates less energy when at a lower temperature? I am not sure what Eli means in #291 by “the absorption per molecule at line center is HIGHER for colder molecules.”
7 June 2007 at 9:51 PM
#319
“The rate of outgoing radiation is determined by the temperature of the surface.”
Not true, the rate of outgoing radiation may be proportional to the temperature or it may not at all; it depends on the water vapor pressure, temperature and atmospheric pressure. It is very easy for the atmosphere to unload a lot of heat, with little effect on temperature or to gain a lot of heat with very little gain of temperature. You can heat water/land on a windy day and the temperature remains low, as water evaporates. During the night, at the dew point you can dump alot of heat into space, without increasing the temperature (the temperature can even drop0 as you convert water vapor to liquid water, dropping the pressure.
Water is the key to the relationshop between heat input and temperature, if there is no water you have a high day time temperature and a low night time temperature, hence deserts are hot as hell in the day and cold enough to make icecream at night. In the middle of an equitorial ocean,the day/night swing is less than about anywhere else on the plant.
When your body wishs to loss heat, and maintainits temperature you sweat, excreting salt water (rich in carbonate) on to your surface.
8 June 2007 at 3:12 AM
“Kirchhoff’s Law is not valid for the 30 m of the atmosphere nearest the surface. There the radiation is absorbed and heats the air. It is not re-emitted. ”
Are you saying that the greenhouse gases stop to radiate close to the ground? Any reason for that?
“Here is a link to a short paper I wrote a couple of years ago, with a few references, but never got published. http://www.abmcdonald.freeserve.co.uk/brief/brief.htm”
Are you suggesting that the air close to the ground only are heated by radiation? Ignoring the explaination in the excellent McIlveen book you refered to that the air close to the ground is heated by conduction and micro convection. I dont think he mentions any significant heating from radiation close to the ground or have I missed that?
8 June 2007 at 4:17 AM
Note: Higher pressure==> more collisions ==> Local Thermodynamic Equilibrium. ==> Kirkoff’s law holds. It is only when the collision rate is low can the radiation field temperature and the kinetic temperature of the gas be different.
Section 2.2.2 Breakdown of thermodynamic equilibrium
In Atmospheric Radiation. Theoretical basis, 2nd Ed. R.M. Goody and Y.L. Yung, Oxford University Press, New York, ISBN 0-19-510291-6 (Pbk.)
If you can show what is wrong with this text book then there may be a Nobel waiting for you !
8 June 2007 at 7:47 AM
Alastair, I think that you need to be more precise in your language. To say that the molecules do not re-emit in the lower 30 meters is absurd. If the density of radiation were sufficiently high, they might absorb another photon very quickly, but for that to be true, you would have to have a population inversion, and I don’t think we have much stimulated emission going on. If a molecule absorbs a photon, it enters an excited state, which will have a finite lifetime. If the excited state is vibrational, it is possible that the molecule will relax by mechanical processes–e.g. imparting its extra energy to a neighboring molecule. It is true that this will be more likely where densities are high–e.g. in the lower atmosphere. However, there is bound to be some re-emission, and that re-emission will be isotropic. Moreover, it’s absurd to say only sunlight is absorbed at the top of the atmosphere. Atoms don’t care where they are. The language you are using makes it sound like you don’t understand atomic physics–which I don’t believe for a minute.
8 June 2007 at 8:26 AM
Re #319 Where are you getting your temperature figures for the South Pole from?
Here ?
http://www.antarcticconnection.com/antarctic/weather/hist_wxdata/southpole_station.shtml
which gives an annual average temperature of -48C over the last 32 year
or from here?
http://www.coolantarctica.com/Antarctica%20fact%20file/antarctica%20environment/climate_graph/vostok_south_pole_mcmurdo.htm
which gives an annual average temperature of -49.4C from 1955 to 1988.
In other words the temperature at the South Pole has risen by 1.4C in the last 20 years!
8 June 2007 at 9:18 AM
Re #322 I am not saying that the greenhouse gases stop radiating. In fact they continue to radiated just as they always do. What I am saying is that they absorb more radiation than they emit. This is because the radiation from the surface of the Earth is more intense than the radiation emitted by the greenhouse gases.
I am not saying that the air near the ground is only heated by radiation. Conduction will also play a part. On page 250 of the 1992 edition “Fundamentals of weather and climate” he writes “Consider a package of radiant energy emitted from the Earth’s surface in these heavily absorbed wavelengths [greenhouse gas bands]. It will be completely absorbed by the first 30 m of air, warming first the molecules of water vapour and carbon dioxide, and then almost immediately sharing this heat with the surrounding air molecules.” However, he continues “But by Kirchhoff’s law, water vapour and carbon dioxide must emit these same wavelengths with the same efficiency as they absorb them; …” This defies the law of conservation of energy!
I am saying that in the lower 30 m of the atmosphere Kirchhoff’s law does not apply because the system is not in thermodynamic equilibrium since the air temperature is changing.
All I can say is that no doubt you will find it difficult to accept that Robin McIlveen, Sir John Houghton, Keith Shine, Gavin Schmidt and Ray Pierrehumbert have all got it wrong. But as far as I can see that is the case.
8 June 2007 at 9:50 AM
[[I think that 30 m makes a fair average of your figures, especially if water vapour is included.]]
Not even close. Most thermal radiation from the Earth’s surface, and from layers of atmosphere, is at greater than 4 microns. The peak from Earth’s surface is at 10-11 microns.
[[ The point is that the absorbed radiation is not re-emitted because the excited molecules are relaxed by collisions with the other air molecules. The energy that would go to provide the energy for re-emission has gone to heat the air. It is really quite simple. ]]
It’s simple and irrelevant. The heated air then radiates more than it did before it was heated, and some of that extra radiation goes back down to the ground. Collisional de-excitation does nothing to prevent the greenhouse effect from happening. In fact, since collisional de-excitation happens much more often than energy loss from a CO2 molecule by radiation, most of the greenhouse effect actually works that way. Either way, radiation is absorbed, radiation is given off, and energy is conserved. The arguments of Barrett and Hug (and John Daly, whose site they appeared on) that collisional de-excitation somehow obviates the greenhouse effect is pseudoscience. It’s wrong.
[[What is not so obvious is that increasing CO2 concentration will warm the surface, but it does by conduction. What is obvious is that radiation changes near the top of the troposphere cannot drive the surface temperature 10 km away!]]
Conduction plays a very minor role in vertical heat transport in a planetary atmosphere. And changes at the tropopause do get all the way down to the surface, because the tropopause affects the level just under it, which affects the level just under that, etc. In fact, on Venus, a lot of the reason the surface is so hot is that the clouds absorb infrared so well, and the clouds are almost entirely confined to the top 5% by mass of the atmosphere.
8 June 2007 at 9:59 AM
[[Changes in the pressure of the upper atmosphere can affect the lower surface, but changes in radiation that is absorbed by greenhouse gases are only transmitted 30 m, and can no way reach 10 km down to the surface. ]]
This is just wrong. Changes in radiation at the top level affect the layer under that, which affects the layer under that, etc. Radiation doesn’t have to go all the way from the top to the bottom to affect the bottom. You can see this with a simple multiple-level slab model. Each layer gets radiation only from the immediately adjacent layers, but the more layers you add, the hotter the surface temperature. There is a law of diminishing returns involved, but the effect of one more layer stays significant for a very long time. That’s why Venus modeled with 100 blackbody layers is hotter than with 99. (Try it and see!)
8 June 2007 at 10:12 AM
[[There seems to be agreement that water vapor at the bottom 30 m of the atmosphere absorbs most of the longwave radiation from the surface. ]]
There is NOT agreement on that point! Alastair has repeated it several times, but I don’t know anyone aside from perhaps DocMartyn who would agree with him. As I demonstrated, radiation at Earth’s thermal peak is not 99% absorbed until it has gone almost 8 km. That’s for carbon dioxide. For water vapor, the absorption coefficient in the 12-25 micron range is 0.69 m-1 atm-1, so for a typical water vapor concentration of 0.4%, the transmission path length is 1.7 kilometers. Not 30 meters.
8 June 2007 at 10:50 AM
Re #323 One reason I have not shouted about this more before is that I was worried about someone else grabbing my Nobel Prize!
David, You wrote “It is only when the collision rate is low can the radiation field temperature and the kinetic temperature of the gas be different.” That is what Goody and Yung believe, but it is not correct. If the radiation field is being produced by the surface of the Earth, then it need not be in balance with the kinetic temperature of the air. In fact since the air is heated by the surface its temperature always lags that of the surface.
The easiest way to see this is that there is a region at the top of the atmosphere where radiation out exceed collisions, and at the base of the atmosphere there is a region where radiation in exceeds collisions. So there are two regions of non-LTE, with LTE in between.
8 June 2007 at 11:06 AM
Blair Dowden (#320) wrote:
It gets complicated, and obviously this is an area where I wouldn’t even consider myself an informed layman at this point.
But with that much said, I have picked up a little and looked around a bit. They talk about absorbtion and re-emission taking place within 30 m of the surface. This is true of the radiation which the surface is receiving directly from the atmosphere. However, there is absorbtion and re-emission between the atmosphere and itself, and this will affect the surface,albeit indirectly. As a result, your “blanket” model and your “reflector” model would be two different aspects of the same thing.
With regard to how the vibration and rotation of greenhouse gases are concerned, these determine the wavelength of the radiation itself, but not the intensity. The intensity of the effect is instead determined by how many of the molecules are excited and engage in re-emission (per second, if you wish). The reason is that the excited state itself is quantized, such that the molecules are able to absorb and re-emit radiation only within bands corresponding to the excited state itself.
But then there is also the blurring of the spectra at higher pressures. This is due to the fact that these molecules which are absorbing and re-emitting radiation are in motion as a result of their temperatures, colliding and either losing some amount of energy or gaining some amount of energy prior to absorbtion or re-emission - and as such more or less energy will be required to enter either the excited or grounded state.
While energy is quantized as the result of the uncertainty principle, such as in the case of electron orbitals surrounding the nucleus of an atom due to the uncertainty principle being applied to momentum and position, the uncertainty principle can also be expressed in terms of energy and time, and thus how much energy is lost or gained as the result of such collisions will come into play within the context of absorbtion and re-emission. Or so I would gather.
Now with respect to measuring either downwelling or upwelling radiation, yes, we can most certainly do this. There are a fair number of graphs off the web which show the spectra as measured at certain times of day, altitudes and locations. Some of the graphs are the result of models and some are the actual empirical results. The text should say. Moreover, we are able to distinguish the effects of carbon dioxide, water vapour, etc by where in the spectrum they make their contribution.
Now Pielke is right - about carbon dioxide making a very small contribution near the surface. Doubling it near the surface raises the temperature of the surface and the atmosphere by only a small fraction of one percent. The reason is that there is a great deal more water vapour near the surface than carbon dioxide.
However, he is worse than wrong when suggesting that carbon dioxide is itself negligible in its contribution to the greenhouse effect. This is because while carbon dioxide contributes directly contributes very little to the greenhouse effect near the surface, it contributes a substantial fraction (about one additional degree Celsius when doubled) at higher altitudes in the stratosphere where water vapour is either absent or exists in very small quantities.
Additionally, there is the indirect effect of carbon dioxide on the amount of water vapour in the troposphere. Doubling the carbon dioxide will raise the level of water vapour by a certain amount as the result of warming the surface, then the water vapour will contribute to the greenhouse effect, raising the temperature even more, but a smaller amount each time - in what is essentially a geometric sum until the initial doubling of the carbon dioxide indirectly raises the temperature not one degree but three degrees as the result of water vapour positive feedback.
Now with regard to radiation balance, this principle applies at the surface and at each level in the atmosphere. The amount of radiation entering must equal the amount of radiation coming in if any part of the system is in equilibrium.
But it applies in both directions - such that downwelling radiation being re-emitted by carbon dioxide in the stratosphere is able to have a substantial effect at the surface. And both upwelling and downwelling radiation are important. Upwelling radiation leaving the surface may be absorbed and re-emitted as downwelling radiation in one or more steps and at different altitudes. If this were not the case there would be no greenhouse effect.
Now it is quite possible that I didn’t answer all of the questions you posed. It is also possible that I got one or more things wrong. If so, hopefully someone will correct this. But I believe I was able to answer most of your questions and got most of it right. In any case, the answer is principally that each of the “models” you mentioned are true, but in one way or another, they are describing different aspects of the same thing.
8 June 2007 at 11:10 AM
re 330. “One reason I have not shouted about this more before is that I was worried about someone else grabbing my Nobel Prize!”
Start small. Publish your results/theory. I am sure we all eagerly await your peer-reviewed paper in various physics and atmospheric scientific journals. While the literally thousands of physicists and atmospheric scientists around the world for past decades are all wrong and you are correct.
8 June 2007 at 11:26 AM
PS
There is one more point which deserves emphasis in my response to Blair Dowden (#320): the reason why we focus on carbon dioxide rather than water vapour has to do with their relative lifetimes in the atmosphere. Water vapour will fall out very quickly as the result of precipitation but carbon dioxide will remain in the atmosphere for a very long time. The balance of water vapour maintains itself through precipitation and evaporation. As such, any increase or deficit in water vapour will be largely irrelevant if it is not due to the increase or deficit in some greenhouse gas with a longer lifespan - such as carbon dioxide, as carbon dioxide is the second most prevailent greenhouse gas and has a long lifespan, it should be our primary focus - not water vapour. It is the primary “throttle” which determines the behavior of the system.
I hope this helps.
8 June 2007 at 11:48 AM
Alastair, you are panicking over boundary problems and getting wrapped aroung the axle over linguistic trivialities.
First, very little of the atmosphere is at the boundary with Earth’s surface, and less of it is at the “boundary” with space. The atmosphere IS more or less in equilibrium with the radiation field because the ghg interact strongly with the outgoing radiation from Earth’s surface. Yes, collisional relaxation is important, but if a molecule can relax due to collisions, it can also be excited by them and then decay via emission of a photon. This MUST happen, as otherwise there is no way for energy to get out of the system and temperature would heat up indefinitely–an effect I have not noticed happening. What happens is this: Start with a cool atmosphere and a warm surface. Outbound IR photons are absorbed by the ghg. Some re-radiate, but others are relaxed collisionally until the near surface region is roughly isothermal with the surface. The relatively larger number of ghg molecules in their excited states will radiate more IR photons in that bandwidth, and the atmosphere is effectively net transparent. As you move upward, the atmospheric density and IR photon density both decrease, the mean free path of an IR photon increases and the probability of absorption decreases, but is still finite. Alastair, here’s a hint. The guys who write text books are pretty smart and have generally been doing research in the subject for a lot of years. If you are finding that your answers don’t agree with them and their answers all pretty much agree with each other, who do you think is more likely to be wrong?
8 June 2007 at 12:12 PM
Re “30 meter infrared absorbtion”: It seems that it would be almost trivially easy to test this. Set up an infrared source and detector 30 meters apart, see if the detector registers the source.
I’m not certain from what’s been posted whether you’re saying that all infrared is absorbed, or just particular bands. If it’s all, then the claim is easily disproved by e.g. infrared night vision devices. If major parts of the IR spectrum were absorbed in that short a distance, they’d be as useful as binoculars in a fog bank.
8 June 2007 at 12:22 PM
Re #324: Ray, you said “If a molecule absorbs a photon, it enters an excited state, which will have a finite lifetime. If the excited state is vibrational, it is possible that the molecule will relax by mechanical processes–e.g. imparting its extra energy to a neighboring molecule.” Can you tell me relatively how much energy is lost to neighboring molecules, compared to that which is re-emitted, for a water vapor molecule at sea level? I am trying to understand if this process is a significant part of the greenhouse effect. Because most of the neighboring molecules are not greenhouse gases, I would think that there would be very little re-emission from them.
Re #327: Barton, you said “since collisional de-excitation happens much more often than energy loss from a CO2 molecule by radiation, most of the greenhouse effect actually works that way.” This contradicts what I understood (or maybe mis-understood) from Ray Pierrehumbert. Does this mean that the altitude at which a greenhouse gas molecule radiates into space is relatively unimportant?
Re #329: Barton, sorry for repeating misinformation. Do you have a reference to a table of greenhouse gas absorption coefficients?
8 June 2007 at 12:44 PM
> If major parts of the IR spectrum were absorbed …
http://www.weather.gov/sat_tab.php?image=ir
http://coolcosmos.ipac.caltech.edu/cosmic_classroom/ir_tutorial/irwindows.html
8 June 2007 at 1:57 PM
#328 Barton, layers indeed, some call them Gravity waves, in the small industry refraction business they are called ducts, micro layers, visible through very thick atmospheres at sunset, some have steep lapse rates causing Jules Vernes green flashes. How layers are stacked? What thickness? just what is a natural density layer? Cutting edge subjects.
Alastair has one strong point, amongst others, Polar temperature models are off by 25 years, may be because we don’t quite mimic these layers yet (polar Ocean ice and air are greatly intertwined), I propose any modeller to present Polar projected upper air profiles, especially those of 25 years from now, may be they match current sun disk dimensions. However, whatever it is, something unfortunately is wrong, and it would be good to find out about it real fast.
8 June 2007 at 3:18 PM
Aren’t we into deja vu all over again by now?
Search for the kinds of questions being asked in this thread — they’re repeated.
E.g.
http://www.realclimate.org/index.php?p=193#comment-5233
http://www.realclimate.org/index.php?p=193#comment-5251
8 June 2007 at 3:28 PM
Re: 329 “For water vapor, the absorption coefficient in the 12-25 micron range is 0.69 m-1 atm-1, so for a typical water vapor concentration of 0.4%, the transmission path length is 1.7 kilometers.”
Is this ln I/Io = - abc with I/Io = .01, a= 0.69 m-1 atm-1, b = 1.7 km, and c = 0.004 atm?
8 June 2007 at 6:27 PM
Well, Hank, the questions are repeated, but clear answers are still not forthcoming. I keep hoping.
9 June 2007 at 10:02 AM
Re #333
Can I just say to Tim and Blair that the reason I am concentrating on CO2 is purely because the way it behaves is a lot simpler than H2O, which is far too complicated for a blog. Unlike CO2, H2O varies in concentration from place to place. Moreover it does radiate in continuum mode (ie as a blackbody) as well as lines, some of which interfere with the CO2 lines. It also contains latent heat, and so water vapour carries energy high into the atmosphere, well beyond the limits of even some of the weaker lines that are absorbed by CO2 and H2O.
Moreover, when water vapour condenses, it forms clouds which radiate blackbody radiation both back to the surface enhancing the greenhouse effect, and out to space from a level of the atmosphere where there is little water vapour above it which can absorb, and so helps to cool the atmosphere. Thus each cloud both warms and cools by radiating. This is possibly a simplification too far, since it is generally accepted that high clouds cool the atmosphere and low clouds warm the surface.
Obviously, it follows that water is much more important greenhouse player than CO2, but to explain where the models are handling the outgoing long wave radiation incorrectly, it is easier to talk about an atmosphere where CO2 is the only greenhouse mechanism, and this is what I may have implicitly and explicitly done.
The idea that the persistence of water vapour in the atmosphere somehow affects its potency is a myth that is popular amongst anti-sceptics keen to explain why CO2 is more important than water vapour, despite water vapour playing a greater role. The real answer is that the small effect from CO2 is enough to keep most of the Earth’s surface above freezing point. Remove all the CO2 from the atmosphere and the surface of the Earth would cool, removing pretty well all the water vapour from the atmosphere. Without any greenhouse gases the surface would freze over. This is what may have happened 600 Ma ago when the last Snowball Earth occurred. http://en.wikipedia.org/wiki/Snowball_Earth
9 June 2007 at 11:55 AM
I have heard reference to the cooling both globally and in the Northern hemisphere following the eruption of Pinataubo. Now I know that this placed vast amounts of particulates and sulphur oxides into the atmosphere, cutting the Earths energy input.
I have been looking and can find no statistically valid drop in temperature, either world wide or locally. Given that many people quote temperature changes following the eruption as validating their modelling approach, does anyone have the data to back up this claim?
9 June 2007 at 1:07 PM
DocMartyn and Alastair,
Your comments are disingenuous and seem aimed at creating nothing but false controversy. There are so many errors in you understanding of basic physical processes that it’s pointless to even respond to them more than a few times - such as:
Alastair: “But most of the infrared absorption happens at the base of the atmosphere. Just think about the Beer-Lambert Law. it is only solar radiation that is absorbed at the top of the atmosphere.”
DM: “Have heard reference to the cooling both globally and in the Northern hemisphere following the eruption of Pinataubo… I have been looking and can find no statistically valid drop in temperature, either world wide or locally.”
Alastair: “What I am saying is that they [greenhouse gases] absorb more radiation than they emit. This is because the radiation from the surface of the Earth is more intense than the radiation emitted by the greenhouse gases.”
Anyone who has been reading this site for any period of time knows that these arguments are nonsense. This is just a repeat of previous contrarian efforts to create ’scientific controversy’ and attack the scientific credentials of the authors of this site. Keep in mind that just because someone says “I’m on your side” doesn’t mean it’s so!
Radiative transfer physics sure is complicated, isn’t it? Nevertheless, it’s been fairly well understood for 50 years or so - unless Alastair is the new Einstein. There’s not much in the publication record, however…
9 June 2007 at 1:19 PM
DocMartyn (#343) wrote: