Some of us have been waiting quite a while now, especially since the ‘road tour’ meant to present the Special Report on Managing the Risks of Extreme Events and Disasters to Advance Climate Change Adaptation starting in Oslo on January 24th this year. The summary for policymakers (SPM) was released already in 18 November 2011 (Kampala) and now the report is finally available (link).
Extremely hot
By Stefan Rahmstorf and Dim Coumou
One claim frequently heard regarding extreme heat waves goes something like this: ”Since this heat wave broke the previous record by 5 °C, global warming can’t have much to do with it since that has been only 1 °C over the 20th century”. Here we explain why we find this logic doubly flawed.
One can ask two different questions about the influence of global warming on heat waves (Otto et al. 2012), and we take them in turn.
1. How much hotter did global warming make this heat wave? More »
Data presentation: A trend lesson
I just came across an interesting way to eliminate the impression of a global warming. A trick used to argue that the global warming had stopped, and the simple recipe is as follows:
Updating the CRU and HadCRUT temperature data
The latest incarnation of the CRUTEM land surface temperatures and the HadCRUT global temperatures are out this week. This is the 4th version of these products, which have undergone a number of significant changes over that time and so this is a good opportunity to discuss how and why data products evolve and what that means in the bigger scheme of things.
Misrepresentation from Lindzen
Richard Lindzen is a very special character in the climate debate – very smart, high profile, and with a solid background in atmospheric dynamics. He has, in times past, raised interesting critiques of the mainstream science. None of them, however, have stood the test of time – but exploring the issues was useful. More recently though, and especially in his more public outings, he spends most of his time misrepresenting the science and is a master at leading people to believe things that are not true without him ever saying them explicitly.
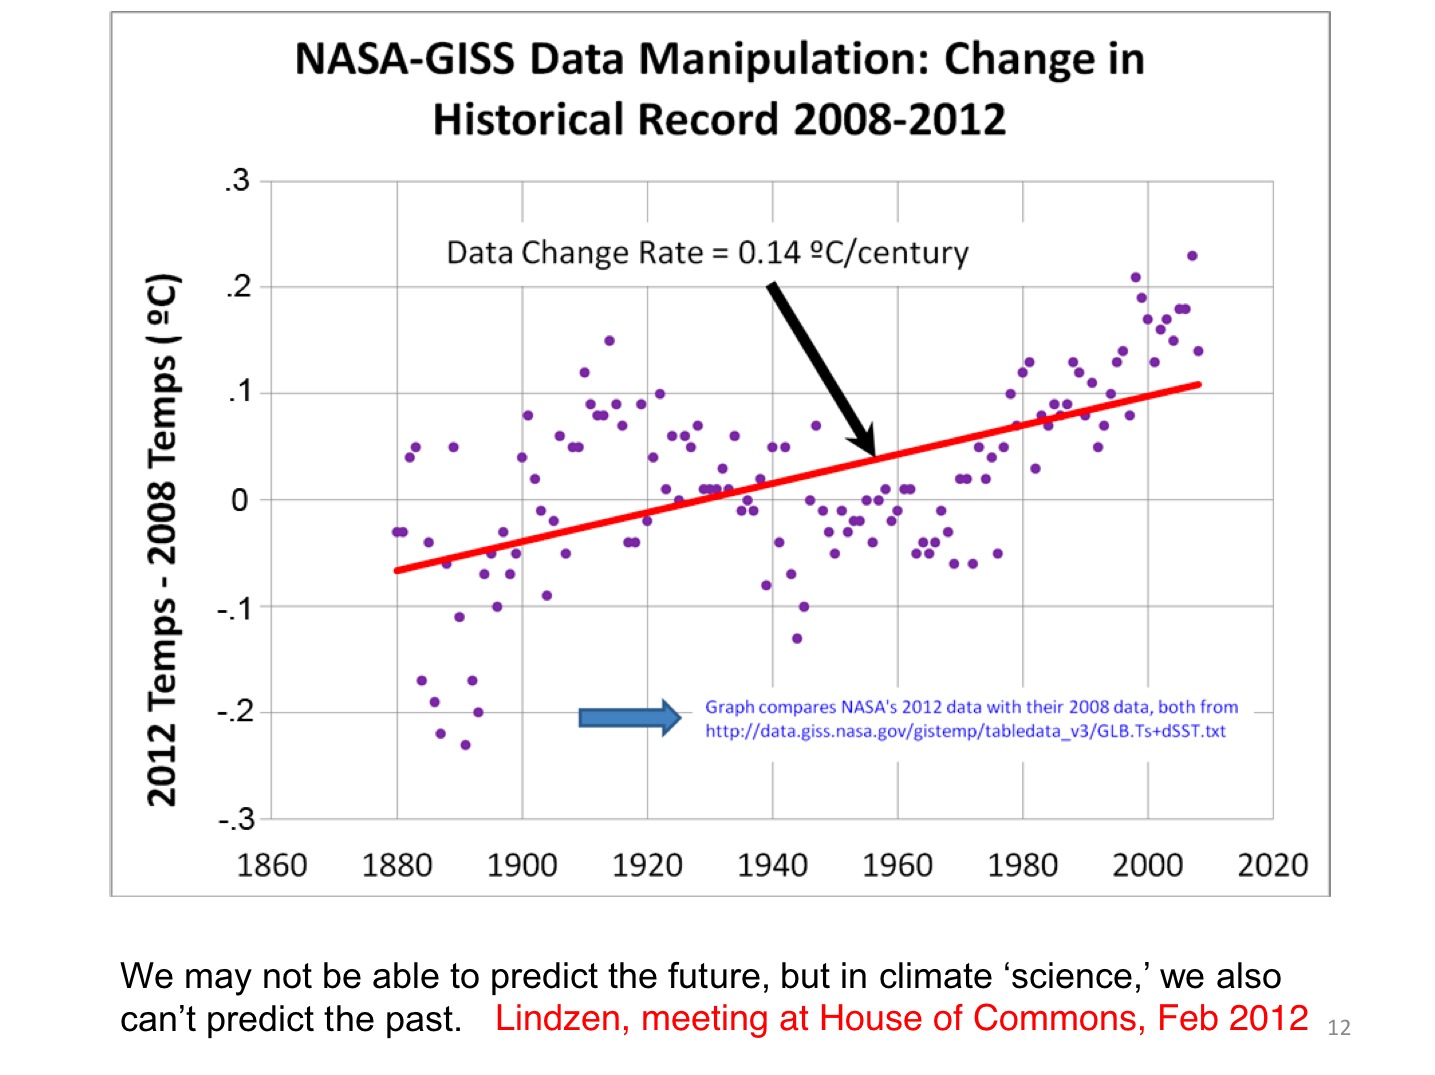
However, in his latest excursion at a briefing at the House of Lords Commons in the UK, among the standard Lindzen arguments was the following slide (which appears to be a new addition):
What Lindzen is purporting to do is to compare the NASA GISS temperature product from 2012 to the version in 2008 (i.e. the y-axis is the supposedly the difference between what GISS estimated the anomaly to be in 2012 relative to 2008). A rising trend would imply that temperatures in more recent years had been preferentially enhanced in the 2012 product. The claim being made is that NASA GISS has ‘manipulated’ (in a bad way) the data in order to produce an increasing trend of global mean temperature anomalies (to the tune of 0.14ºC/Century compared to the overall trend of 0.8ºC/Century) between the 2008 and 2012 versions of the data, which are apparently shown subtracted from each other in Lindzen’s figure. Apparently, this got ‘a big laugh’ at his presentation.
However, this is not in the least bit true: the data are not what he claims, the interpretation is wrong, and the insinuations are spurious.
Unforced Variations: March 2012
This month’s open thread – for appetizers we have: William Nordhaus’s extremely impressive debunking in the NY Review of Books of the WSJ 16 letter and public polling on the issue of climate change. Over to you…