• Skip to primary navigation
  • Skip to main content
  • Skip to primary sidebar
  • Skip to footer

RealClimate

Climate science from climate scientists...

  • Start here
  • Model-Observation Comparisons
  • Miscellaneous Climate Graphics
  • Surface temperature graphics
You are here: Home / 2018 / Archives for May 2018

Archives for May 2018

Does global warming make tropical cyclones stronger?

30 May 2018 by Stefan

By Stefan Rahmstorf, Kerry Emanuel, Mike Mann and Jim Kossin

Friday marks the official start of the Atlantic hurricane season, which will be watched with interest after last year’s season broke a number of records and e.g. devastated Puerto Rico’s power grid, causing serious problems that persist today. One of us (Mike) is part of a team that has issued a seasonal forecast (see Kozar et al 2012) calling for a roughly average season in terms of overall activity (10 +/- 3 named storms), with tropical Atlantic warmth constituting a favorable factor, but predicted El Nino conditions an unfavorable factor.  Meanwhile, the first named storm, Alberto, has gone ahead without waiting for the official start of the season.

In the long term, whether we will see fewer or more tropical cyclones in the Atlantic or in other basins as a consequence of anthropogenic climate change is still much-debated. There is a mounting consensus, however, that we will see more intense hurricanes. So let us revisit the question of whether global warming is leading to more intense tropical storms. Let’s take a step back and look at this issue globally, not just for the Atlantic. [Read more…] about Does global warming make tropical cyclones stronger?
Filed Under: Climate Science, Hurricanes, Oceans

If you doubt that the AMOC has weakened, read this

28 May 2018 by Stefan

A few weeks ago, we’ve argued in a paper in Nature that the Atlantic overturning circulation (sometimes popularly dubbed the Gulf Stream System) has weakened significantly since the late 19th Century, with most of the decline happening since the mid-20th Century. We have since received much praise for our study from colleagues around the world (thanks for that). But there were also some questions and criticisms in the media, so I’d like to present a forum here for discussing these questions and hope that others (particularly those with a different view) will weigh in in the comments section below. [Read more…] about If you doubt that the AMOC has weakened, read this

Filed Under: Climate modelling, Climate Science, Instrumental Record, IPCC, Oceans, Paleoclimate

Transparency in climate science

12 May 2018 by Gavin

Good thing? Of course.*

[Read more…] about Transparency in climate science

Filed Under: Climate modelling, Climate Science, Instrumental Record, Paleoclimate

Climate indicators

6 May 2018 by rasmus

The climate system is complex, and a complete description of its state would require huge amounts of data. However, it is possible to keep track of its conditions through summary statistics.

There are some nice resources which give an overview of a number for climate indicators. Some examples include NASA and The Climate Reality Project.

The most common indicator is the atmospheric background CO2 concentration, the global mean temperature, the global mean sea level, and the area with snow or Arctic sea ice. Other indicators include rainfall statistics, drought indices, or other hydrological aspects. The EPA provides some examples.   

One challenge has been that the state of the hydrological cycle is not as easily summarised by one single index in the same way as the global mean temperature or the global mean sea level height. However, Giorgi et al. (2011) suggested a measure of hydro-climatic intensity (HY-INT) which is an integrated metric that captures the precipitation intensity as well as dry spell length.  

There are also global datasets of indices representing the more extreme aspects of climate called CLIMDEX, providing a list of 27 core climate extremes indices (so-called the ‘ETCCDI’ indices, referring to the ‘CCl/CLIVAR/JCOMM Expert Team on Climate Change Detection and Indices’).

In addition, there is a website hosted by the NOAA that presents various U.S. Climate Extremes Index (CEI) in an interactive way.

So there are quite a few indicators for various aspects of the climate. One question we should ask, however, is whether they capture all the important and relevant aspects of the climate. I think that they don’t, and that there are still some gaps.

[Read more…] about Climate indicators

References

  1. F. Giorgi, E. Im, E. Coppola, N.S. Diffenbaugh, X.J. Gao, L. Mariotti, and Y. Shi, "Higher Hydroclimatic Intensity with Global Warming", Journal of Climate, vol. 24, pp. 5309-5324, 2011. http://dx.doi.org/10.1175/2011JCLI3979.1

Filed Under: Climate impacts, Climate Science, Extras, hydrological cycle, statistics

Forced Responses: May 2018

4 May 2018 by group

The bimonthly open thread focused on climate solutions, mitigation and adaptation. Please keep this focused.

Filed Under: Climate Science, Open thread, Solutions

Unforced variations: May 2018

4 May 2018 by group

This month’s (slightly delayed) open thread on climate science topics.

Filed Under: Climate Science, Open thread

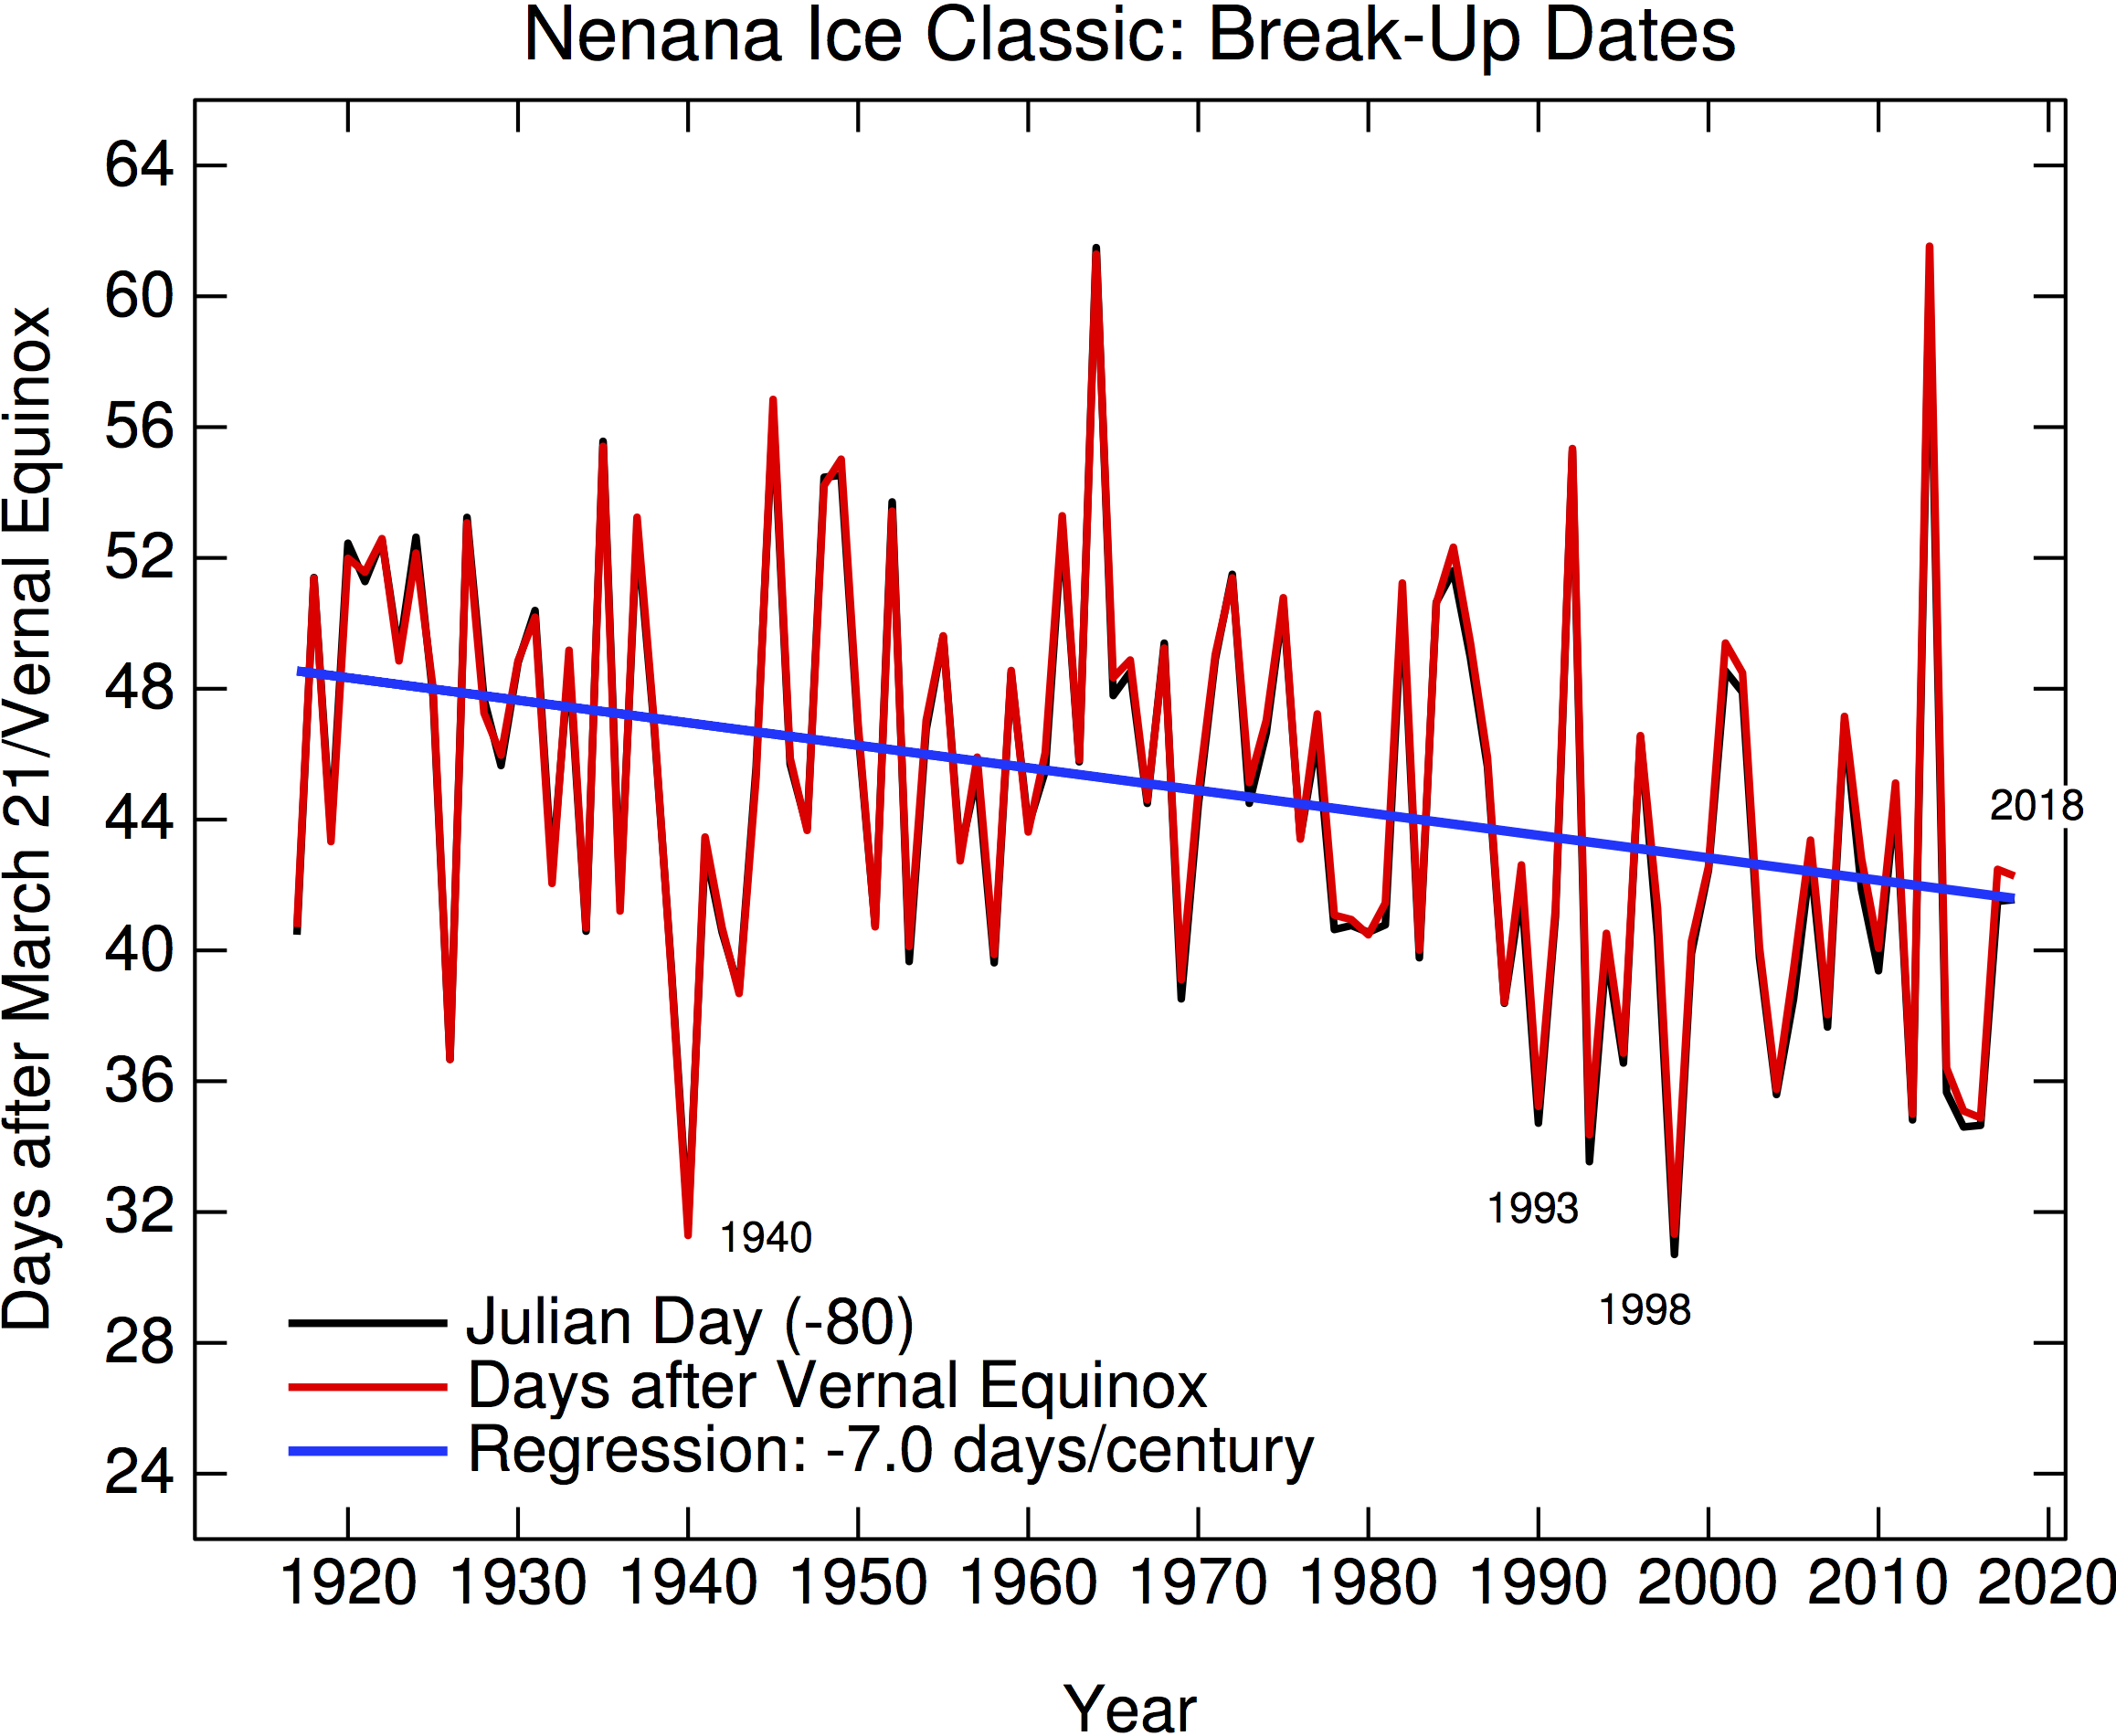
Nenana Ice Classic 2018

1 May 2018 by Gavin

Another year, another ice out date. As in previous years, here’s an update of the Nenana Ice Classic time series (raw date, and then with a small adjustment for the calendrical variations in ‘spring’). One time series doesn’t prove much, but this is of course part of a much larger archive of phenomenological climate-related data that I’ve talked about before.

This year the ice on the Tanana River went out on May 1st, oddly enough the same date as last year, after another very warm (but quite snowy) Alaskan winter.


My shadow bet on whether any climate contrarian site will mention this dataset remains in play (none have since 2013 which was an record late year). [Update: It was mentioned on WUWT!]

Filed Under: Climate Science, Instrumental Record

Primary Sidebar

Search

Search for:

Email Notification

get new posts sent to you automatically (free)
Loading

Recent Posts

  • The most recent climate status
  • Unforced variations: May 2025
  • Unforced Variations: Apr 2025
  • WMO: Update on 2023/4 Anomalies
  • Andean glaciers have shrunk more than ever before in the entire Holocene
  • Climate change in Africa

Our Books

Book covers
This list of books since 2005 (in reverse chronological order) that we have been involved in, accompanied by the publisher’s official description, and some comments of independent reviewers of the work.
All Books >>

Recent Comments

  • Piotr on Unforced variations: May 2025
  • William on The most recent climate status
  • Mr. Know It All on Unforced variations: May 2025
  • Piotr on The most recent climate status
  • Nigelj on Unforced variations: May 2025
  • Kevin McKinney on Unforced variations: May 2025
  • Kevin McKinney on The most recent climate status
  • Kevin McKinney on The most recent climate status
  • Kevin McKinney on The most recent climate status
  • Mr. Know It All on The most recent climate status
  • K on Unforced variations: May 2025
  • Tomáš Kalisz on Unforced variations: May 2025
  • Tomáš Kalisz on Unforced variations: May 2025
  • Piotr on Unforced variations: May 2025
  • Piotr on Unforced variations: May 2025
  • Susan Anderson on Unforced variations: May 2025
  • Ken Towe on The most recent climate status
  • Keith Woollard on The most recent climate status
  • Dan on Unforced variations: May 2025
  • Nigelj on The most recent climate status

Footer

ABOUT

  • About
  • Translations
  • Privacy Policy
  • Contact Page
  • Login

DATA AND GRAPHICS

  • Data Sources
  • Model-Observation Comparisons
  • Surface temperature graphics
  • Miscellaneous Climate Graphics

INDEX

  • Acronym index
  • Index
  • Archives
  • Contributors

Realclimate Stats

1,365 posts

11 pages

243,163 comments

Copyright © 2025 · RealClimate is a commentary site on climate science by working climate scientists for the interested public and journalists.