• Skip to primary navigation
  • Skip to main content
  • Skip to primary sidebar
  • Skip to footer

RealClimate

Climate science from climate scientists...

  • Start here
  • Model-Observation Comparisons
  • Miscellaneous Climate Graphics
  • Surface temperature graphics
You are here: Home / Archives for eric

eric

The Antarctic ice sheet is melting and, yeah, it’s probably our fault.

14 Aug 2019 by eric

Glaciers in West Antarctica have thinned and accelerated in the last few decades.  A new paper provides some of the first evidence that this is due to human activities.

by Eric Steig

It’s been some time since I wrote anything for RealClimate. In the interim there’s been a lot of important new work in the area of my primary research interest – Antarctica. Much of it is aimed at addressing the central question in Antarctic glaciology: How much ice is going to be lost from the West Antarctic ice sheet, and how soon? There’s been a nearly continuous stream of evidence supporting the view that the West Antarctic Ice Sheet is in serious trouble – perhaps already undergoing the beginning of “collapse”, which John Mercer presaged more than four decades ago.

Yet showing that the ice sheet has changed doesn’t really address the question about what will happen in the future. To do that, we also need to answer another one: How much of the ice loss that has already happened is a response to anthropogenic climate change? A new paper in Nature Geoscience this week is one of the first to attempt an answer, and that is what has inspired me to get back to RealClimate blogging. Full disclosure: I’m a co-author on the paper.

In this post, I’d like to provide a bit of context for our new paper, and to emphasize some points about our findings that are generally going to be lost in popular accounts of our work.

The key finding is that we now have evidence that the increasing loss of ice from the West Antarctic Ice Sheet is a result of human activities — rising greenhouse gas concentrations in particular. Now, some may be surprised to learn that this wasn’t already known. But the argument that humans are responsible has rested largely on the grounds that there must be a connection. After all, why should melting have increased only in the late 20th century, precisely when the impacts of anthropogenic climate change were becoming more and more apparent? It seems an unlikely coincidence.

As Richard Alley* put it:

It has been hard to imagine that the ice sat around happily for millennia and then decided to retreat naturally just as humans started perturbing the system, but the evidence for forcing by natural variability was strong.

To be sure, there have been studies suggesting a discernible anthropogenic impact on Antarctic surface temperature, particularly on the Antarctic Peninsula.  And it’s known that the depletion of stratospheric ozone and the rise in greenhouse gases has caused the circumpolar winds to increase in strength. But there has been little direct evidence that what’s happening to the ice sheet itself can be attributed to human-induced climate changes. Consequently, there has been no paper published that makes a strong claim about this. Indeed, a formal solicitation of expert views in 2013 showed that opinion was pretty much evenly divided on whether observed changes to the Antarctic ice sheet were simply part of the natural variability of the climate/ice-sheet system.  In stark contrast, agreement among those same experts was (and is) unanimous that Greenland is melting because of anthropogenic global warming. 

Before getting into what is new in our paper, it’s worth starting with a bit of background on West Antarctica, and a review of the evidence for the role of natural variability. Since not everyone will want to read the play-by-play, I’ve put most of that in a separate post, here. I hope you’ll read it.

In short, glacier melt in West Antarctica has increased because more Circumpolar Deep Water (which is relatively warm) is getting from the ocean surrounding Antarctica onto the Antarctic continental shelf and reaching the floating ice shelves of the large outlet glaciers that drain the West Antarctic ice sheet into the ocean. As shown by Thoma et al. (2008) in a seminal modeling study in Geophysical Research Letters**, how much Circumpolar Deep Water (CDW) gets onto the continental shelf is strongly influenced by the strength and direction of the winds at the shelf edge. Essentially, stronger westerlies (or simply weaker easterlies) tend to cause more CDW inflow, and hence, more glacial melt.

Because of the important role played by the winds, many have assumed that there must be a link between the melting glaciers and the ozone hole. But the greatest control on wind variability along the coast of West Antarctica is the state of the tropics. Just as El Niño event causes widespread climate anomalies in the Northern Hemisphere — such as increased rainfall in southern California — it also causes changes in the West Antarctic. Indeed, the Amundsen Sea, where the largest West Antarctic glaciers are, is one of the areas on the planet that is most strongly dependent on the El Niño-Southern Oscillation (ENSO) (e.g. Lachlan-Cope and Connolley, 2006). In 2012, we published a paper showing that changes in the winds in this region in the last few decades, which correspond well with variations in the glaciers, are very well explained by changes in ENSO, and very poorly by changes in ozone. We also noted that because big ENSO events had occurred in the past, it was quite plausible that wind conditions not that different than those of today had also occurred in the past. Indeed, we have very good evidence from ice cores that climate conditions in West Antarctica in the 1940s were not very different than those in the 1990s.

It is clear from this work, and much other recent research, that ENSO plays a dominant role in determining the climate conditions in West Antarctica that are relevant to the ice sheet. And since there is little evidence for a long-term anthropogenic change in ENSO, this implies that natural variability in Amundsen Sea winds (driven by natural variability in ENSO) may be the primary driver of observed ice-sheet change in West Antarctica in the last few decades. This is what Richard Alley is referring when he says that the evidence for forcing by natural variability was strong, and it throws a lot of cold water (no pun intended) on the purported link with human activities. But that’s not very satisfying. It doesn’t answer the question of why glacier retreat is occuring now. This is where our new paper comes in.

The new work is led by Paul Holland of the British Antarctic Survey (BAS), with help from Tom Bracegirdle, Adrian Jenkins (also of BAS), Pierre Dutrieux (now at LDEO) and myself. What we argue, in brief, is that although ENSO does indeed dominate the wind variability in the Amundsen Sea on timescales from interannual to multi-decadal, there is also a longer-term trend in the winds, on which the ENSO-related variability is superimposed.

The graph below (Figure 1) summarizes the key finding. What is shown are the winds in the key sector of the Amundsen Sea, centered on ~71°S and ~108°W, with observations in blue, and model results in black and gray. The model results are from an ensemble of simulations, referred to as the “tropical pacemaker” or “PACE” runs, of the CESM climate model. Details are given in Schneider and Deser (2017). Briefly, what has been done is to adjust an otherwise free-running climate model (forced by greenhouse gas emissions) so that it follows the actual history of sea surface temperature in the tropics, but is otherwise left unconstrained by data. We use these experiments as an estimate of how winds have varied over the last century in the Amundsen Sea, a) given what we know happened in the tropics and b) given what the climate model’s physics dictates about how conditions in the tropics affect the Amundsen Sea. Critically, there is nothing done to make the model match observations outside the tropics. Yet the results are in superb agreement with the observed Amundsen Sea winds. While we can never know exactly what happened prior to the advent of satellite observations in the late 1970s, the PACE ensemble provides a set of histories that is plausible, and compatible with modern data. This is probably the best current estimate of how winds have in fact varied in this region.

Figure 1. Zonal wind speed (positive = westerly, negative = easterly) over the continental shelf edge in the Amundsen Sea, Antarctica, since 1920. Observations (ERA-interim data) are in blue. Model results in black (average) and gray (individual ensemble members) are from the tropical pacemaker (PACE) experiments with the CESM climate model, from Schneider and Deser (2017). The dashed line shows the average trend. From Holland et al., 2019.

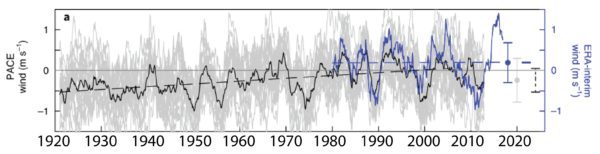
What Figure 1 suggests is that the winds in this region have varied between easterly and westerly from decade to decade, throughout the 20th century. This is the natural variability associated with ENSO, and is no surprise. But in addition, there is a long-term trend. When averaged over several decades, the winds can be seen to have shifted from mean easterly in the 1920s through 1980s, to mean westerly thereafter.

The trend in the winds is small, and easily lost within the variability of individual model ensemble members, but it is robust (it occurs in all the ensemble members) and statistically significant. Moreover, we know its cause (at least in the model experiments): radiative forcing. Although these experiments also include radiative forcing changes resulting from the ozone hole, it’s clear that the trend in the winds begins well before ozone depletion begins in 1970s. Thus, the key forcing is greenhouse gases.

These results show that variations in the winds that have occurred at the same time as we have been observing the glaciers retreat (i.e., since the 1970’s) are largely attributable to ENSO, as we had thought. But at the same time, the prevalance of strong westerlies in the Amundsen Sea has gradually increased throughout the 20th century. That is, although anomalous westerlies tend to occur most often during an El Niño, the long-term underlying trend means that the likelihood of strong westerlies in any given year is increasing, regardless of whether there is an El Niño or not. Thus, the radiatively-forced change (the trend) accentuates the effect of the natural variabilty (ENSO). As we wrote in the paper, the recent wind anomalies of the last few decades “…reflect Pacific variability that is not at all unusual…. However, when superimposed on the anthropogenic trend, this variability produces periods of absolute westerly winds that are sufficiently anomalous to account for much of the current ice loss.”

Now, a couple of caveats:

First of all, our finding are “simply” the result of looking at climate model simulations. We don’t know exactly what happened in the Amundsen Sea in the last century. On the other hand, Figure 1 looks very much like the data from ice cores from West Antarctica: variability that can be related to ENSO, superimposed upon a long-term trend. (See e.g. Schneider and Steig, 2008 and Steig et al. 2013 for details.)

Second, we are assuming that the Amundsen Sea shelf-edge winds are indeed the most relevant aspect of the system to consider. Again, this is based on the body of work showing that the inflow of CDW onto the Amundsen Sea continental shelf is strongy controlled by these winds. But the physics linking wind variability and CDW inflow is complex, and not everyone agrees with our view on this. Indeed, it is most certainly an oversimplification. Furthermore, as many authors has emphasized, there are complex feedbacks and internal ice-sheet and glacier dynamics involved, and it’s not as if there is a one-to-one relationship between changing winds and glacier retreat. For an excellent discussion of this, see the paper by Christianson et al. (2018).

Third, even without the first two caveats, we are far from proving that the ongoing ice loss from Antarctica can be attributed to human-induced climate change. The challenge here is that the natural component of the wind variabilty is so large that actually detecting (with direct observations) the trend inferred from the model results is not likely to be possible for some time. As we say in the paper, “Decadal internal variability therefore dominates ice-sheet and ocean variability during the modern observational era (since 1979), and will continue to dominate observations for decades to come.” We are not likely to find the smoking gun any time soon.

That all said, our findings are supported by other experiments. It is not only CESM, which is the main focus of the paper, that shows a long-term trend in the winds. In fact, most climate models (i.e., “CMIP5” — see details in our paper) show the same thing. Also, we find that the better the agreement between a given model and observations, the stronger the trend. (Note that the wind speeds shown in the figure above are not anomalies. These are the actual modeled and observed wind speeds. As it happens, CESM has unusally low bias in comparison with observations.)

Finally, our findings provide an important opportunity to glimpse into the future. We examined additional results with CESM, from the so-called “Large Ensemble” (LENS) and “Medium Ensemble” (MENS) set of experiments. These are identical to those of the PACE set-up but without the constraint to follow the observed tropical sea surface temperature. The results are illustrated in Figure 2, below.

Figure 2. Zonal wind speed (positive = westerly, negative = easterly) over the continental shelf edge in the Amundsen Sea, Antarctica, since 1920, and projecting through to 2100. Results are from the “Large Ensemble” (LENS, in black), using known greenhouse gas and other radiative forcing for the past, and “business as usual” RCP 8.5 radiative forcing scenario in the future. Also shown are results from the “Medium Ensemble (MENS) (in red) which uses lower (RCP 4.5) radiative forcing for the future. Gray shows the individual ensemble members from LENS. From Holland et al., 2019. Error bars show the standard deviation of wind anomalies (solid) and the magnitude of historical and projected trends (dashed).

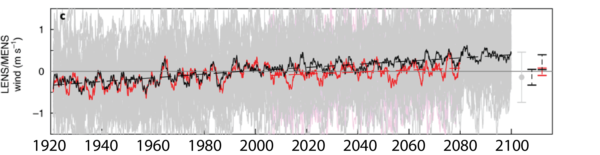
The ensemble mean trend in the LENS experiments is nearly identical to that of the PACE experiments, which further demonstrates that the trend is not part of the natural variability. Comparison between the LENS experiments, which uses the “business-as-usual”*** RCP 8.5 IPCC scenario for the future, and MENS, which uses RCP 4.5, shows that reducing greenhouse gases reduces the future trends.

This is a big deal! Although we humans have evidently caused a long-term increase in westerly winds along the Amundsen Sea coast (which is bad for the West Antarctic ice sheet), the future is not yet written (which is an opportunity). Lowering greenhouse gases to a more modest rate of increase might be enough to prevent further changes in those winds.

Of course, many glaciologists believe we have already passed the point of no return for West Antarctica. I personally think the jury is still out on that. But that’s a discussion for another time.

*The quote from Richard Alley is from a National Geographic article about our paper.

**Not all the most important papers are published in Nature or Science.

***Some people think calling RCP 8.5 “business as usual” is misleading. Hence the quotes.

Filed Under: Climate Science

Background on the role of natural climate variability in West Antarctic ice sheet change.

14 Aug 2019 by eric

This is a summary of some of the key details that underpin the discussion of anthropogenic vs. natural forcing in driving glacier change in West Antarctica. This is useful background for the paper by Holland et al. (2019), discussed in another post (here).

We’ve known for some time that Pine Island Glacier (PIG) and Thwaites Glacier, the two largest of several fast-moving outlet glaciers that drain a large fraction of the West Antarctic ice sheet (WAIS) into the Amundsen Sea are critical to the stability of the ice sheet as a whole. Way back in 1979, Terry Hughes argued that these glaciers make the WAIS susceptible to large-scale collapse, which almost certainly occurred during some previous interglacial periods and contributed several meters to sea level rise. In the mid-1990s it was discovered that melt rates under the floating portion of the glaciers was orders of magnitude greater than previously assumed (Jacobs and others, 1996). Shepherd and others (2002, 2004) showed that this melting at the margin had resulted in thinning upstream, and retreat of the grounding line (the point at which the glacier goes afloat). It quickly became obvious that melt rates must have increased in the preceding few decades. Otherwise these glaciers would already have retreated even further. The culprit was suspected to be the increased inflow of Circumpolar Deep Water (CDW) on the Antarctic continental shelf, where it contacts the floating margins of the glaciers.

These ideas were validated in 2010 by direct observations made by an autonomous underwater vehicle under the PIG ice shelf (note: an ice shelf is the floating portion of a glacier; it should not be confused with the continental shelf). The submarine observations (Jenkins and others, 2010) showed that CDW was flooding the cavity below PIG, >30 km upstream of areas that were at least partially grounded as recently as the early 1970s. Although CDW is just a few degrees above freezing, it provides enough heat to melt the ice from below at rates in excess of 50 meters (vertical) per year. Independent estimates derived from satellite observations of ice speed and thinning rates (e.g. Rignot and others, 2008) agreed well with such numbers, sealing our basic undestanding of what was going on.

Now, the reason that glacier melt in West Antarctica has increased is not because Circumpolar Deep Water itself is getting warmer (although it probably is). Instead, it’s clear that more CDW is getting from the ocean surrounding Antarctica onto the Antarctic continental shelf and reaching the glacier margins. As shown in a seminal modeling study in Geophysical Research Letters (Thoma et al., 2008), how much CDW gets onto the shelf is strongly influenced by the strength and direction of the winds at the edge of continental shelf. It is useful to picture this as wind-driven upwelling (Ekman pumping). Westerly winds (blowing fromthe west) along the edge of the continental shelf divert cold surface waters northward because of the Coriolis effect. This surface water is replaced by the upwelling of warm water from below. The upwelled CDW then makes it’s way along the continental shelf and up to (and below) the floating ice shelves. While this picture is greatly oversimplified*, the essential insight is that stronger westerlies (or merely weaker easterlies) along the shelf edge should tend to cause more CDW to get onto the shelf. Numerous modeling studies since the original Thoma et al. work have supported this. Perhaps more important, it’s been verified by observations (more on that below).

Many scientists have assumed that there must be a link between the melting glaciers and the ozone hole. In fact, I got into this area of research partly in response to a press conference given by a well-known glaciologist who made such a claim in response to a reporter’s question, around 2010. We know that ice in West Antarctica is melting from below because it is bathed in warm Circumpolar Deep Water, and that more Circumpolar Deep Water gets onto the continental shelf when the local continental-shelf-edge winds are more westerly. We also know — as I noted above — that the strength of the westerly circumpolar winds around Antarctica has increased, in part because of the depletion of stratospheric ozone. It’s easy to link these separate ideas, but this links largely falls apart under scrutiny. The problem is that these are not the same winds! The circumpolar wind belt is centered around 52°S, very far north of the area of shelf-break winds that Thoma et al. (2008) wrote about, which are centered on about 70°S in the Amundsen Sea. Moreover, there is no correlation between the winds in the Amundsen Sea region and the Southern Annular Mode (SAM) index, a widely-used measure of the strength of the circumpolar westerlies. And the seasonal timing is wrong — the Amundsen Sea winds have increased largely in winter and fall, whereas the influence of the ozone hole is limited to spring and summer.

If it’s not the ozone hole, then what has caused the local winds to change, and to bring more CDW onto the continental shelf (if indeed this is what has happened)? Well, that’s where much of my own work, and that of my coauthors on the new paper, has focussed in the last few years. In 2012, we published a paper articulating the problems with the ozone-hole argument, and pointing out that a much better explanation for the recent glacier changes in West Antarctica was forcing from the tropics. The greatest control on wind variability in the Amundsen Sea is the state of the tropics, which can be characterized roughly by the state of the El Niño-Southern Oscillation (i.e., whether it is a neutral, El Niño, or La Niña year). Just as El Niño event causes widespread climate anomalies in the Northern Hemisphere — such as increased rainfall in southern California — it also causes changes in the West Antarctic. Indeed, the Amundsen Sea is one of the areas on the planet that is most strongly dependent on ENSO (e.g. Lachlan-Cope and Connolley, 2006). Our work showed that the changes in Amundsen Sea winds that had occurred over the last few decades were very well explained by changes in ENSO. We also noted that because big ENSO events had occurred in the past, it was quite plausible that wind conditions not that different than those of today had also occurred in the past.

A number of other papers have supported these findings. Dutrieux et al. (2014) showed that CDW flow onto the shelf, and ice-melt rates under the PIG, decreased during a major La Niña event. Smith et al. (2017) showed evidence that the PIG ice shelf retreated right around the time of really big El Niño event of 1941 (as we speculated in our 2012 paper), and Hillenbrand et al. (2018) showed that CDW may have first begun to flood the Amundsen Sea at about the same time. Finally, Paolo et al. (2018) showed that the influence of El Niño events on West Antarctic glaciers could be measured by satellite observations: El Niño events tend to be correlated with both increased melting from below, and increased snowfall above, and the variations in the altitude of the ice sheet surface (varying by a few tens of cm) can be detected by satellite altimetry.

In short, a lot of research has demonstrated the importance of ENSO in determining conditions in West Antarctica. This has meant that we cannot rule out the idea that natural variability in Amundsen Sea winds, driven by natural variability in ENSO, as the primary driver of observed glacier retreat in West Antarctica.

Our new paper makes the case that while ENSO dominates there is a significant anthropogenic component as well. See the main post on our new paper in Nature Geoscience, here.

*Ekman pumping is actually too weak to account for the observed flow and the reality is quite a lot more complex. For more details on this, see e.g. Arneborg et al., 2012, and Nakayama et al., 2018.

Filed Under: Climate Science

So what is really happening in Antarctica?

10 Nov 2015 by eric

The recent paper by Zwally et al. in the Journal of Glaciology has been widely reported as evidence that Antarctic is gaining mass, and hence lowering sea level. Is it? Expert Jonathan Bamber weighs in.

Guest post by Jonathan Bamber, University of Bristol

There have been quite few big media stories related to Antarctica recently, including a paper on the irreversible collapse of the marine portion of the West Antarctic Ice Sheet and a NASA-funded study that finds, contrary to numerous previous results, that the Antarctic ice sheet as a whole has been gaining mass between 1992 and 2008. This most recent study received a lot of media attention because it runs counter to what was said in the last IPCC Report. Certain parts of the media hailed this as another sign that the impacts of climate change had somehow been exaggerated a risk that the lead author Jay Zwally was concerned about before the research was published.

So what did Zwally and his colleagues do, what did they find, and why does it contradict a plethora of previous studies that suggest Antarctica has been losing mass over the same time period?
[Read more…] about So what is really happening in Antarctica?

Filed Under: Climate Science

How long does it take Antarctica to notice the Northern Hemisphere is warming?

29 Apr 2015 by eric

Eric Steig

A series of large and abrupt climate changes occurred during the last ice age, most clearly expressed in ice cores from Greenland and other paleoclimate data from the circum-North-Atlantic region. Since the discovery of these events, we’ve been trying to pin down the timing of abrupt climate changes elsewhere on the globe. Were there corresponding events in the Southern Hemisphere? And did they occur at the same time? A new paper published this week in Nature (April 30th, 2015) provide a significantly updated answer to these questions. Many in the climate research community — both modern climate and paleoclimate — will find the results quite interesting.

The new paper is the culmination of a huge effort to develop the best-dated long ice core record from Antarctica, rivaling the GISP2 and GRIP ice cores obtained from central Greenland in the early 1990s, and the more recent NGRIP and NEEM cores from North Greenland (e.g. NEEM Community Members, 2014). The core was obtained at the West Antarctic Ice Sheet divide (WAIS Divide), led by the Desert Research Institute and the University of Nevada, with the University of New Hampshire. The new paper was written by a consortium of postdocs, faculty, and students at the Oregon State University and University of Washington: Christo Buizert, myself, and Joel Pedro (now at University of Copenhagen), with Brad Markle, Ed Brook, Jeff Severinghaus and Ken Taylor. We have more than 70 other co-authors — faculty colleagues, students, postdocs, logistics coordinators, and ice-drillers — who all made substantial contributions as well. These deep ice cores are a lot of work!

We published records from the WAIS Divide ice core in 2013, covering the last two millennia and the last 30 thousand years (Steig et al., 2013, WAIS Divide Project Members, 2013). Our new work, WAIS Divide Project Members, 2015, extends the record to the bottom of the core (nearly the bottom of the ice sheet at 3400 m depth), and an age of 68 thousand years. Details on the timescale for the core are given in the open-access paper in Climate of the Past (Buizert et al., 2015). The new paper in Nature provides a comparison of the timing of changes in Antarctic temperature with the timing of the abrupt warming and cooling events that characterize the Greenland ice core records. Note that the comparison is actually made between the records of oxygen isotope ratios (δ18O), but we have very strong evidence that these track temperature quite faithfully on the relevant timescales, so I’ll use “temperature” here for simplicity.

The abrupt events in Greenland, characterized by rapid transitions from cold “stadial” to warm “interstadial” conditions and back, and commonly known as Dansgaard-Oeschger (D-O) events, were felt across the Northern Hemisphere almost immediately, as far as we can tell. But the impact of D-O events in Antarctica has been ambiguous. We’ve known for some time that temperatures in Antarctica change more slowly, and with much smaller amplitude, than in the Northern Hemisphere. In general, the Antarctic temperatures begin to decline when Greenland warms abruptly, and to increase when Greenland cools abruptly (Blunier et al., 1998). This relationship is often called the “bipolar seesaw” and is commonly attributed to the redistribution of heat between the Northern and Southern Hemispheres via changes in the Atlantic meridional overturning circulation (AMOC). We’ve also been pretty sure that each of the D-O interstadials has a corresponding warm peak in Antarctica, referred to as the “Antarctic Isotope Maximum” (AIM) events (EPICA Community Members, 2006, and Stefan Rahmstorf’s write-up in an earlier RealClimate post). But the exact phase relationship has been unknown, making it problematic to validate model simulations with confidence (see e.g. Roe and Steig, 2004, Steig, 2006).
WAIS_Divide_record

The first paper to really start to pin down the phase relationship was that of Pedro et al., 2011, who showed that the most recent of the major abrupt events in Greenland cores (the Bølling warming about 14,700 years ago and the Younger Dryas cooling about 12,880 years ago), the direction of Antarctic temperatures changed at almost exactly the same time. (Note that the Antarctic temperatures don’t change abruptly — their slow trends simply reverse sign, as shown in the figure). But the uncertainties estimated by Pedro et al. were about 200 years on either side of zero. That’s impressively good precision for something that happened more than 10,000 years ago, but not quite good enough. Our new work firms up these numbers a lot, and shows that Antarctic temperatures did not really change at the same time as the abrupt events in Greenland. Instead, when an abrupt D-O warming occurs in Greenland, it takes about 200 years until the concomitant cooling begins in Antarctica. Similarly, when an abrupt cooling occurs in Greenland, it takes about 200 years until Antarctic starts warming up. Our uncertainties are much smaller, +/-95 years*, and it is very unlikely that our numbers overlap with zero. Antarctica, in other words, almost certainly takes a century or two to notice what is happening in the Greenland.

WAIS_Divide_timing
The 200-year timescale is fascinating, because it is longer than suggested by a number of modeling studies, such as the simple “bipolar seesaw” model of Stocker and Johnson, 2003, as well as the fully-coupled transient run of a general circulation model by He et al., 2013: both show an essentially instantaneous response between the Northern Hemisphere and the Antarctic. Yet it’s also shorter than implied by many discussions of the relationship; for example, we (Steig and Alley, 2002) made the case for a 400-year lag between Greenland Antarctica, which Schmittner et al., 2003 reproduced in a climate model in which the AMOC is perturbed.

So what does the intermediate timescale of ~200 years tell us? It’s important to recognize that there are reasons why one might expect either a “fast” propagation or a “slow” propagation of the Greenland climate signal to the Antarctic. The very large sea ice changes in the North Atlantic associated with D-O events would have an impact on the atmosphere, and this should propagate global signals almost instantaneously. Indeed, this must have occurred, or we wouldn’t have the evidence that we do for abrupt changes in places as far flung as China, India, or the tropical Pacific that are in phase with Greenland temperature change. Methane variations, which are probably of tropical origin, are in phase with Greenland temperature within about 20 years (e.g., Rosen et al., 2014).

The ocean itself can propagate signals very fast, via adjustment of the upper ocean by fast Kelvin waves propagating along the ocean boundaries (e.g. Johnson and Marshall, 2002). For example, Schmittner et al. (2003), and Rind et al. (2001) both found that the North Atlantic signal in their models propagates to the South Atlantic region very quickly, appearing in subsurface waters with a time lag of only about a few decades. However, they also find a century or multi-century delay in the further southward propagation from the South Atlantic to the Antarctic across the Antarctic Circumpolar Current (ACC). Furthermore, the propagation time varies with the strength of the ACC as imposed in the model.

There are, in short, multiple parts of the ocean and atmosphere system involved, and these have different timescales. It appears that our results are right about where the physics suggests they should be. A key factor in capturing this physics properly in models seems to be how (or how well) the ACC is simulated. That’s interesting, and highly relevant to modern climate studies. How the ACC is changing now, or may change in the future, is a topic of significant interest (Fyfe and Saeko, 2005; Böning et al., 2008). And the question of how long it will take the Antarctic to catch up with the rest of the globe is of critical importance to long term projections of the response of the ice sheet to climate change — and hence the response of sea level. The D-O events and the current anthropogenic global warming are of course very different beasts, but the long timescales indicated by our results are certainly in keeping with climate model projections of the future, showing that most of Antarctic should lag the rest of the planet (recent rapid warming on the Antarctic Peninsula and West Antarctica not withstanding).

Note that our results should not be taken as demonstrating anything very specific in terms of the cause of Dansgaard-O events. To be sure, the results demonstrate a clear north-to-south direction in the propagation of the climate signal associated with abrupt D-O warming and cooling events. But that doesn’t tell us what the driving “trigger” is. To use an analogy suggested by co-author Severinghaus, suppose we didn’t know anything about the physics relating lightning to thunder. Careful measurements of their relative timing would reveal that thunder always occurs very soon (or immediately) after lightning. But hearing thunder gives you only a general prediction of when the next lightning will be observed. One would correctly deduce that lightning causes thunder. That’s progress. But it would not tell you the cause of the lightning in the first place.

For my part, I’ve long been a skeptic about the old idea that the D-O variations are ultimately driven by meltwater and/or iceberg fluxes into the North Atlantic (the Day after Tomorrow scenario, if you will). There are only 6 clearly-identified Heinrich events (that is, layers of terrestrial sediment in ocean sediment cores from the North Atlantic, evidence for massive iceberg discharges from the Laurentide ice sheet) but there are at least 23 D-O events. It more likely that there is intrinsic variability in the coupled ocean-atmosphere system, as found for example in a long simulation with the climate model CCSM4 by Peltier and Vettoretti (2014 and 2015) (though there is debate about the validity of the very low values for ocean vertical mixing used in those simulations). Iceberg discharges are then just the consequence, not the cause, of changes in ocean circulation, as argued recently by Alvarez Solaz et al. (2013) and also suggested by Barker et al. (2015) who found that on average, evidence for icebergs in the North Atlantic follow, rather than precede, the abrupt coolings at the end of some D-O events. That doesn’t mean that the huge ice and meltwater fluxes associated with Heinrich events don’t have an impact; most modeling work suggests that they would. But it may be important in this context that our results show no dependence of the ~200-year lag on whether or not a Heinrich event has occurred: that is, there is no evidence that “Heinrich stadials” (the cold periods during which Heinrich events occur) are unusual with respect to ocean “seesaw” dynamics. The role of these events in millennial scale variability therefore remains an important, and open, research question (see e.g., Margari et al., 2010).

In the meantime our precise observations of the phasing of D-O and AIM events provide an important new constraint against which to validate model simulations designed to capture the dynamics of these interesting features of the climate system.

UPDATE: The News & Views article about our article, by Tas van Ommen is worth a read. Available here (subscription based only, I’m afraid).


Notes. *The ability to obtain such small uncertainties is owing to four main things. First, we have very high resolution measurements of methane in both the WAIS Divide and the Greenland cores; methane is globally well mixed, and so abrupt changes in methane must happen at the same time (within a year) in cores from both regions. This means that we can synchronize the age of the gas trapped in the bubbles within the cores very precisely. Second, we have very high resolution measurements of the nitrogen isotope ratio (15N/14N in atmospheric N2), also trapped in the bubbles in the cores. This isotope ratio provides information on the age difference between the gas and the ice, because gravitational settling increases the 15N/14N ratio; this depends on the thickness of the firn (the permeable ice between the surface and the impermeable ice at depth where bubbles are trapped). The deeper the firn, the longer it takes to trap gases, and the larger the age difference. It’s the age of the ice that we’re actually interested in, because this, not the gas trapped within the ice, is what the δ18O measurements are made on. Fourth, this age difference is much smaller at WAIS Divide than in any other long Antarctic record; it is at most ~500 years, compared with e.g., ~4000 years at Vostok. Finally, we also have unprecedentedly high resolution measurements of δ18O, and very high quality borehole temperature measurements, which together provide a very robust measure of the temperature variations through time.

Data: The data from the paper are all available in the Supplement to the paper. The timescale and the oxygen isotope data from our lab — what most people will be interested in — are available at the National Snow and Ice Data Center, at doi:10.7265/N5GT5K41.

References:

Barker, S., J. Chen, X. Gong, L. Jonkers, G. Knorr, D. Thornalley. Icebergs not the trigger for North Atlantic cold events. Nature 520, 333–336, 2015. http://dx.doi.org/10.1038/nature14330.

Blunier, T., J. Chappellaz, J. Schwander, A. Dällenbach, B. Stauffer, T.F. Stocker, D. Raynaud, J. Jouzel, H.B. Clausen, C.U. Hammer, and S.J. Johnsen, “”, Nature, vol. 394, pp. 739-743, 1998. http://dx.doi.org/10.1038/29447.

Böning, C.W., A. Dispert, M. Visbeck, S. R. Rintoul, F. U. Schwarzkop. The response of the Antarctic Circumpolar Current to recent climate change. Nature Geoscience 1, 864-869 (2008).
http://dx.doi.org/10.1038/ngeo362.

Buizert, C., Cuffey, K. M., Severinghaus, J. P., Baggenstos, D., Fudge, T. J., Steig, E. J., Markle, B. R., Winstrup, M., Rhodes, R. H., Brook, E. J., Sowers, T. A., Clow, G. D., Cheng, H., Edwards, R. L., Sigl, M., McConnell, J. R., and Taylor, K. C.: The WAIS Divide deep ice core WD2014 chronology – Part 1: Methane synchronization (68–31 ka BP) and the gas age–ice age difference, Clim. Past, 11, 153-173, 2015. http://dx.doi.org/10.5194/cp-11-153-2015.

EPICA Community Members, “One-to-one coupling of glacial climate variability in Greenland and Antarctica”, Nature, vol. 444, pp. 195-198, 2006. http://dx.doi.org/10.1038/nature05301

Fyfe, J.C. and O. A. Saenko, 2005: Human-Induced Change in the Antarctic Circumpolar Current. J. Climate, 18, 3068–3073. http://dx.doi.org/10.1175/JCLI3447.1

Grootes, P.M., M. Stuiver, J.W.C. White, S. Johnsen, and J. Jouzel, “Comparison of oxygen isotope records from the GISP2 and GRIP Greenland ice cores”, Nature, vol. 366, pp. 552-554, 1993. http://dx.doi.org/10.1038/366552a0.

He, F., J.D. Shakun, P.U. Clark, A.E. Carlson, Z. Liu, B.L. Otto-Bliesner, and J.E. Kutzbach, “Northern Hemisphere forcing of Southern Hemisphere climate during the last deglaciation”, Nature, vol. 494, pp. 81-85, 2013. http://dx.doi.org/10.1038/nature11822.

Margari, V., L.C. Skinner, P.C. Tzedakis, A. Ganopolski, M. Vautravers, N.J. Shackleton. The nature of millennial-scale climate variability during the past two glacial periods. Nature Geoscience 3, 127 – 131 (2010) http://dx.doi.org/10.1038/ngeo740.

NEEM Community Members, Eemian interglacial reconstructed from a Greenland folded ice core, Nature, vol. 493, pp. 489-494, 2013. http://dx.doi.org/10.1038/nature11789.

Pedro, J.B., T.D. van Ommen, S.O. Rasmussen, V.I. Morgan, J. Chappellaz, A.D. Moy, V. Masson-Delmotte, and M. Delmotte, The last deglaciation: timing the bipolar seesaw, Climate of the Past, vol. 7, pp. 671-683, 2011. http://dx.doi.org/10.5194/cp-7-671-2011.

Peltier, W. R., and G. Vettoretti, Dansgaard-Oeschger oscillations predicted in a comprehensive model of glacial climate: A “kicked” salt oscillator in the Atlantic, Geophys. Res. Lett.,41, 7306–7313, 2014. http://dx.doi.org/10.1002/2014GL061413.

Rind, D., G. Russell, G. Schmidt, S. Sheth, D. Collins, P. deMemocal, J. Teller. Effects of glacial meltwater in the GISS coupled atmosphere–ocean model, 2. A bipolar seesaw in Atlantic Deep Water production. Journal Geophysical Research, 106, pp. 27,355–27,365, 2001. http://dx.doi.org/10.1029/2001JD000954

Roe, G.H. and E.J. Steig. Characterization of Millennial-Scale Climate Variability. J. Climate, 17, 1929–1944. http://journals.ametsoc.org/doi/full/10.1175/1520-0442%282004%29017%3C1929%3ACOMCV%3E2.0.CO%3B2.

Rosen, J.L., E.J. Brook, J.P. Severinghaus, T. Blunier, L.E. Mitchell, J.E. Lee, J.S. Edwards, and V. Gkinis, An ice core record of near-synchronous global climate changes at the Bølling transition, Nature Geosci, vol. 7, pp. 459-463, 2014. http://dx.doi.org/10.1038/ngeo2147.

Schmittner, A., O. Saenko, and A. Weaver, Coupling of the hemispheres in observations and simulations of glacial climate change, Quaternary Science Reviews, vol. 22, pp. 659-671, 2003. http://dx.doi.org/10.1016/S0277-3791(02)00184-1.

Steig, E.J. et al., Q. Ding, J.W.C. White, M. Küttel, S.B. Rupper, T.A. Neumann, P.D. Neff, A.J.E. Gallant, P.A. Mayewski, K.C. Taylor, G. Hoffmann, D.A. Dixon, S.W. Schoenemann, B.R. Markle, T.J. Fudge, D.P. Schneider, A.J. Schauer, R.P. Teel, B.H. Vaughn, L. Burgener, J. Williams, and E. Korotkikh, “Recent climate and ice-sheet changes in West Antarctica compared with the past 2,000 years”, Nature Geosci, vol. 6, pp. 372-375, 2013. http://dx.doi.org/10.1038/NGEO1778.

Steig, E.J., Climate change: The south–north connection, Nature, vol. 444, pp. 152-153, 2006. http://dx.doi.org/10.1038/444152a

Stocker, T.F. and S.J. Johnsen, A minimum thermodynamic model for the bipolar seesaw, Paleoceanography, vol. 18, pp. n/a-n/a, 2003. http://dx.doi.org/10.1029/2003PA000920.

Vettoretti, G. and W.R. Peltier (2015), Interhemispheric air temperature phase relationships in the nonlinear Dansgaard-Oeschger oscillation. Geophys. Res. Lett., 42: 1180–1189. http://dx.doi.org/10.1002/2014GL062898.

WAIS Divide Project Members. Onset of deglacial warming in West Antarctica driven by local orbital forcing. Nature, 500: 440-444, 2013. http://dx.doi.org/10.1038/nature12376.

WAIS Divide Project Members. Precise interpolar phasing of abrupt climate change during the last ice age. Nature http://dx.doi.org/10.1038/nature14401.

Filed Under: Climate Science

Diagnosing Causes of Sea Level Rise

8 Jan 2015 by eric

Guest post by Sarah G. Purkey and Gregory C. Johnson,
University of Washington / NOAA

I solicited this post from colleagues at the University of Washington. I found their paper particularly interesting because it gets at the question of sea level rise from a combination of ocean altimetry and density (temperature + salinity) data. This kind of measurement and calculation has not really been possible — not at this level of detail — until quite recently. A key finding is that one can reconcile various different estimates of the contributions to observed sea level rise only if the significant warming of the deep ocean is accounted for. There was a good write-up in The Guardian back when the paper came out.– Eric Steig


Sea leave rise reveals a lot about our changing climate. A rise in the mean sea level can be caused by decreases in ocean density, mostly reflecting an increase in ocean temperature — this is steric sea level rise. It can also be caused by an increase in ocean mass, reflecting a gain of fresh water from land. A third, and smaller, contribution to mean sea level is from glacial isostatic adjustment. The contribution of glacial isostatic adjustment, while small, has a range of possible values and can be a significant source of uncertainty in sea level budgets. Over recent decades, very roughly half of the observed mean sea level rise is owing to changes in ocean density with the other half owing to the increased in ocean mass, mostly from melting glaciers and polar ice sheets. The exact proportion has been difficult to pin down with great certainty. [Read more…] about Diagnosing Causes of Sea Level Rise

References

  1. S.G. Purkey, G.C. Johnson, and D.P. Chambers, "Relative contributions of ocean mass and deep steric changes to sea level rise between 1993 and 2013", Journal of Geophysical Research: Oceans, vol. 119, pp. 7509-7522, 2014. http://dx.doi.org/10.1002/2014JC010180

Filed Under: Climate Science, Oceans

Clarity on Antarctic sea ice.

19 Dec 2014 by eric

I’ve always been a skeptic when it comes to Antarctic sea ice. I’m not referring here to the tiresome (and incorrect) claim that the expansion of sea ice around Antarctica somehow cancels out the dramatic losses of sea ice in the Arctic (NB: polar bears don’t really care if there is sea ice in Antarctica or not). Rather, I’m referring to the idea that the observation of Antarctic sea ice expansion represents a major conundrum in our understanding of the climate system, something one hears even from knowledgeable commentators. In this post, I’ll try to provide some clarity on this subject, with some basic background and discussion of a couple of important recent papers.
[Read more…] about Clarity on Antarctic sea ice.

Filed Under: Climate Science

Ice hockey

17 Apr 2013 by eric

Eric Steig

It is well known that ice shelves on the Antarctic Peninsula have collapsed on several occasions in the last couple of decades, that ice shelves in West Antarctica are thinning rapidly, and that the large outlet glaciers that drain the West Antarctic ice sheet (WAIS) are accelerating. The rapid drainage of the WAIS into the ocean is a major contributor to sea level rise (around 10% of the total, at the moment).

All of these observations match the response, predicted in the late 1970s by glaciologist John Mercer, of the Antarctic to anthropogenic global warming. As such, they are frequently taken as harbingers of greater future sea level rise to come. Are they?

Two papers published this week in Nature Geoscience provide new information that helps to address this question. One of the studies (led by me) says “probably”, while another (Abram et al.) gives a more definitive “yes”. [Read more…] about Ice hockey

Filed Under: Arctic and Antarctic, Climate impacts, Climate modelling, Climate Science, El Nino, In the News, Instrumental Record, Oceans, Paleoclimate

The Greenland melt

23 Jan 2013 by eric

Eric Steig

Last July (2012), I heard from a colleagues working at the edge of the Greenland ice sheet, and from another colleague working up at the Summit. Both were independently writing to report the exceptional conditions they were witnessing. The first was that the bridge over the Watson river by the town of Kangerlussuaq, on the west coast of Greenland, was being breached by the high volumes of meltwater coming down from the ice sheet. The second was that there was a new melt layer forming at the highest point of the ice sheet, where it very rarely melts.


A front loader being swept off a bridge into the Watson River, Kangerlussuaq, Greenland, in July 2012. Fortunately, nobody was in it at the time. Photo: K. Choquette

I’ve been remiss in not writing about these observations until now. I’m prompted to do so by the publication in Nature today (January 23, 2013) of another new finding about Greenland melt. This paper isn’t about the modern climate, but about the climate of the last interglacial period. It has relevance to the modern situation though, a point to which I’ll return at the end of this post.

[Read more…] about The Greenland melt

Filed Under: Arctic and Antarctic, Climate Science, Paleoclimate

The heat is on in West Antarctica

23 Dec 2012 by eric

Eric Steig

Regular followers of RealClimate will be aware of our publication in 2009 in Nature, showing that West Antarctica — the part of the Antarctic ice sheet that is currently contributing the most to sea level rise, and which has the potential to become unstable and contribute a lot more (3 meters!) to sea level rise in the future — has been warming up for the last 50 years or so.

Our paper was met with a lot of skepticism, and not just from the usual suspects. A lot of our fellow scientists, it seems, had trouble getting over their long-held view (based only on absence of evidence) that the only place in Antarctica that was warming up was the Antarctica Peninsula. To be fair, our analysis was based on interpolation, using statistics to fill in data where it was absent, so we really hadn’t proven anything; we’d only done an analysis that pointed (strongly!) in a particular direction.

[Read more…] about The heat is on in West Antarctica

Filed Under: Climate Science

Antarctic Peninsula warming: natural variability or “global warming”?

23 Aug 2012 by eric

Most people know that the Antarctic Peninsula is one of the most rapidly warming places on earth. But like everywhere else in Antarctica, the length of available temperature data is short — most records begin in 1957 (when stations were put in place during the International Geophysical Year); a few start in the late 1940s. This makes the recent rapid warming difficult to evaluate; in general, what’s interesting is how the trend compares with the underlying variability. As anyone who’s been there can tell you, the weather on the Antarctic Peninsula is pretty wild, and this applies to the climate as well: year to year variability is very large. Put another way, the noise level is high, and discerning the signal requires more data than is available from the instrumental temperature record. This is where ice cores come in handy — they provide a much longer record, and allow us to evaluate the recent changes in a more complete context.

A new paper in Nature this week presents results from an ice core drilled by the British Antarctic Survey (BAS) at James Ross Island on the Antarctic Peninsula. [Read more…] about Antarctic Peninsula warming: natural variability or “global warming”?

Filed Under: Arctic and Antarctic, Climate Science, Reporting on climate

  • Page 1
  • Page 2
  • Page 3
  • Interim pages omitted …
  • Page 6
  • Go to Next Page »

Primary Sidebar

Search

Search for:

Email Notification

get new posts sent to you automatically (free)
Loading

Recent Posts

  • The most recent climate status
  • Unforced variations: May 2025
  • Unforced Variations: Apr 2025
  • WMO: Update on 2023/4 Anomalies
  • Andean glaciers have shrunk more than ever before in the entire Holocene
  • Climate change in Africa

Our Books

Book covers
This list of books since 2005 (in reverse chronological order) that we have been involved in, accompanied by the publisher’s official description, and some comments of independent reviewers of the work.
All Books >>

Recent Comments

  • Tomáš Kalisz on Unforced variations: May 2025
  • Tomáš Kalisz on Unforced variations: May 2025
  • Piotr on Unforced variations: May 2025
  • Piotr on Unforced variations: May 2025
  • Susan Anderson on Unforced variations: May 2025
  • Ken Towe on The most recent climate status
  • Keith Woollard on The most recent climate status
  • Dan on Unforced variations: May 2025
  • Nigelj on The most recent climate status
  • sidd on Unforced variations: May 2025
  • Keith Woollard on The most recent climate status
  • Tomáš Kalisz on Unforced variations: May 2025
  • nigelj on The most recent climate status
  • Piotr on The most recent climate status
  • nigelj on Unforced variations: May 2025
  • Piotr on The most recent climate status
  • nigelj on Unforced variations: May 2025
  • nigelj on Unforced variations: May 2025
  • zebra on The most recent climate status
  • Piotr on The most recent climate status

Footer

ABOUT

  • About
  • Translations
  • Privacy Policy
  • Contact Page
  • Login

DATA AND GRAPHICS

  • Data Sources
  • Model-Observation Comparisons
  • Surface temperature graphics
  • Miscellaneous Climate Graphics

INDEX

  • Acronym index
  • Index
  • Archives
  • Contributors

Realclimate Stats

1,365 posts

11 pages

243,147 comments

Copyright © 2025 · RealClimate is a commentary site on climate science by working climate scientists for the interested public and journalists.