• Skip to primary navigation
  • Skip to main content
  • Skip to primary sidebar
  • Skip to footer

RealClimate

Climate science from climate scientists...

  • Start here
  • Model-Observation Comparisons
  • Miscellaneous Climate Graphics
  • Surface temperature graphics
You are here: Home / Archives for Climate Science / Arctic and Antarctic

Arctic and Antarctic

Ice Shelf Instability

12 Jun 2008 by group

Guest contribution from Mauri S. Pelto

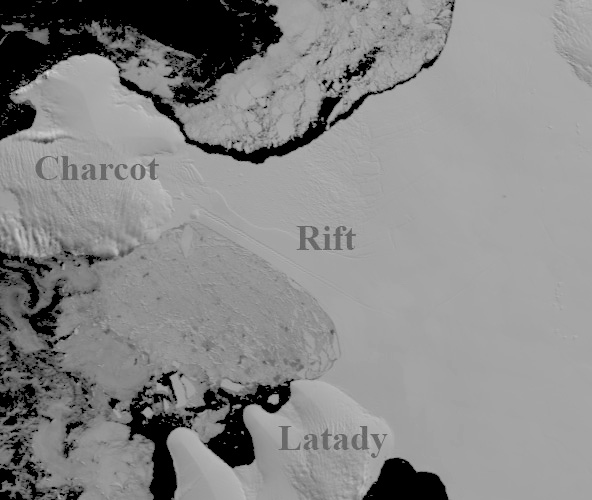
Ice shelves are floating platforms of ice fed by mountain glaciers and ice sheets flowing from the land onto the ocean. The ice flows from the grounding line where it becomes floating to the seaward front, where icebergs calve. For a typical glacier when the climate warms the glacier merely retreats, reducing its low elevation, high melting area by increasing its mean elevation. An ice shelf is nearly flat and cannot retreat in this fashion. Ice shelves cannot persist unless the entire ice shelf is an accumulation zone, where snowpack does not completely melt even in the summer.


[Read more…] about Ice Shelf Instability

Filed Under: Arctic and Antarctic, Climate Science

Moulins, Calving Fronts and Greenland Outlet Glacier Acceleration Sifones, frentes glaciares y la aceleración de los glaciares exteriores de Groenlandia

18 Apr 2008 by group

Guest Commentary by Mauri Pelto

The net loss in volume and hence sea level contribution of the Greenland Ice Sheet (GIS) has doubled in recent years from 90 to 220 cubic kilometers/year has been noted recently (Rignot and Kanagaratnam, 2007). The main cause of this increase is the acceleration of several large outlet glaciers. There has also been an alarming increase in the number of photographs of meltwater draining into a moulin somewhere on the GIS, often near Swiss Camp (35 km inland from the calving front). The story goes—warmer temperatures, more surface melting, more meltwater draining through moulins to glacier base, lubricating glacier bed, reducing friction, increasing velocity, and finally raising sea level. Examining this issue two years RealClimate suggested this was likely the correct story. A number of recent results suggest that we need to take another look at this story.

Una traducción está disponible aquí
[Read more…] about Moulins, Calving Fronts and Greenland Outlet Glacier Acceleration Sifones, frentes glaciares y la aceleración de los glaciares exteriores de Groenlandia

Filed Under: Arctic and Antarctic, Climate Science

Antarctica is Cold? Yeah, We Knew That ¿La Antártida está fría? Si, ya lo sabíamos

12 Feb 2008 by group

Guest commentary from Spencer Weart, science historian

Despite the recent announcement that the discharge from some Antarctic glaciers is accelerating, we often hear people remarking that parts of Antarctica are getting colder, and indeed the ice pack in the Southern Ocean around Antarctica has actually been getting bigger. Doesn’t this contradict the calculations that greenhouse gases are warming the globe? Not at all, because a cold Antarctica is just what calculations predict… and have predicted for the past quarter century.

It’s not just that Antarctica is covered with a gazillion tons of ice, although that certainly helps keep it cold. The ocean also plays a role, which is doubly important because of the way it has delayed the world’s recognition of global warming.

Una traducción está disponible aquí
[Read more…] about Antarctica is Cold? Yeah, We Knew That ¿La Antártida está fría? Si, ya lo sabíamos

Filed Under: Arctic and Antarctic, Climate Science

New rule for high profile papers

4 Jan 2008 by Gavin

New rule: When declaring that climate models are misleading in a high profile paper, maybe looking at some model output first would be a good idea.
[Read more…] about New rule for high profile papers

Filed Under: Arctic and Antarctic, Climate modelling, Climate Science

Uncertainty in polar ozone depletion?

28 Sep 2007 by group

Guest commentary by Drew Shindell

The unique chemistry that causes dramatic ozone depletion in the polar springtime lower stratosphere has been studied intensely for the past 2-3 decades and much that was speculated about 30 years ago when the problem first emerged has been verified and made more coherent. However, a new report concerning laboratory measurements of a key molecule involved in this chemistry have raised questions about current understanding. The results (Pope et al., J. Phys. Chem., 2007) suggest a reduced ability for sunlight to break apart the chlorine monoxide dimer (Cl2O2) and have already led to a great deal of debate about their implications. I’ll try here to help assess what these new measurements really mean.
[Read more…] about Uncertainty in polar ozone depletion?

Filed Under: Arctic and Antarctic, Climate Science

Arctic sea ice watch

10 Aug 2007 by group

A few people have already remarked on some pretty surprising numbers in Arctic sea ice extent this year (the New York Times has also noticed). The minimum extent is usually in early to mid September, but this year, conditions by Aug 9 had already beaten all previous record minima. Given that there is at least a few more weeks of melting to go, it looks like the record set in 2005 will be unequivocally surpassed. It could be interesting to follow especially in light of model predictions discussed previously.

There are a number of places to go to get Arctic sea ice information. Cryosphere Today has good anomaly plots. The Naval Sea ice center has a few different algorithms (different ways of processing the data) that give some sense of the observational uncertainty, and the National Snow and Ice Data Center give monthly updates. All of them show pretty much the same thing.

Just to give a sense of how dramatic the changes have been over the last 28 years, the figures below show the minimum ice extent in September 1979, and the situation today (Aug 9, 2007).

Sep 05 1979Aug 09 2007

The reduction is around 1.2 million square km of ice, a little bit larger than the size of California and Texas combined.

Update: As noted by Andy Revkin below, some of the discussion is about ice extent and some is about ice area. The Cryosphere Today numbers are for area. The difference is whether you count ‘leads’ (the small amounts of water between ice floes) as being ice or water – for the area calculation they are not included with the ice, for the extent calculation they are.

Update: From the comments: NSIDC will now be tracking this on a weekly basis.

Filed Under: Arctic and Antarctic, Climate Science

Making sense of Greenland’s ice

9 Jul 2007 by Gavin

A widely publicised paper in Science last week discussed the recovery ancient DNA from the base of the Dye-3 ice core (in southern Greenland). This was an impressive technical feat and the DNA recovered may well be the oldest pure DNA ever, dating back maybe half a million years. However much of the press coverage of this paper dwelt not on the positive aspects of the study but on its supposed implications for the stability of the Greenland ice sheet and future sea level rise, something that was not greatly discussed in the paper at all. So why was this?
[Read more…] about Making sense of Greenland’s ice

Filed Under: Arctic and Antarctic, Climate Science, Paleoclimate

The lag between temperature and CO2. (Gore’s got it right.)

27 Apr 2007 by eric

When I give talks about climate change, the question that comes up most frequently is this: “Doesn’t the relationship between CO2 and temperature in the ice core record show that temperature drives CO2, not the other way round?”

On the face of it, it sounds like a reasonable question. It is no surprise that it comes up because it is one of the most popular claims made by the global warming deniers. It got a particularly high profile airing a couple of weeks ago, when congressman Joe Barton brought it up to try to discredit Al Gore’s congressional testimony. Barton said:

    In your movie, you display a timeline of temperature and compared to CO2 levels over a 600,000-year period as reconstructed from ice core samples. You indicate that this is conclusive proof of the link of increased CO2 emissions and global warming. A closer examination of these facts reveals something entirely different. I have an article from Science magazine which I will put into the record at the appropriate time that explains that historically, a rise in CO2 concentrations did not precede a rise in temperatures, but actually lagged temperature by 200 to 1,000 years. CO2 levels went up after the temperature rose. The temperature appears to drive CO2, not vice versa. On this point, Mr. Vice President, you’re not just off a little. You’re totally wrong.

Of course, those who’ve been paying attention will recognize that Gore is not wrong at all. This subject has been very well addressed in numerous places. Indeed, guest contributor Jeff Severinghaus addressed this in one of our very first RealClimate posts, way back in 2004. Still, the question does keep coming up, and Jeff recently received a letter asking about this. His exchange with the letter writer is reproduced in full at the end of this post. Below is my own take on the subject.

Una traduzione in italiano è disponibile qui
Una traducción en español está disponible aquí
[Read more…] about The lag between temperature and CO2. (Gore’s got it right.)

Filed Under: Arctic and Antarctic, Climate Science, Greenhouse gases, Paleoclimate

The IPCC sea level numbers Os números do nível do mar do IPCC

27 Mar 2007 by Stefan

The sea level rise numbers published in the new IPCC report (the Fourth Assessment Report, AR4) have already caused considerable confusion. Many media articles and weblogs suggested there is good news on the sea level issue, with future sea level rise expected to be a lot less compared to the previous IPCC report (the Third Assessment Report, TAR). Some articles reported that IPCC had reduced its sea level projection from 88 cm to 59 cm (35 inches to 23 inches) , some even said it was reduced from 88 cm to 43 cm (17 inches), and there were several other versions as well (see “Broad Irony”). These statements are not correct and the new range up to 59 cm is not the full story. Here I will try to clarify what IPCC actually said and how these numbers were derived. (But if you want to skip the details, you can go straight to the critique or the bottom line).
[Read more…] about The IPCC sea level numbers Os números do nível do mar do IPCC

Filed Under: Arctic and Antarctic, Climate Science, IPCC

What triggers ice ages? O que Dispara as Eras Glaciais? Buzul Çağlarını Tetikleyen Nedir?Qu’est ce qui déclenche les glaciations?

16 Feb 2007 by rasmus

by Rasmus Benestad, with contributions from Caspar & Eric

In a recent article in Climatic Change, D.G. Martinson and W.C. Pitman III discuss a new hypothesis explaining how the climate could change abruptly between ice ages and inter-glacial (warm) periods. They argue that the changes in Earth’s orbit around the Sun in isolation is not sufficient to explain the estimated high rate of change, and that there must be an amplifying feedback process kicking in. The necessity for a feedback is not new, as the Swedish Nobel Prize winner (Chemistry), Svante Arrhenius, suggested already in 1896 that CO2 could act as an amplification mechanism. In addition, there is the albedo feedback, where the amount of solar radiation that is reflected back into space, scales with the area of the ice- and snow-cover. And are clouds as well as other aspects playing a role.

por Rasmus Benestad, com contribuições de Caspar & Eric

Em um artigo recente da Climatic Change, D.G. Martinson e W.C. Pitman III discutem uma nova hipótese que explica como o clima pode mudar abruptamente entre eras glaciais e períodos interglaciais (quentes). Eles argumentam que as mudanças na órbita da Terra ao redor do Sol em isolado não são suficientes para explicar as altas taxas de mudanças estimadas, e que deve necessariamente haver a ação de um mecanismo de feedback (ou retro-alimentação) amplificando o processo. A necessidade de um feedback não é nova, pois o sueco ganhador do Prêmio Nobel (Química), Svante Arrhenius, já havia sugerido em 1896 que o CO2 deveria agir como um mecanismo de amplificação. Além do mais, existe o feedback do albedo, pelo qual a quantidade de radiação solar que é refletida de volta ao espaço é escalonável com a área de cobertura de gelo e neve. E existem nuvens bem como outros aspectos envolvidos.

Orbital forcing A hipótese de Martinson & Pitman III formula que a entrada de água doce funciona em consonância com o ciclo de Milankovitch e o feedback de albedo. Eles concluem que os ‘maiores’ términos podem somente acontecer após um acúmulo de gelo grande o suficiente para isolar o Artico, inibindo o fluxo de entrada de água doce até um ponto em que o aumento da salinidade na camada superficial, através de um vagaroso e contínuo crescimento do gelo marinho, causa uma inversão das águas marinhas do Ártico (pelo efeito na circulação atmosférica e nas correntes oceânicas). A inversão vertical traz água quente de baixo para cima, promovendo condições mais favoráveis ao degelo. A salinidade também tem um papel, mas a hipótese não menciona variações de gases de efeito estufa (GEE). Algumas questões: Martinson e Pitman III esqueceram disso? Ou os GEE representam somente uma pequena contribuição? E, não poderiam as mudanças nos GEE explicar boa parte da variabilidade? Por outro lado, parece plausível que mudanças na salinidade e na entrada de água doce poderiam afetar a formação de gelo marinho e a convecção profunda. Contudo, até o presente, a hipótese proposta por Martinson and Pitman III é meramente uma especulação, e estamos aguardando para ver se a hipótese pode ser testada através de experimentos de modelos numéricos (o que pode requerer modelos oceânicos e de gelo marinho com maior resolução que os atualmente usados em modelos climáticos globais). Seria interessante conduzir experimentos para avaliar a significância individual da água doce, dos GEE e o efeito combinado.

Uma reação ao trabalho de Martison e Pittman é: Onde está o cálculo de energia? Gases de efeito estufa contribuem somente com alguns W/m2, em contraste com uma forçante >40 do ciclo sazonal de Milankovich. Para esta nova idéia ter mérito, teria sido melhor ter no mínimo fluxos de calor em paralelo com a forçante radioativa do CO2. Estudos de modelagem anteriores encontraram que GEE produzem aproximadamente 50% de todo Último Máximo Glacial (inglês, LGM) para a resposta da temperatura atual (veja por exemplo Broccoli & Manabe), a outra parte sendo o albedo, etc., que respondem ao ciclo sazonal de irradiância. É muito difícil isolar completamente as causas individuais pois as mudanças nos GEE podem produzir alterações na distribuição de nuvens e gelo marinho. Mas a grosso modo, se você rodar um LGM e somente somente reduzir o nível do mar, introduzir as calotas de gelo, mudar a vegetação, adicionar alguma poeria (embora esta ainda seja grosseira), então você alcançaria ao redor de 50% do caminho que você quer ir. Mude a concentração de GEE e você chegaria mais próximo. Isso é mais ou menos o que Manabe e Stouffer mostraram há quinze anos atrás. A questão é se realmente precisamos de algo mais, e se esse ‘algo mais’ tem força suficiente.

traduzido por Ivan B. T. Lima e Fernando M. Ramos.


[Read more…] about What triggers ice ages? O que Dispara as Eras Glaciais? Buzul Çağlarını Tetikleyen Nedir?Qu’est ce qui déclenche les glaciations?

Filed Under: Arctic and Antarctic, Climate modelling, Climate Science, FAQ, Reporting on climate

  • « Go to Previous Page
  • Page 1
  • Interim pages omitted …
  • Page 6
  • Page 7
  • Page 8
  • Page 9
  • Page 10
  • Page 11
  • Go to Next Page »

Primary Sidebar

Search

Search for:

Email Notification

get new posts sent to you automatically (free)
Loading

Recent Posts

  • Who should pay?
  • Site updates etc.
  • Raising Climate Literacy
  • Unforced variations: Nov 2025
  • High-resolution ‘fingerprint’ images reveal a weakening Atlantic Ocean circulation (AMOC)
  • Unforced variations: Oct 2025

Our Books

Book covers
This list of books since 2005 (in reverse chronological order) that we have been involved in, accompanied by the publisher’s official description, and some comments of independent reviewers of the work.
All Books >>

Recent Comments

  • Geoff Miell on Unforced variations: Nov 2025
  • Nigelj on Unforced variations: Nov 2025
  • Neurodivergent on Unforced variations: Nov 2025
  • Susan Anderson on Unforced variations: Nov 2025
  • Ron R. on Who should pay?
  • MS on Who should pay?
  • Piotr on Unforced variations: Nov 2025
  • Nigelj on Unforced variations: Nov 2025
  • Atomsk's Sanakan on Unforced variations: Nov 2025
  • Atomsk's Sanakan on Unforced variations: Nov 2025
  • Nigelj on Raising Climate Literacy
  • Atomsk's Sanakan on Unforced variations: Nov 2025
  • Susan Anderson on Unforced variations: Nov 2025
  • Susan Anderson on Unforced variations: Nov 2025
  • Atomsk's Sanakan on Raising Climate Literacy
  • Piotr on Unforced variations: Nov 2025
  • zebra on Unforced variations: Nov 2025
  • Geoff Miell on Unforced variations: Nov 2025
  • Yebo Kando on Raising Climate Literacy
  • John Pollack on Unforced variations: Nov 2025
  • Ron R. on Unforced variations: Nov 2025
  • Nigelj on Raising Climate Literacy
  • Tomáš Kalisz on Unforced variations: Nov 2025
  • Atomsk's Sanakan on Raising Climate Literacy
  • Nigelj on Unforced variations: Nov 2025
  • Yebo Kando on Raising Climate Literacy
  • Nigelj on Unforced variations: Nov 2025
  • Nigelj on Unforced variations: Nov 2025
  • Piotr on Unforced variations: Nov 2025
  • Atomsk's Sanakan on Unforced variations: Nov 2025

Footer

ABOUT

  • About
  • Translations
  • Privacy Policy
  • Contact Page
  • Login

DATA AND GRAPHICS

  • Data Sources
  • Model-Observation Comparisons
  • Surface temperature graphics
  • Miscellaneous Climate Graphics

INDEX

  • Acronym index
  • Index
  • Archives
  • Contributors

Realclimate Stats

1,388 posts

15 pages

248,660 comments

Copyright © 2025 · RealClimate is a commentary site on climate science by working climate scientists for the interested public and journalists.