June is the month when the Arctic Sea Ice outlook gets going, when the EPA releases its rules on power plant CO2 emissions, and when, hopefully, commenters can get back to actually having constructive and respectful conversations about climate science (and not nuclear energy, impending apocalypsi (pl) or how terrible everyone else is). Thanks.
Climate Science
El Niño or Bust
Guest commentary from Michelle L’Heureux, NOAA Climate Prediction Center
Much media attention has been directed at the possibility of an El Niño brewing this year. Many outlets have drawn comparison with the 1997-98 super El Niño. So, what are the odds that El Niño will occur? And if it does, how strong will it be?
To track El Niño, meteorologists at the NOAA/NWS Climate Prediction Center (CPC) release weekly and monthly updates on the status of the El Niño-Southern Oscillation (ENSO). The International Research Institute (IRI) for Climate and Society partner with us on the monthly ENSO release and are also collaborators on a brand new “ENSO blog” which is part of www.climate.gov (co-sponsored by the NOAA Climate Programs Office).
Blogging ENSO is a first for operational ENSO forecasters, and we hope that it gives us another way to both inform and interact with our users on ENSO predictions and impacts. In addition, we will collaborate with other scientists to profile interesting ENSO research and delve into the societal dimensions of ENSO.
As far back as November 2013, the CPC and the IRI have predicted an elevated chance of El Niño (relative to historical chance or climatology) based on a combination of model predictions and general trends over the tropical Pacific Ocean. Once the chance of El Niño reached 50% in March 2014, an El Niño Watch was issued to alert the public that conditions are more favorable for the development of El Niño.
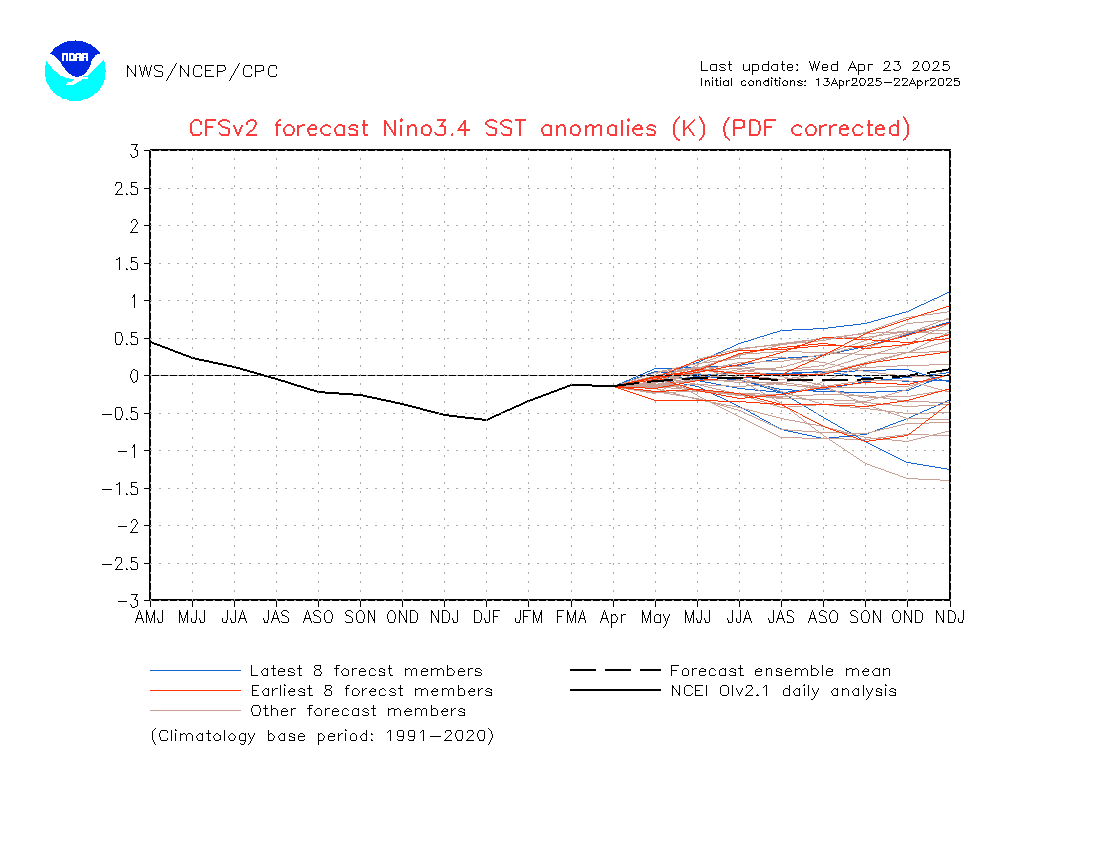
Current forecasts for the Nino-3.4 SST index (as of 5 May 2014) from the NCEP Climate Forecast System version 2 model
More recently, on May 8th, the CPC/IRI ENSO team increased the chance that El Niño will develop, with a peak probability of ~80% during the late fall/early winter of this year. El Nino onset is currently favored sometime in the early summer (May-June-July). At this point, the team remains non-committal on the possible strength of El Niño preferring to watch the system for at least another month or more before trying to infer the intensity. But, could we get a super strong event? The range of possibilities implied by some models allude to such an outcome, but at this point the uncertainty is just too high. While subsurface heat content levels are well above average (March was the highest for that month since 1979 and April was the second highest), ENSO prediction relies on many other variables and factors. We also remain in the spring prediction barrier, which is a more uncertain time to be making ENSO predictions.
Could El Niño predictions fizzle? Yes, there is roughly a 2 in 10 chance at this point that this could happen. It happened in 2012 when an El Nino Watch was issued, chances became as high as 75% and El Niño never formed. Such is the nature of seasonal climate forecasting when there is enough forecast uncertainty that “busts” can and do occur. In fact, more strictly, if the forecast probabilities are “reliable,” an event with an 80% chance of occurring should only occur 80% of the time over a long historical record. Therefore, 20% of the time the event must NOT occur (click here for a description of verification techniques).
While folks might prefer total certainty in our forecasts, we live in an uncertain world. El Niño is most likely to occur this year, so please stay attentive to the various updates linked above and please visit our brand new ENSO blog.
Unforced variations: May 2014
This month’s open thread. In order to give everyone a break, no discussion of mitigation options this month – that has been done to death in previous threads. Anything related to climate science is totally fine: Carbon dioxide levels maybe, or TED talks perhaps…
Faking it
Every so often contrarians post old newspaper quotes with the implication that nothing being talked about now is unprecedented or even unusual. And frankly, there are lots of old articles that get things wrong, are sensationalist or made predictions without a solid basis. And those are just the articles about the economy.
However, there are plenty of science articles that are just interesting, reporting events and explorations in the Arctic and elsewhere that give a fascinating view into how early scientists were coming to an understanding about climate change and processes. In particular, in the Atlantic sector of the Arctic the summer of 1922 was (for the time) quite warm, and there were a number of reports that discussed some unprecedented (again, for the time) observations of open water. The most detailed report was in the Monthly Weather Review:
[Read more…] about Faking it
Nenana Ice Classic: Update
Somewhat randomly, my thoughts turned to the Nenana Ice Classic this evening, only to find that the ice break up had only just occurred (3:48 pm Alaskan Standard Time, April 25). This is quite early (the 7th earliest date, regardless of details associated with the vernal equinox or leap year issues), though perhaps unsurprising after the warm Alaskan winter this year (8th warmest on record). This is in strong contrast to the very late break up last year.
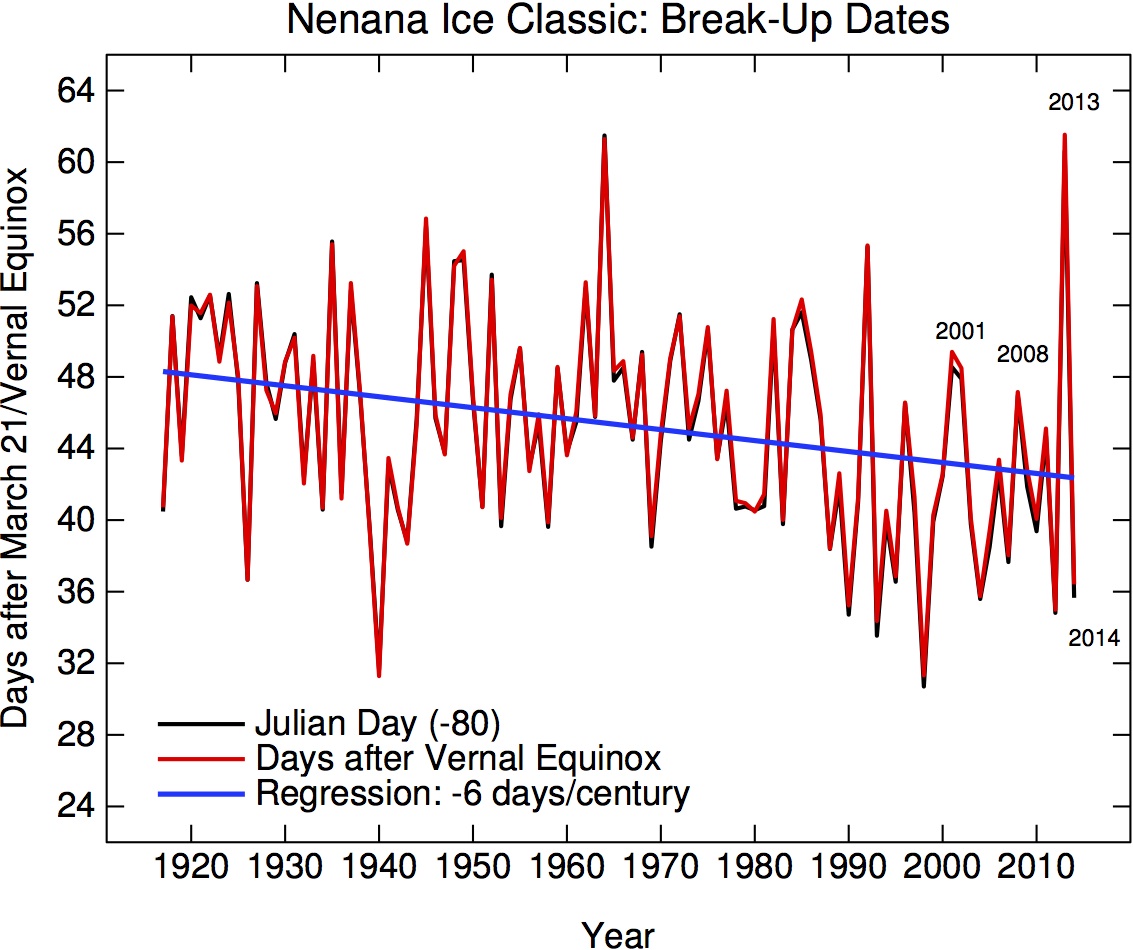
Break up dates accounting for leap years and variations in the vernal equinox.
As mentioned in my recent post, the Nenana break up date is a good indicator of Alaskan regional temperatures and despite last year’s late anomaly, the trends are very much towards a earlier spring. This is also true for trends in temperatures and ice break up mostly everywhere else too, despite individual years (like 2013/2014) being anomalously cold (for instance in the Great Lakes region). As we’ve often stressed, it is the trends that are important for judging climate change, not the individual years. Nonetheless, odds on dates as early as this years have more than doubled over the last century.
Labels for climate data
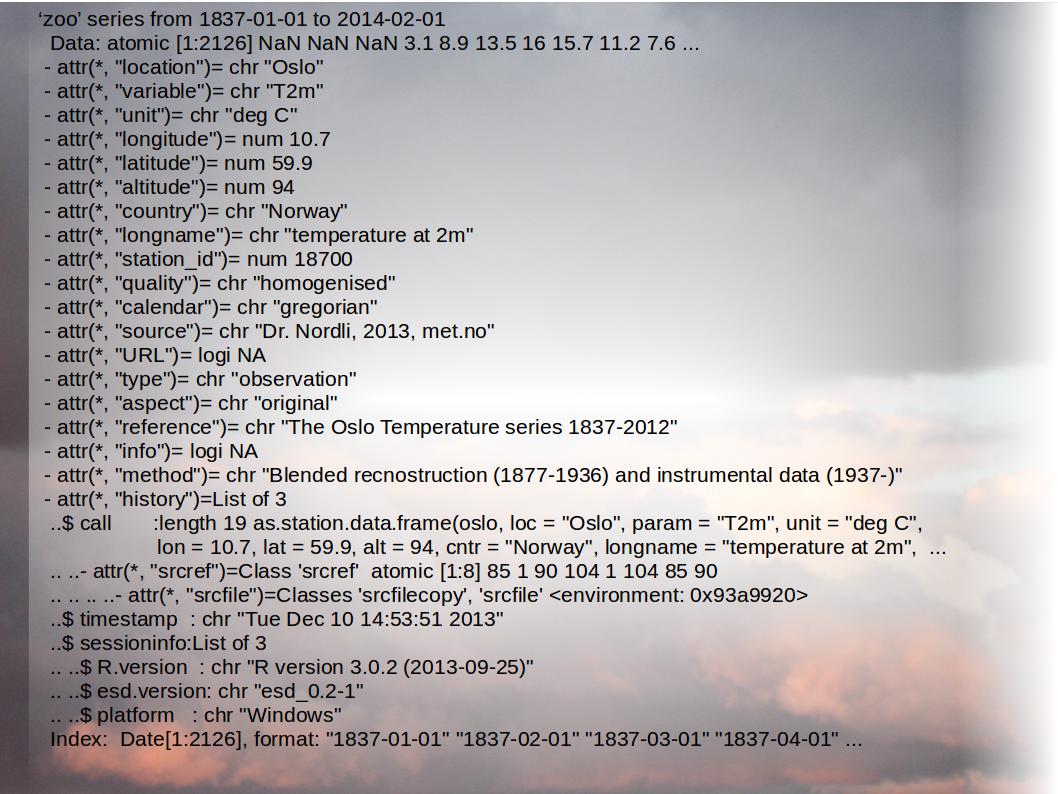 “These results are quite strange”, my colleague told me. He analysed some of the recent climate model results from an experiment known by the cryptic name ‘CMIP5‘. It turned out that the results were ok, but we had made an error when reading and processing the model output. The particular climate model that initially gave the strange results had used a different calendar set-up to the previous models we had examined.
Mitigation of Climate Change – Part 3 of the new IPCC report

Guest post by Brigitte Knopf
Global emissions continue to rise further and this is in the first place due to economic growth and to a lesser extent to population growth. To achieve climate protection, fossil power generation without CCS has to be phased out almost entirely by the end of the century. The mitigation of climate change constitutes a major technological and institutional challenge. But: It does not cost the world to save the planet.
This is how the new report was summarized by Ottmar Edenhofer, Co-Chair of Working Group III of the IPCC, whose report was adopted on 12 April 2014 in Berlin after intense debates with governments. The report consists of 16 chapters with more than 2000 pages. It was written by 235 authors from 58 countries and reviewed externally by 900 experts. Most prominent in public is the 33-page Summary for Policymakers (SPM) that was approved by all 193 countries. At a first glance, the above summary does not sound spectacular but more like a truism that we’ve often heard over the years. But this report indeed has something new to offer.
The 2-degree limit
[Read more…] about Mitigation of Climate Change – Part 3 of the new IPCC report
Shindell: On constraining the Transient Climate Response
Guest commentary from Drew Shindell
There has been a lot of discussion of my recent paper in Nature Climate Change [cite ref=”(Shindell, 2014)”]10.1038/nclimate2136[/cite]. That study addressed a puzzle, namely that recent studies using the observed changes in Earth’s surface temperature suggested climate sensitivity is likely towards the lower end of the estimated range. However, studies evaluating model performance on key observed processes and paleoclimate evidence suggest that the higher end of sensitivity is more likely, partially conflicting with the studies based on the recent transient observed warming. The new study shows that climate sensitivity to historical changes in the abundance of aerosol particles in the atmosphere is larger than the sensitivity to CO2, primarily because the aerosols are largely located near industrialized areas in the Northern Hemisphere middle and high latitudes where they trigger more rapid land responses and strong snow & ice feedbacks. Therefore studies based on observed warming have underestimated climate sensitivity as they did not account for the greater response to aerosol forcing, and multiple lines of evidence are now consistent in showing that climate sensitivity is in fact very unlikely to be at the low end of the range in recent estimates.
[Read more…] about Shindell: On constraining the Transient Climate Response
Unforced variations: Apr 2014
More open thread. Unusually, we are keeping the UV Mar 2014 thread open for more Diogenetic conversation and to keep this thread open for more varied fare.
Impacts of Climate Change – Part 2 of the new IPCC Report has been approved
The second part of the new IPCC Report has been approved – as usual after lengthy debates – by government delegations in Yokohama (Japan) and is now public. Perhaps the biggest news is this: the situation is no less serious than it was at the time of the previous report 2007. Nonetheless there is progress in many areas, such as a better understanding of observed impacts worldwide and of the specific situation of many developing countries. There is also a new assessment of “smart” options for adaptation to climate change. The report clearly shows that adaptation is an option only if efforts to mitigate greenhouse gas emissions are strengthened substantially. Without mitigation, the impacts of climate change will be devastating.

Guest post by Wolfgang Cramer
[Read more…] about Impacts of Climate Change – Part 2 of the new IPCC Report has been approved