There has been a lot of commentary about perceived disagreements among climate scientists about whether climate change is, or will soon, accelerate. As with most punditry, there is less here than it might seem.
[Read more…] about Much ado about accelerationEl Nino
Not just another dot on the graph?
As the climate monitoring groups add an additional dot to their graphs this week, there is some disquiet among people paying attention about just how extraordinary 2023 really was.
[Read more…] about Not just another dot on the graph?Annual GMSAT predictions and ENSO
For the last few years (since at least 2016), I’ve shared predictions for the next annual global mean surface air temperature (GMSAT) anomaly based on the long term trend and the state of ENSO at the start of the year. Generally speaking, this has been quite skillful compared to persistence or just the long term trend alone – the eventual anomaly was consistently within the predicted bounds. Until 2023.
[Read more…] about Annual GMSAT predictions and ENSOTurning a new page[s]
The world is full of climate dashboards (and dashboards of dashboards), and so you might imagine that all datasets and comparisons are instantly available in whatever graphical form you like. Unfortunately, we often want graphics to emphasize a particular point or comparison, and generic graphs from the producers of the data often don’t have the same goal in mind. Dashboards that allow for more flexibility (like WoodForTrees) are useful, but aren’t as visually appealing as they could be. Thus, I find myself creating bespoke graphics of climate and climate model data all the time.
Some of these are maintained on the Climate model-observations comparison page but many of the graphs that I make (often to make a point on twitter) aren’t saved there and often their provenance is a bit obscure. Given that twitter will not last forever (though it might be around for slightly longer than a head of lettuce), it’s probably useful to have a spot to upload these graphics to, along with some explanation, to serve as a reference.
I have therefore created a couple of ‘pages’ (in wordpress speak) with fixed URLs where I will be curating relevant graphics I make (and findable at the bottom of the page under “DATA AND GRAPHICS”). The first is focused on the surface temperature records. I often update relevant graphics associated with this in early January (when we get another dot on the graphs), but there are associated graphs that I’ve made that don’t make it into those updates, so this is a place for them too. This includes the impacts of ENSO, comparisons across different platforms, or the impact of homogenization.
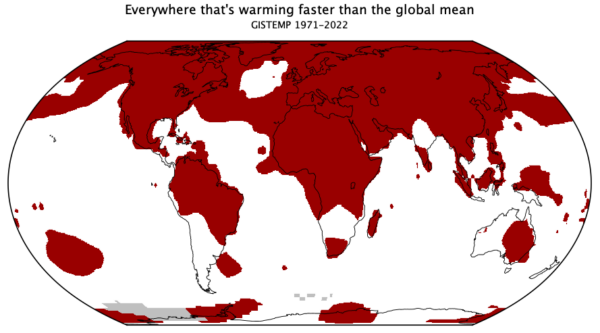
The second page is bit more eclectic. These are graphs that are relevant to some trope or talking point that often pops up, and my graphs are an attempt to provide context (usually), or to debunk it entirely. This is where you’ll find maps of where the climate is warming faster than the global average, time-series of river ice break-up dates, and an example of sensible scaling of CO2 changes and temperature.
To start with, I’m just going to upload some graphs I’ve made recently (with any updates that are needed), and I’ll add content as I make something new. If there are any other ideas (that aren’t too involved!), I’ll be happy to look at adding those too. Let me know if this is useful.
2022 updates to the temperature records
Another January, another annual data point.
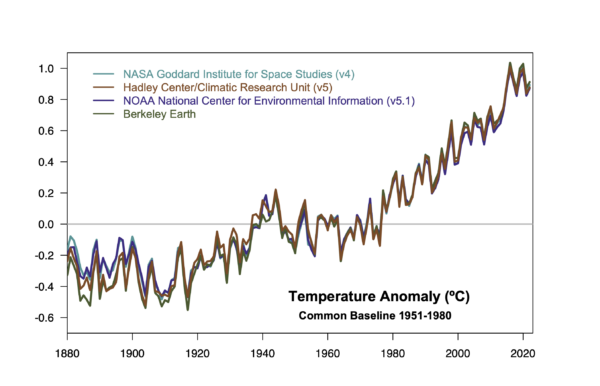
As in years past, the annual rollout of the GISTEMP, NOAA, HadCRUT and Berkeley Earth analyses of the surface temperature record have brought forth many stories about the long term trends and specific events of 2022 – mostly focused on the impacts of the (ongoing) La Niña event and the litany of weather extremes (UK and elsewhere having record years, intense rainfall and flooding, Hurricane Ian, etc. etc.).
But there are a few things that don’t get covered much in the mainstream stories, and so we can dig into them a bit here.
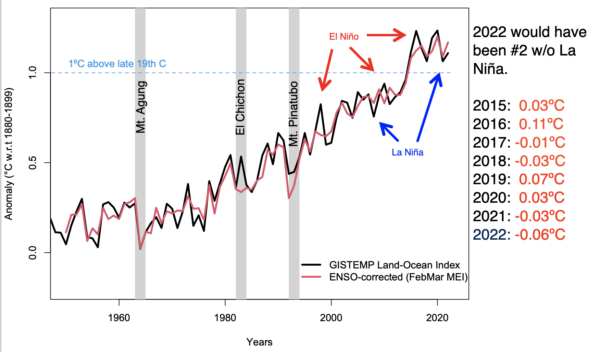
What influence does ENSO really have?
It’s well known (among readers here, I assume), that ENSO influences the interannual variability of the climate system and the annual mean temperatures. El Niño events enhance global warming (as in 1998, 2010, 2016 etc.) and La Niña events (2011, 2018, 2021, 2022 etc.) impart a slight cooling.
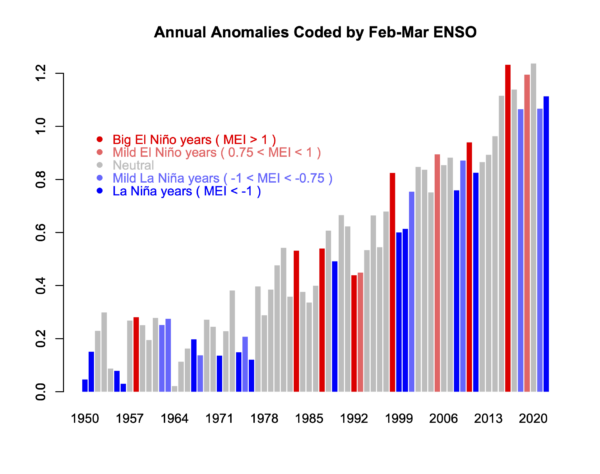
Consequently, a line drawn from an El Niño year to a subsequent La Niña year will almost always show a cooling – a fact well known to the climate disinformers (though they are not so quick to show the uncertainties in such cherry picks!). For instance, the trends from 2016 to 2022 are -0.12±0.37ºC/dec but with such large uncertainties, the calculation is meaningless. Far more predictive are the long term trends which are consistently (now) above 0.2ºC/dec (and with much smaller uncertainties ±0.02ºC/dec for the last 40 years).
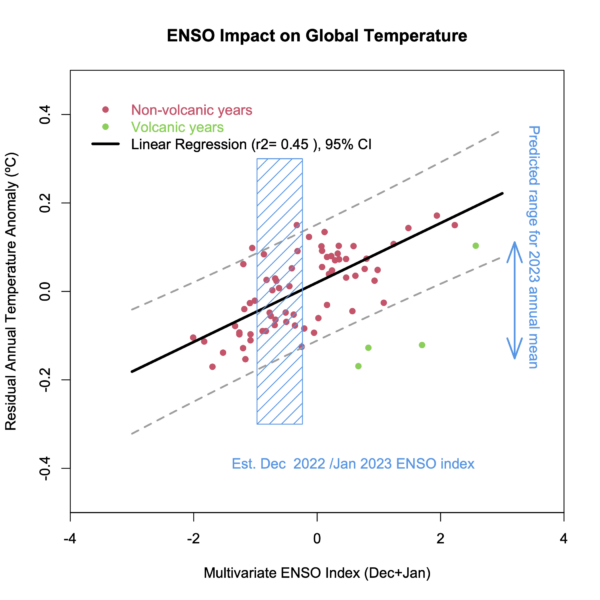
It’s worth exploring quantitatively what the impact is, and this is something I’ve been looking at for a while. It’s easy enough correlate the detrended annual anomalies with the ENSO index (maximum correlation is for the early spring values), and then use that regression to estimate the specific impact for any year, and to estimate an ENSO-corrected time series.
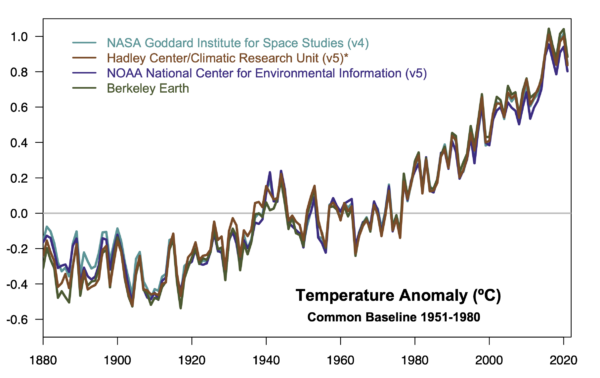
The surface temperature records are becoming more coherent
Back in 2013/2014, the differences between the surface indices (HadCRUT3, NOAA v3 and GISTEMP v3) contributed to the initial confusion related to the ‘pause’, which was seemingly evident in HadCRUT3, but not so much in the other records (see this discussion from 2015). Since then all of the series have adopted improved SST homogenization, and HadCRUT5 adopted a similar interpolation across the pole as was used in the GISTEMP products. From next month onwards, NOAA will move to v5.1 which will now incorporate Arctic buoy data (a great innovation) and also provide a spatially complete record. The consequence is that the surface instrument records will be far more coherent than they have ever been. Some differences remain pre-WW2 (lots of SST inhomogeneities to deal with) and in the 19th C (where data sparsity is a real challenge).
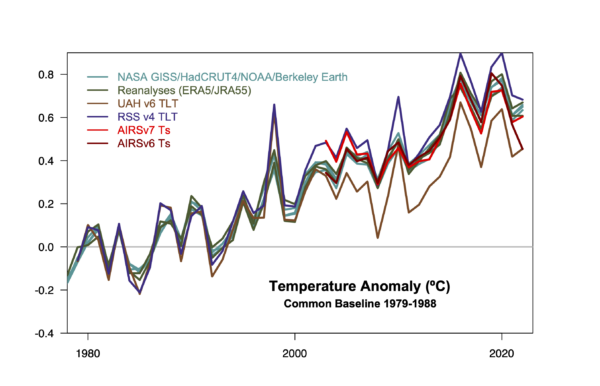
The structural uncertainty in satellite records is large
While the surface-based records are becoming more consistent, the various satellite records are as far apart as ever. The differences between the RSS and UAH TLT records are much larger than the spread in the surface records (indeed, they span those trends), making any claims of greater precision somewhat dubious. Similarly, the difference in the versions of the AIRS records (v6 vs. v7) of ground temperature anomalies produce quite distinct trends (in the case of AIRS v6, Nov 2022 was exceptionally cold, which was not seen in other records).
When will we reach 1.5ºC above the pre-industrial?
This was a very common question in the press interviews this week. It has a few distinct components – what is the ‘pre-industrial’ period that’s being referenced, what is the uncertainty in that baseline, and what are the differences in the long term records since then?
The latest IPCC report discusses this issue in some depth, but the basic notion is that since the impacts that are expected at 1.5ºC are derived in large part from the CMIP model simulations that have a nominal baseline of ~1850, ‘pre-industrial’ temperatures are usually assumed to be some kind of mid-19th Century average. This isn’t a universally accepted notion – Hawkins et al (2017) for instance, suggest we should use a baseline from the 18th Century – but it is one that easier to operationalise.
The baseline of 1880-1900 can be calculated for all the long temperature series, and with respect to that 2022 (or the last five years) is between 1.1 and 1.3ºC warmer (with Berkeley Earth showing the most warming). For the series that go back to 1850, the difference between 1850-1900 and 1880-1900 is 0.01 to 0.03ºC, so probably negligible for this purpose.
Linear trends since 1996 are robustly just over 0.2ºC/decade in all series, so that suggests between one and two decades are required to have the mean climate exceed 1.5ºC, that is around 2032 to 2042. The first specific year that breaches this threshold will come earlier and will likely be associated with a big El Niño. Assuming something like 2016 (a +0.11ºC effect), that implies you might see the excedence some 5 years earlier – say 2027 to 2037 (depending a little on the time-series you are following).
2023 is starting the year with a mild La Niña, which is being forecast to switch to neutral conditions by mid-year. Should we see signs of an El Niño developing towards the end of the year, that will heavily favor 2024 to be a new record, though not one that is likely to exceed 1.5ºC however you calculate it.
[Aside: In contrast to my reasoning here, the last decadal outlook from the the UK MetOffice/WMO suggested that 2024 has a 50-50 chance of exceeding 1.5ºC, some 5 or so years early than I’d suggest, and that an individual year might reach 1.7ºC above the PI in the next five years! I don’t know why this is different – it could be a larger variance associated with ENSO in their models, it could be a higher present day baseline (but I don’t think so), or a faster warming rate than the linear trend (which could relate to stronger forcings, or higher effective sensitivity). Any insight on this would be welcome!]
References
- E. Hawkins, P. Ortega, E. Suckling, A. Schurer, G. Hegerl, P. Jones, M. Joshi, T.J. Osborn, V. Masson-Delmotte, J. Mignot, P. Thorne, and G.J. van Oldenborgh, "Estimating Changes in Global Temperature since the Preindustrial Period", Bulletin of the American Meteorological Society, vol. 98, pp. 1841-1856, 2017. http://dx.doi.org/10.1175/BAMS-D-16-0007.1
Scafetta comes back for more
A new paper from Scafetta and it’s almost as bad as the last one.
Back in March, we outlined how a model-observations comparison paper in GRL by Nicola Scafetta (Scafetta, 2022a) got wrong basically everything that one could get wrong (the uncertainty in the observations, the internal variability in the models, the statistical basis for comparisons – the lot!). Now he’s back with a new paper in a different journal (Scafetta, 2022b) that could be seen as trying to patch the holes in the first one, but while he makes some progress, he now adds some new errors while attempting CPR on his original conclusions.
[Read more…] about Scafetta comes back for moreReferences
- N. Scafetta, "Advanced Testing of Low, Medium, and High ECS CMIP6 GCM Simulations Versus ERA5‐T2m", Geophysical Research Letters, vol. 49, 2022. http://dx.doi.org/10.1029/2022GL097716
- N. Scafetta, "CMIP6 GCM ensemble members versus global surface temperatures", Climate Dynamics, vol. 60, pp. 3091-3120, 2022. http://dx.doi.org/10.1007/s00382-022-06493-w
Mmm-k scale climate models
What’s good (and what’s not quite ready) about plans for ‘k-scale’ climate modeling?
[Read more…] about Mmm-k scale climate modelsAnother dot on the graph
So last week was the annual release of the temperature records from NASA, NOAA and Berkeley Earth. The Copernicus ERA5 data was released a few days ago, and the HadCRUT data will follow soon. Unlike in years past, there is no longer any serious discrepancy between the records – which use multiple approaches for the ocean temperatures, the homogenization of the weather stations records, and interpolation.
Depending on the product, 2021 was either the 5th, 6th or 7th warmest year, but in all cases, it is part of the string of warm years (since 2015) that have all been more than 1ºC warmer than the late 19th C.
[Read more…] about Another dot on the graphUnforced Variations: Mar 2021
This month’s open thread. Northern Hemisphere Spring is on it’s way, along with peak Arctic/minimum Antarctic sea ice, undoubtedly more discussion about the polar vortex, and the sharpening up of the (currently very uncertain) ENSO forecast for the rest of this year.
2020 Hindsight
Yesterday was the day that NASA, NOAA, the Hadley Centre and Berkeley Earth delivered their final assessments for temperatures in Dec 2020, and thus their annual summaries. The headline results have received a fair bit of attention in the media (NYT, WaPo, BBC, The Guardian etc.) and the conclusion that 2020 was pretty much tied with 2016 for the warmest year in the instrumental record is robust.
[Read more…] about 2020 Hindsight