• Skip to primary navigation
  • Skip to main content
  • Skip to primary sidebar
  • Skip to footer

RealClimate

Climate science from climate scientists...

  • Start here
  • Model-Observation Comparisons
  • Miscellaneous Climate Graphics
  • Surface temperature graphics
You are here: Home / 2015 / Archives for January 2015

Archives for January 2015

Thoughts on 2014 and ongoing temperature trends

22 Jan 2015 by Gavin

Last Friday, NASA GISS and NOAA NCDC had a press conference and jointly announced the end-of-year analysis for the 2014 global surface temperature anomaly which, in both analyses, came out top. As you may have noticed, this got much more press attention than their joint announcement in 2013 (which wasn’t a record year).

In press briefings and interviews I contributed to, I mostly focused on two issues – that 2014 was indeed the warmest year in those records (though by a small amount), and the continuing long-term trends in temperature which, since they are predominantly driven by increases in greenhouse gases, are going to continue and hence produce (on a fairly regular basis) continuing record years. Response to these points has been mainly straightforward, which is good (if sometimes a little surprising), but there have been some interesting issues raised as well…
[Read more…] about Thoughts on 2014 and ongoing temperature trends
Filed Under: Climate Science, El Nino, Instrumental Record, Reporting on climate

A new sea level curve

14 Jan 2015 by Stefan

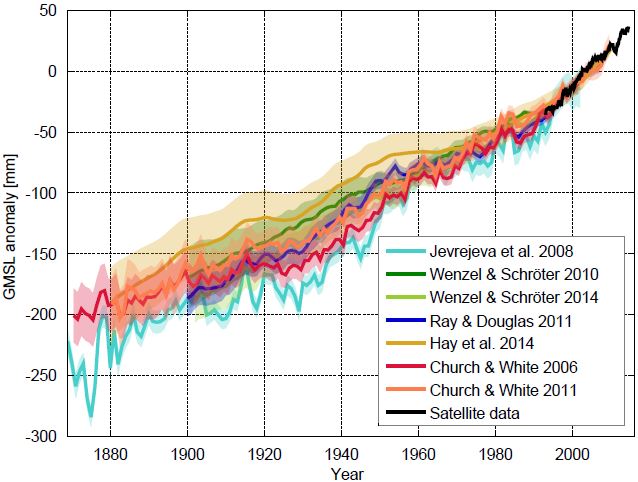
The “zoo” of global sea level curves calculated from tide gauge data has grown – tomorrow a new reconstruction of our US colleagues around Carling Hay from Harvard University will appear in Nature (Hay et al. 2015). That is a good opportunity for an overview over the available data curves. The differences are really in the details, the “big picture” of sea-level rise does not change. In all curves, the current rates of rise are the highest since records began.

The following graph shows the new sea level curve as compared to six known ones.

haysl1

Fig 1 Sea level curves calculated by different research groups with various methods. The curves show the sea level relative to the satellite era (since 1992). Graph: Klaus Bittermann.

All curves show the well-known modern sea level rise, but the exact extent and time evolution of the rise differ somewhat. Up to about 1970, the new reconstruction of Hay et al. runs at the top of the existing uncertainty range. For the period from 1880 AD, however, it shows the same total increase as the current favorites by Church & White. Starting from 1900 AD it is about 25 mm less. This difference is at the margins of significance: the uncertainty ranges overlap. [Read more…] about A new sea level curve

References

  1. C.C. Hay, E. Morrow, R.E. Kopp, and J.X. Mitrovica, "Probabilistic reanalysis of twentieth-century sea-level rise", Nature, vol. 517, pp. 481-484, 2015. http://dx.doi.org/10.1038/nature14093

Filed Under: Climate Science, Instrumental Record, Oceans

Diagnosing Causes of Sea Level Rise

8 Jan 2015 by eric

Guest post by Sarah G. Purkey and Gregory C. Johnson,
University of Washington / NOAA

I solicited this post from colleagues at the University of Washington. I found their paper particularly interesting because it gets at the question of sea level rise from a combination of ocean altimetry and density (temperature + salinity) data. This kind of measurement and calculation has not really been possible — not at this level of detail — until quite recently. A key finding is that one can reconcile various different estimates of the contributions to observed sea level rise only if the significant warming of the deep ocean is accounted for. There was a good write-up in The Guardian back when the paper came out.– Eric Steig


Sea leave rise reveals a lot about our changing climate. A rise in the mean sea level can be caused by decreases in ocean density, mostly reflecting an increase in ocean temperature — this is steric sea level rise. It can also be caused by an increase in ocean mass, reflecting a gain of fresh water from land. A third, and smaller, contribution to mean sea level is from glacial isostatic adjustment. The contribution of glacial isostatic adjustment, while small, has a range of possible values and can be a significant source of uncertainty in sea level budgets. Over recent decades, very roughly half of the observed mean sea level rise is owing to changes in ocean density with the other half owing to the increased in ocean mass, mostly from melting glaciers and polar ice sheets. The exact proportion has been difficult to pin down with great certainty. [Read more…] about Diagnosing Causes of Sea Level Rise

References

  1. S.G. Purkey, G.C. Johnson, and D.P. Chambers, "Relative contributions of ocean mass and deep steric changes to sea level rise between 1993 and 2013", Journal of Geophysical Research: Oceans, vol. 119, pp. 7509-7522, 2014. http://dx.doi.org/10.1002/2014JC010180

Filed Under: Climate Science, Oceans

Unforced Variations: Jan 2015

7 Jan 2015 by group

This month’s open thread. Sorry for the slow start – you know what it’s like after the holidays…

Filed Under: Climate Science, Open thread

Primary Sidebar

Search

Search for:

Email Notification

get new posts sent to you automatically (free)
Loading

Recent Posts

  • The most recent climate status
  • Unforced variations: May 2025
  • Unforced Variations: Apr 2025
  • WMO: Update on 2023/4 Anomalies
  • Andean glaciers have shrunk more than ever before in the entire Holocene
  • Climate change in Africa

Our Books

Book covers
This list of books since 2005 (in reverse chronological order) that we have been involved in, accompanied by the publisher’s official description, and some comments of independent reviewers of the work.
All Books >>

Recent Comments

  • Piotr on Unforced variations: May 2025
  • William on The most recent climate status
  • Mr. Know It All on Unforced variations: May 2025
  • Piotr on The most recent climate status
  • Nigelj on Unforced variations: May 2025
  • Kevin McKinney on Unforced variations: May 2025
  • Kevin McKinney on The most recent climate status
  • Kevin McKinney on The most recent climate status
  • Kevin McKinney on The most recent climate status
  • Mr. Know It All on The most recent climate status
  • K on Unforced variations: May 2025
  • Tomáš Kalisz on Unforced variations: May 2025
  • Tomáš Kalisz on Unforced variations: May 2025
  • Piotr on Unforced variations: May 2025
  • Piotr on Unforced variations: May 2025
  • Susan Anderson on Unforced variations: May 2025
  • Ken Towe on The most recent climate status
  • Keith Woollard on The most recent climate status
  • Dan on Unforced variations: May 2025
  • Nigelj on The most recent climate status

Footer

ABOUT

  • About
  • Translations
  • Privacy Policy
  • Contact Page
  • Login

DATA AND GRAPHICS

  • Data Sources
  • Model-Observation Comparisons
  • Surface temperature graphics
  • Miscellaneous Climate Graphics

INDEX

  • Acronym index
  • Index
  • Archives
  • Contributors

Realclimate Stats

1,365 posts

11 pages

243,163 comments

Copyright © 2025 · RealClimate is a commentary site on climate science by working climate scientists for the interested public and journalists.