• Skip to primary navigation
  • Skip to main content
  • Skip to primary sidebar
  • Skip to footer

RealClimate

Climate science from climate scientists...

  • Start here
  • Model-Observation Comparisons
  • Miscellaneous Climate Graphics
  • Surface temperature graphics
You are here: Home / 2020 / Archives for December 2020

Archives for December 2020

2020 vision

29 Dec 2020 by Gavin

A meeting of smoke and storms (NASA Earth Observatory)

No-one needs another litany of all the terrible things that happened this year, but there are three areas relevant to climate science that are worth thinking about:

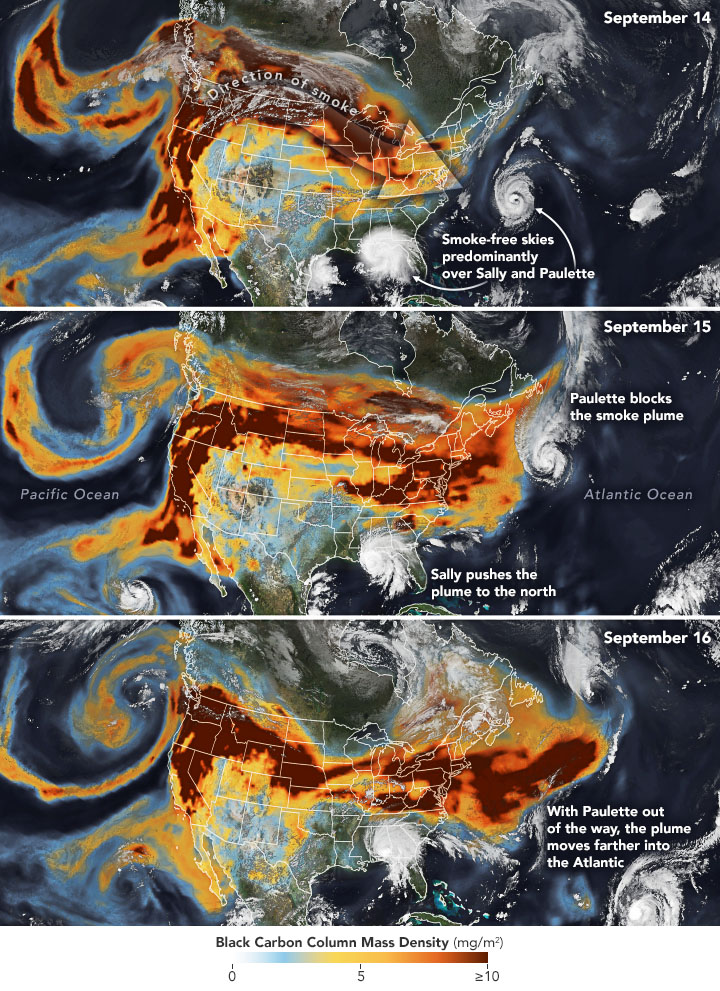
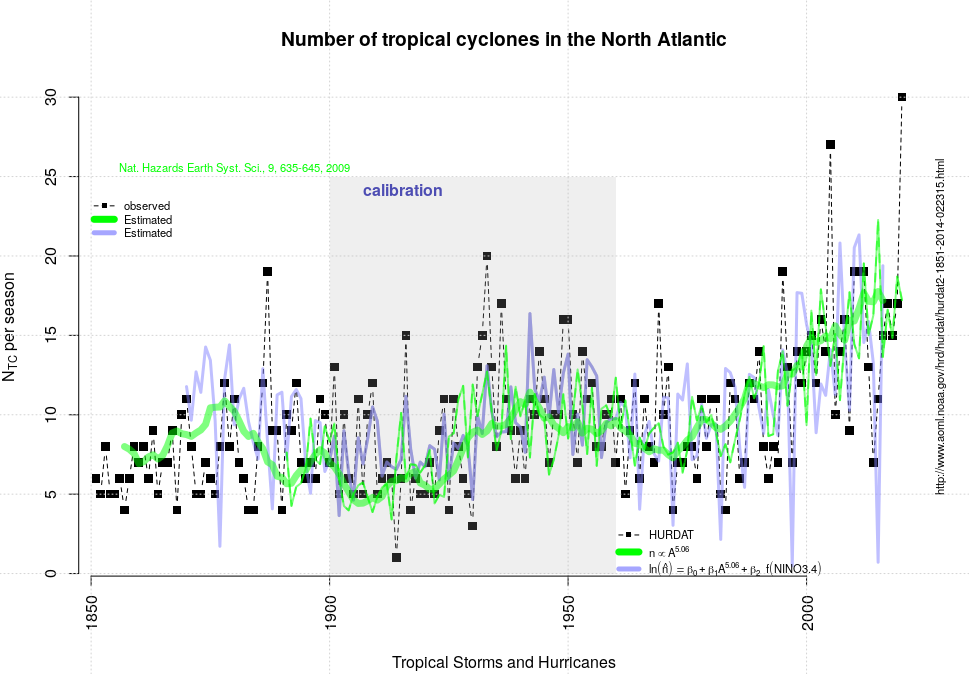
  • What actually happened in climate/weather (and how they can be teased apart). There is a good summary on the BBC radio Discover program covering wildfires, heat waves, Arctic sea ice, the hurricane season, etc. featuring Mike Mann, Nerlie Abram, Sarah Perkins-Kilpatrick, Steve Vavrus and others. In particular, there were also some new analyses of hurricanes (their rapid intensification, slowing, greater precipitation levels etc.), as well as the expanding season for tropical storms that may have climate change components. Yale Climate Connections also has a good summary.
  • The accumulation of CMIP6 results. We discussed some aspects of these results extensively – notably the increased spread in Equilibrium Climate Sensitivity, but there is a lot more work to be done on analyzing the still-growing database that will dominate the discussion of climate projections for the next few years. Of particular note will be the need for more sophisticated analyses of these model simulations that take into account observational constraints on ECS and a wider range of future scenarios (beyond just the SSP marker scenarios that were used in CMIP). These issues will be key for the upcoming IPCC 6th Assessment Report and the next National Climate Assessment.
  • The intersection of climate and Covid-19.
    • The direct connections are clear – massive changes in emissions of aerosols, short-lived polluting gases (like NOx) and CO2 – mainly from reductions in transportation. Initial results demonstrated a clear connection between cleaner air and the pandemic-related restrictions and behavioural changes, but so far the impacts on temperature or other climate variables appear to be too small to detect (Freidlingstein et al, 2020). The impact on global CO2 emissions (LeQuere et al, 2020) has been large (about 10% globally) – but not enough to stop CO2 concentrations from continuing to rise (that would need a reduction of more like 70-80%). Since the impact from CO2 is cumulative this won’t make a big difference in future temperatures unless it is sustained through post-pandemic changes.
    • The metaphorical connections are also clear. The instant rise of corona virus-denialism, the propagation of fringe viewpoints from once notable scientists, petitions to undermine mainstream epidemiology, politicized science communications, and the difficulty in matching policy to science (even for politicians who want to just ‘follow the science’), all seem instantly recognizable from a climate change perspective. The notion that climate change was a uniquely wicked problem (because of it’s long term and global nature) has evaporated as quickly as John Ioannidis’ credibility.

I need to take time to note that there has been human toll of Covid-19 on climate science, ranging from the famous (John Houghton) to the families of people you never hear about in the press but whose work underpins the data collection, analysis and understanding we all rely on. This was/is a singular tragedy.

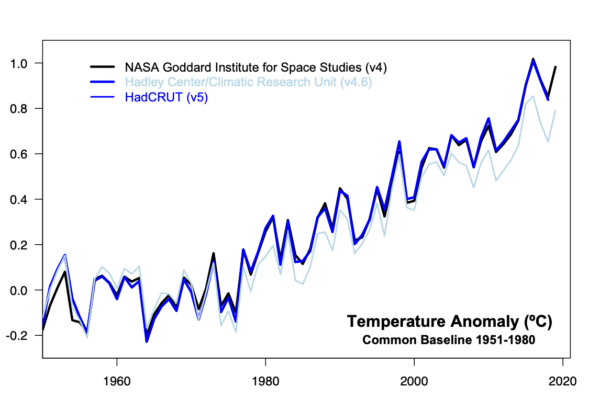
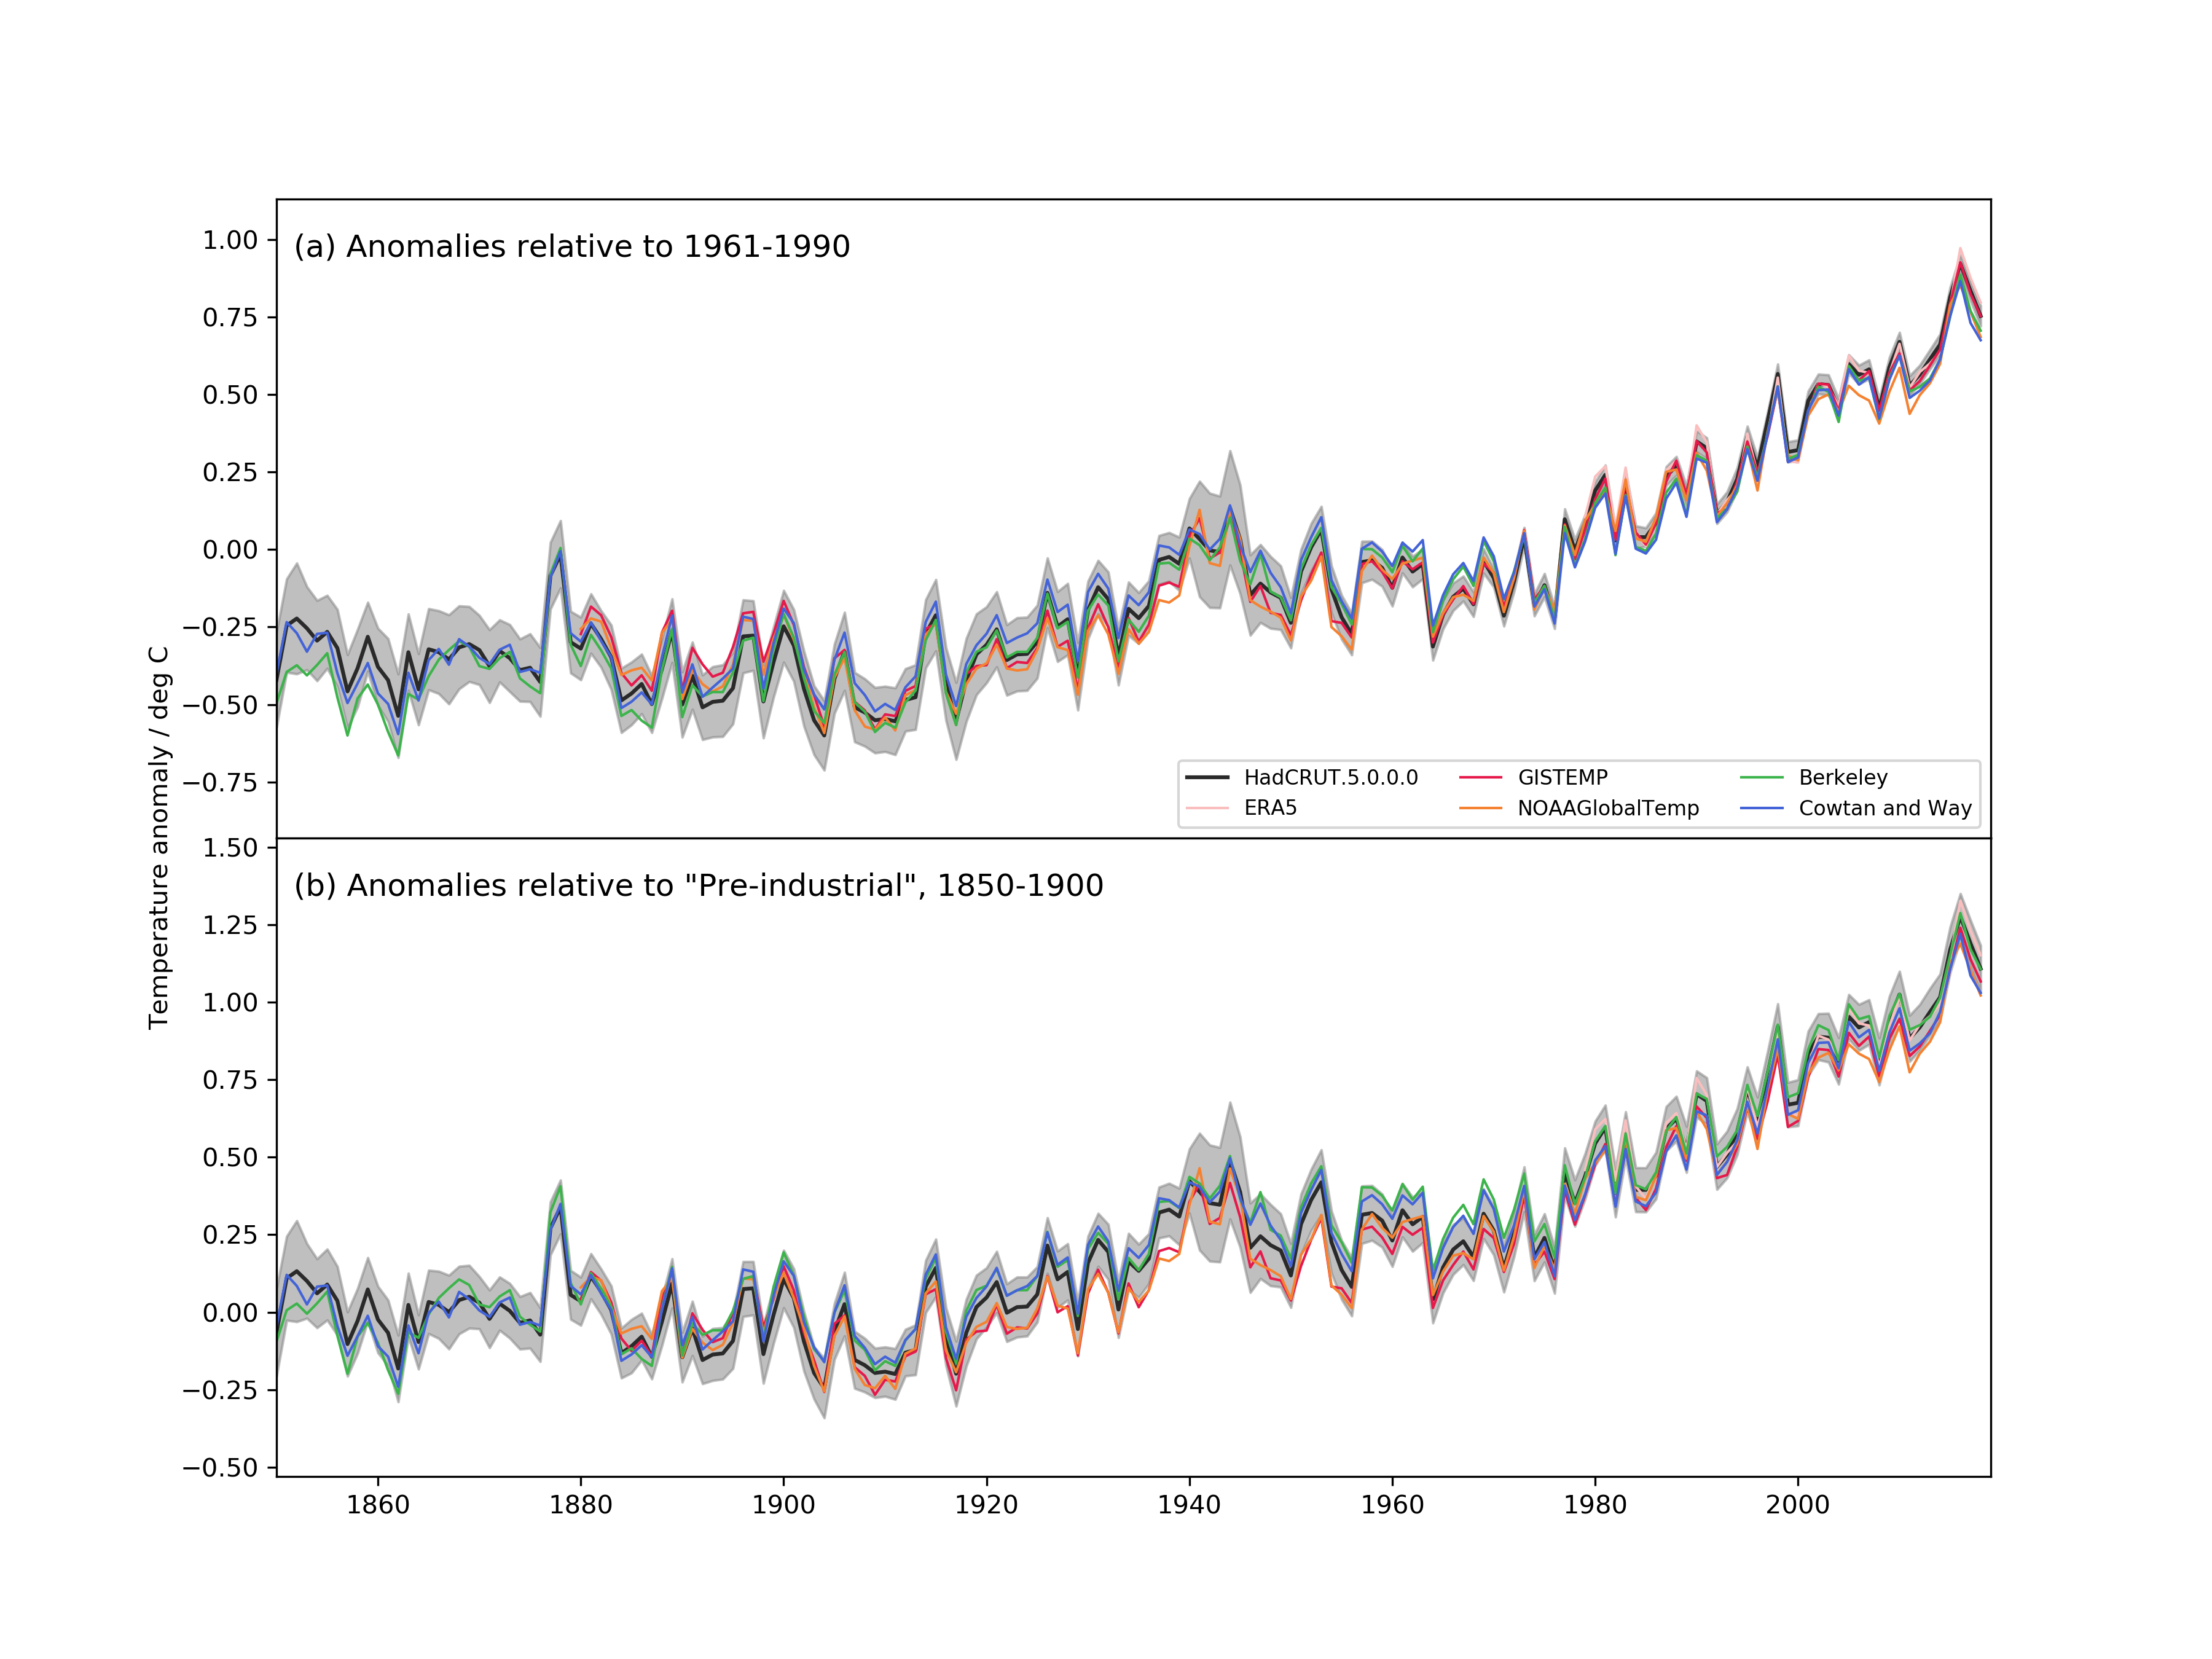
With the La Niña now peaking in the tropical Pacific, we can expect a slightly cooler year in 2021 and perhaps a different character of weather events, though the long-term trends will persist. My hope is that the cracks in the system that 2020 has revealed (across a swathe of issues) can serve as an motivation to improve resilience, equity and planning, across the board. That might well be the most important climate impact of all.

A happier new year to you all.

References

  1. P.M. Forster, H.I. Forster, M.J. Evans, M.J. Gidden, C.D. Jones, C.A. Keller, R.D. Lamboll, C.L. Quéré, J. Rogelj, D. Rosen, C. Schleussner, T.B. Richardson, C.J. Smith, and S.T. Turnock, "Current and future global climate impacts resulting from COVID-19", Nature Climate Change, vol. 10, pp. 913-919, 2020. http://dx.doi.org/10.1038/s41558-020-0883-0
  2. C. Le Quéré, R.B. Jackson, M.W. Jones, A.J.P. Smith, S. Abernethy, R.M. Andrew, A.J. De-Gol, D.R. Willis, Y. Shan, J.G. Canadell, P. Friedlingstein, F. Creutzig, and G.P. Peters, "Temporary reduction in daily global CO2 emissions during the COVID-19 forced confinement", Nature Climate Change, vol. 10, pp. 647-653, 2020. http://dx.doi.org/10.1038/s41558-020-0797-x

Filed Under: Climate impacts, Climate modelling, Climate Science, coronavirus, El Nino, Hurricanes, skeptics

The number of tropical cyclones in the North Atlantic

23 Dec 2020 by rasmus


2020 has been an unusual and challenging year in many ways. One was the record-breaking number of named tropical cyclones in the North Atlantic (and the Carribean Sea). There has been 30 named North Atlantic tropical cyclones in 2020, beating the previous record of 28 from 2005 by two.

A natural question then is whether we can expect this high number in the future or if the number of tropical storms will continue to increase. A high number of such events is equivalent to a high frequency of tropical cyclones.

But we should expect fewer tropical cyclones generally in a warmer world according to the IPCC “SREX” report from 2012, and those that form may become even more powerful than the ones that we have observed to date:

There is generally low confidence in projections of changes in extreme winds because of the relatively few studies of projected extreme winds, and shortcomings in the simulation of these events. An exception is mean tropical cyclone maximum wind speed, which is likely to increase, although increases may not occur in all ocean basins. It is likely that the global frequency of tropical cyclones will either decrease or remain essentially unchanged…

So how does this conclusion relate to the number of tropical cyclones in the North Atlantic with a new record this season? One reason to look in more detail at the North Atlantic is because its observational record is believed to be more complete and more reliable than for other regions around the world.

The observational record may also suggest that the number of tropical cyclones in the North Atlantic has increased slowly over the 50 years in addition to year-to-year fluctuations around this trend (black symbols in Fig 1).

We know that the number of cyclones is sensitive to the time of the year (hence, hurricane seasons), phenomena such as El Niño Southern Oscillation (ENSO) and the Madden Julian Oscillation (MJO), and geography (the ocean basin shape and the latitude). We also know that the sea surface needs to be warmer than 26.5°C for them to form.

The role of sea surface temperature is indeed an important factor, and from physical reasoning, one would think that the number of tropical cyclones depends on the area of warm sea surface A (sea surface temperature exceeding 26.5°C).

One explanation for why the area is a key factor may be that the probability of finding favourable conditions with right ‘seed’ for organised convection (e.g. easterly waves) and no wind shear increases when there is a greater region with sufficient sea surface temperatures.

The area of warm sea surface is mentioned in the IPCC SREX that dismisses the expectation that an increase in the area extent of the region of 26°C sea surface temperature should lead to increases in tropical cyclone frequency. Specifically it says that there is

a growing body of evidence that the minimum SST [sea surface temperature] threshold for tropical cyclogenesis increases at about the same rate as the SST increase due solely to greenhouse gas forcing.

On the other hand, there has also been some indication that the number of tropical cyclones does seem to be proportional to the area to the power of 5: n \propto A^5 (Benestad, 2008). When this relationship is extended to recent years, as shown with the green and blue curves in Fig 1, we see an increase that this crude estimate more or less follows the observed number of evens.

Global warming implies a greater area with sea surface exceeding the threshold of 26.5°C for tropical cyclone genesis. Also, the nonlinear dependency to A implies few events and little trend as long as A is below a critical size. The combination of a nonlinear relationship and a critical threshold area could explain why it is difficult to detect a trend in the historical data.

There is some good news in that A is limited by the geometry of the ocean basin. Nevertheless, a potential nonlinear connection between the number of tropical cyclones and A is a concern. If this cannot be falsified, then the tropical cyclones represent a more potent danger than anticipated by the IPCC SREX conclusions. So let’s hope that somebody is able to show that the analysis presented in (Benestad, 2008) is wrong.

Fig 1. Observed (black symbols) and estimated (green and blue curves) number of named tropical cyclones in the North Atlantic and the Caribbean Sea after (Benestad, 2008). Source: “demo(tropicalcyclones)”.

References

  1. R.E. Benestad, "On tropical cyclone frequency and the warm pool area", Natural Hazards and Earth System Sciences, vol. 9, pp. 635-645, 2009. http://dx.doi.org/10.5194/nhess-9-635-2009

Filed Under: Climate Science

An ever more perfect dataset?

15 Dec 2020 by Gavin

Do you remember when global warming was small enough for people to care about the details of how climate scientists put together records of global temperature history? Seems like a long time ago…

Nonetheless, it’s worth a quick post to discuss the latest updates in HadCRUT (the data product put together by the UK’s Hadley Centre and the Climatic Research Unit at the University of East Anglia). They have recently released HadCRUT5 (Morice et al., 2020), which marks a big increase in the amount of source data used (similarly now to the upgrades from GHCN3 to GHCN4 used by NASA GISS and NOAA NCEI, and comparable to the data sources used by Berkeley Earth). Additionally, they have improved their analysis of the sea surface temperature anomalies (a perennial issue) which leads to an increase in the recent trends. Finally, they have started to produce an infilled data set which uses an extrapolation to fill in data-poor areas (like the Arctic – first analysed by us in 2008…) that were left blank in HadCRUT4 (so similar to GISTEMP, Berkeley Earth and the work by Cowtan and Way). Because the Arctic is warming faster than the global mean, the new procedure corrects a bias that existing in the previous global means (by about 0.16ºC in 2018 using a 1951-1980 baseline). Combined, the new changes give a result that is much closer to the other products:

Differences persist around 1940, or in earlier decades, mostly due to the treatment of ocean temperatures in HadSST4 vs. ERSST5.

In conclusion, this update further solidifies the robustness of the surface temperature record, though there are still questions to be addressed, and there remain mountains of old paper records to be digitized.

The implications of these updates for anything important (such as the climate sensitivity or the carbon budget) will however be minor because all sensible analyses would have been using a range of surface temperature products already.

With 2020 drawing to a close, the next annual update and intense comparison of all these records, including the various satellite-derived global products (UAH, RSS, AIRS) will occur in January. Hopefully, HadCRUT5 will be extended beyond 2018 by then.

In writing this post, I noticed that we had written up a detailed post on the last HadCRUT update (in 2012). Oddly enough the issues raised were more or less the same, and the most important conclusion remains true today:

First and foremost is the realisation that data synthesis is a continuous process. Single measurements are generally a one-time deal. Something is measured, and the measurement is recorded. However, comparing multiple measurements requires more work – were the measuring devices calibrated to the same standard? Were there biases in the devices? Did the result get recorded correctly? Over what time and space scales were the measurements representative? These questions are continually being revisited – as new data come in, as old data is digitized, as new issues are explored, and as old issues are reconsidered. Thus for any data synthesis – whether it is for the global mean temperature anomaly, ocean heat content or a paleo-reconstruction – revisions over time are both inevitable and necessary.

References

  1. , 2021. https://www.metoffice.gov.uk/hadobs/hadcrut5/HadCRUT5_accepted.pdf

Filed Under: Climate impacts, Climate Science, Instrumental Record

Forced responses: Dec 2020

10 Dec 2020 by group

The bimonthly open thread on climate solution discussions. Topics might focus on the incoming Biden administration, the five year anniversary of the Paris Accords, and the challenge of making post-covid plans sustainable. Climate science issues should be raised here.

Filed Under: Open thread, Solutions

Unforced variations: Dec 2020

1 Dec 2020 by group

This month’s open thread. Topics might include the record breaking hurricane season, odds for the warmest year horse race (and it’s relevance or not), or indeed anything climate science related.

Filed Under: Climate Science, Open thread

Primary Sidebar

Search

Search for:

Email Notification

get new posts sent to you automatically (free)
Loading

Recent Posts

  • The most recent climate status
  • Unforced variations: May 2025
  • Unforced Variations: Apr 2025
  • WMO: Update on 2023/4 Anomalies
  • Andean glaciers have shrunk more than ever before in the entire Holocene
  • Climate change in Africa

Our Books

Book covers
This list of books since 2005 (in reverse chronological order) that we have been involved in, accompanied by the publisher’s official description, and some comments of independent reviewers of the work.
All Books >>

Recent Comments

  • Piotr on Unforced variations: May 2025
  • William on The most recent climate status
  • Mr. Know It All on Unforced variations: May 2025
  • Piotr on The most recent climate status
  • Nigelj on Unforced variations: May 2025
  • Kevin McKinney on Unforced variations: May 2025
  • Kevin McKinney on The most recent climate status
  • Kevin McKinney on The most recent climate status
  • Kevin McKinney on The most recent climate status
  • Mr. Know It All on The most recent climate status
  • K on Unforced variations: May 2025
  • Tomáš Kalisz on Unforced variations: May 2025
  • Tomáš Kalisz on Unforced variations: May 2025
  • Piotr on Unforced variations: May 2025
  • Piotr on Unforced variations: May 2025
  • Susan Anderson on Unforced variations: May 2025
  • Ken Towe on The most recent climate status
  • Keith Woollard on The most recent climate status
  • Dan on Unforced variations: May 2025
  • Nigelj on The most recent climate status

Footer

ABOUT

  • About
  • Translations
  • Privacy Policy
  • Contact Page
  • Login

DATA AND GRAPHICS

  • Data Sources
  • Model-Observation Comparisons
  • Surface temperature graphics
  • Miscellaneous Climate Graphics

INDEX

  • Acronym index
  • Index
  • Archives
  • Contributors

Realclimate Stats

1,365 posts

11 pages

243,163 comments

Copyright © 2025 · RealClimate is a commentary site on climate science by working climate scientists for the interested public and journalists.