What does a new entrant in the lower troposphere satellite record stakes really imply?
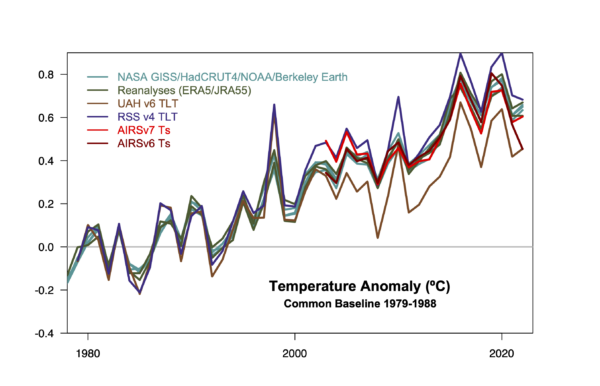
At the beginning of the year, we noted that the NOAA-STAR group had produced a new version (v5.0) of their MSU TMT satellite retrievals which was quite a radical departure from the previous version (4.1). It turns out that v5 has a notable lower trend than v4.1, which had the highest trend among the UAH and RSS retrievals. The paper describing the new version (Zou et al., 2023) came out in March, and with it the availability of not only updated TMT and TLS records (which had existed in the version 4.1), but also a new TLT (Temperature of the Lower Troposphere) record (from 1981 to present). The updated TMT series was featured in the model data comparison already, but we haven’t yet shown the new TLT data in context.
[Read more…] about A NOAA-STAR dataset is born…References
- C. Zou, H. Xu, X. Hao, and Q. Liu, "Mid‐Tropospheric Layer Temperature Record Derived From Satellite Microwave Sounder Observations With Backward Merging Approach", Journal of Geophysical Research: Atmospheres, vol. 128, 2023. http://dx.doi.org/10.1029/2022JD037472
 ).
).