Our various graphics and model-observation comparisons have been updated with 2025 data. There are a few version updates that make some difference (particularly in sea ice extent), but the basic story is similar to last year. Feel free to comment and/or suggest changes for the future, including potential new comparisons.
MSU
Melange à Trois
In honor of the revelation today, that Koonin, Christy and Spencer have been made Special Government Employees at the Dept. of Energy, we present a quick round up of our commentary on the caliber of their arguments we’ve posted here over the last decade or so.
TL;DR? The arguments are not very good.
[Read more…] about Melange à Trois2024 Hindsight
To no-one’s surprise 2024 was the warmest year on record – and by quite a clear margin.
[Read more…] about 2024 HindsightSpencer’s Shenanigans
A recent sensible-sounding piece by Roy Spencer for the Heritage foundation is full of misrepresentations. Let’s play spot the fallacy.
[Read more…] about Spencer’s ShenanigansNot just another dot on the graph? Part II
Annual updates to the model-observation comparisons for 2023 are now complete. The comparisons encompass surface air temperatures, mid-troposphere temperatures (global and tropical, and ‘corrected’), sea surface temperatures, and stratospheric temperatures. In almost every case, the addition of the 2023 numbers was in line with the long term expectation from the models.
[Read more…] about Not just another dot on the graph? Part IIA NOAA-STAR dataset is born…
What does a new entrant in the lower troposphere satellite record stakes really imply?
At the beginning of the year, we noted that the NOAA-STAR group had produced a new version (v5.0) of their MSU TMT satellite retrievals which was quite a radical departure from the previous version (4.1). It turns out that v5 has a notable lower trend than v4.1, which had the highest trend among the UAH and RSS retrievals. The paper describing the new version (Zou et al., 2023) came out in March, and with it the availability of not only updated TMT and TLS records (which had existed in the version 4.1), but also a new TLT (Temperature of the Lower Troposphere) record (from 1981 to present). The updated TMT series was featured in the model data comparison already, but we haven’t yet shown the new TLT data in context.
[Read more…] about A NOAA-STAR dataset is born…References
- C. Zou, H. Xu, X. Hao, and Q. Liu, "Mid‐Tropospheric Layer Temperature Record Derived From Satellite Microwave Sounder Observations With Backward Merging Approach", Journal of Geophysical Research: Atmospheres, vol. 128, 2023. http://dx.doi.org/10.1029/2022JD037472
Some new CMIP6 MSU comparisons
We add some of the CMIP6 models to the updateable MSU [and SST] comparisons.
After my annual update, I was pointed to some MSU-related diagnostics for many of the CMIP6 models (24 of them at least) from Po-Chedley et al. (2022) courtesy of Ben Santer. These are slightly different to what we have shown for CMIP5 in that the diagnostic is the tropical corrected-TMT (following Fu et al., 2004) which is a better representation of the mid-troposphere than the classic TMT diagnostic through an adjustment using the lower stratosphere record (i.e.  ).
).
References
- S. Po-Chedley, J.T. Fasullo, N. Siler, Z.M. Labe, E.A. Barnes, C.J.W. Bonfils, and B.D. Santer, "Internal variability and forcing influence model–satellite differences in the rate of tropical tropospheric warming", Proceedings of the National Academy of Sciences, vol. 119, 2022. http://dx.doi.org/10.1073/pnas.2209431119
- Q. Fu, C.M. Johanson, S.G. Warren, and D.J. Seidel, "Contribution of stratospheric cooling to satellite-inferred tropospheric temperature trends", Nature, vol. 429, pp. 55-58, 2004. http://dx.doi.org/10.1038/nature02524
How not to science
A trip down memory lane and a lesson on scientific integrity.
I had reason to be reviewing the history of MSU satellite retrievals for atmospheric temperatures recently. It’s a fascinating story of technology, creativity, hubris, error, imagination, rivalry, politics, and (for some) a search for scientific consilience – worthy of movie script perhaps? – but I want to highlight a minor little thing. Something so small that I’d never noticed it before, and I don’t recall anyone else pointing it out, but it is something I find very telling.
The story starts in the early 90’s, but what caught my eye was a single line in an op-ed (sub. req.) written two decades later:
… in 1994 we published an article in the journal Nature showing that the actual global temperature trend was “one-quarter of the magnitude of climate model results.”McNider and Christy, Feb 19th 2014, Wall Street Journal
Most of the op-ed is a rather tired rehash of faux outrage based on a comment made by John Kerry (the then Secretary of State) and we can skip right past that. It’s only other claim of note is a early outing of John Christy’s misleading graphs comparing the CMIP5 models to the satellite data but we’ll get back to that later.
First though, let’s dig into that line. The 1994 article is a short correspondence piece in Nature, where Christy and McNider analyzed MSU2R lower troposphere dataset and using ENSO and stratospheric volcanic effects to derive an ‘underlying’ global warming trend of 0.09 K/decade. This was to be compared with “warming rates of 0.3 to 0.4 K/decade” from models which was referenced to Manabe et al. (1991) and Boer et al. (1992). Hence the “one quarter” claim.
But lets dig deeper into each of those elements in turn. First, 1994 was pretty early on in terms of MSU science. The raw trend in the (then Version C) MSU2R record from 1979-1993 was -0.04 K/decade. [Remember ‘satellite cooling’?]. This was before Wentz and Schabel (1998) pointed out that orbital decay in the NOAA satellites was imparting a strong cooling bias (about 0.12 K/decade) on the MSU2R (TLT) record. Secondly, the two cited modeling papers don’t actually give an estimated warming trends for the 1980s and early 90s. The first is a transient model run using a canonical 1% increasing CO<sub>2</sub> – a standard experiment, but not one intended to match the real world growth of CO2 concentrations. The second model study is a simple equilibrium 2xCO2 run with the Canadian climate model, and does not report relevant transient warming rates at all. This odd referencing was pointed out in correspondence with Spencer and Christy by Hansen et al. (1995) who also noted that underlying model SAT trends for the relevant period were expected to be more like 0.1-0.15 K/decade. So the claim that the MSU temperatures were warming at “one quarter” the rate of the models wasn’t even valid in 1994. They might have more credibly claimed “two thirds” the rate, but the uncertainties are such that no such claim would have been robust (for instance, just the uncertainties on the linear regression alone are ~ +/-0.14 K/dec).
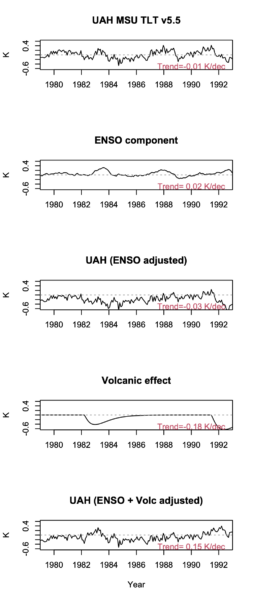
But it gets worse. In 2014, McNider and Christy were well aware of the orbital decay correction (1998), and they were even aware of the diurnal drift correction that was needed because of a sign error introduced while trying to fix the orbital decay issue (discovered in 2005). The version of the MSU2R product at the beginning of 2014 was version 5.5, and that had a raw trend of -0.01 K/decade 1979-1993 (+/- 0.18 K/dec 95% CI, natch). Using an analogous methodology to that used in 1994 (see figure to the right), the underlying linear trend after accounting for ENSO and volcanic aerosols was…. 0.15 K/dec! Almost identical to the expected trend from models!
So not only was their original claim incorrect at the time, but had they repeated the analysis in 2014, their own updated data and method would have shown that there was no discrepancy at all.
Now in 2014, there was a longer record and more suitable models to compare to. Models had been run with appropriate volcanic forcings and in large enough ensembles that there was a quantified spread of expected trends. Comparisons could now be done in a more sophisticated away, that compared like with like and took account of many different elements of uncertainty (forcings, weather, structural effects in models and observations etc.). But McNider and Christy chose not to do that.
Instead, they chose to hide the structural uncertainty in the MSU retrievals (the TMT trends for 1979-2013 in UAH v5.5 and RSS v3.3 were 0.04 and 0.08 +/- 0.05 K/dec respectively – a factor of two different!), and ignore the spread in the CMIP5 models TMT trends [0.08,0.36] and graph it in a way as to maximise the visual disparity in a frankly misleading way. Additionally, they decided to highlight the slower warming TMT records instead of the TLT record they had discussed in 1994. For contrast, the UAH v5.5 TLT trends for 1979-2013 were 0.14± 0.05 K/dec.
But all these choices were made in the service of rhetoric, not science, to suggest that models are, and had always been, wrong, and that the UAH MSU data had always been right. A claim moreover that is totally backwards.
Richard Feynman often spoke about a certain kind of self-critical integrity as being necessary to do credible science. That kind of integrity was in very short supply in this op-ed.
References
- J.R. Christy, and R.T. McNider, "Satellite greenhouse signal", Nature, vol. 367, pp. 325-325, 1994. http://dx.doi.org/10.1038/367325a0
- F.J. Wentz, and M. Schabel, "Effects of orbital decay on satellite-derived lower-tropospheric temperature trends", Nature, vol. 394, pp. 661-664, 1998. http://dx.doi.org/10.1038/29267
- J. Hansen, H. Wilson, M. Sato, R. Ruedy, K. Shah, and E. Hansen, "Satellite and surface temperature data at odds?", Climatic Change, vol. 30, pp. 103-117, 1995. http://dx.doi.org/10.1007/BF01093228