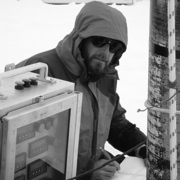
Jim Bouldin is a currently unaffiliated research ecologist, holding a BS in Wildlife Management from Ohio State University and a PhD in Plant Science from UCD. His primary research background/interest relates to forest change in response to human activity over the last ~ 200 years, and associated vegetation analysis methods issues, focusing on North America. Relative to climate topics, He is interested in mathematical/statistical methods in the analysis of tree rings as climatic proxies, and the role of forest vegetation in the carbon cycle and larger climate system.
More detail about his interests and work are here.
 Eric Steig is an isotope geochemist at the University of Washington in Seattle. His primary research interest is use of ice core records to document climate variability in the past. He also works on the geological history of ice sheets, on ice sheet dynamics, on statistical climate analysis, and on atmospheric chemistry.
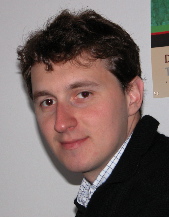
 David Archer is a computational ocean chemist at the University of Chicago. He has published research on the carbon cycle of the ocean and the sea floor, at present, in the past, and in the future. Dr. Archer has worked on the ongoing mystery of the low atmospheric CO2 concentration during glacial time 20,000 years ago, and on the fate of fossil fuel CO2 on geologic time scales in the future, and its impact on future ice age cycles, ocean methane hydrate decomposition, and coral reefs. Archer has written a textbook for non-science major undergraduates called “