This month’s climate science open thread.
Blog – realclimate.org – All Posts
Nenana Ice Classic 2020
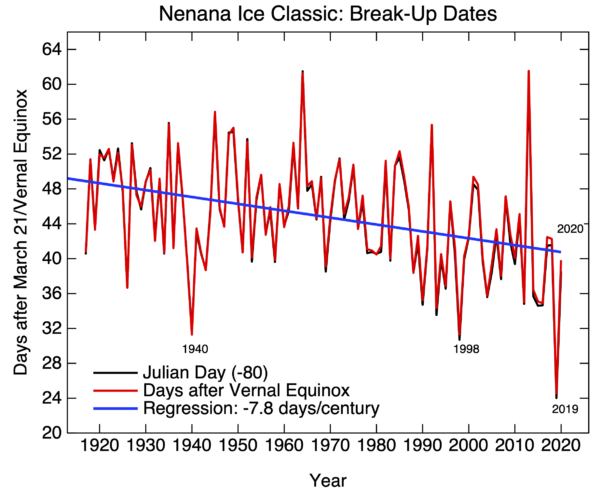
Readers may recall my interest in phenological indicators of climate change, and ones on which $300K rest are a particular favorite. The Nenana Ice Classic is an annual tradition since 1917, and provides a interesting glimpse into climate change in Alaska.
This year’s break-up of ice has just happened (unofficially, Apr 27, 12:56pm AKST), and, like in years past, it’s time to assess what the trends are. Last year was a record early break-up (on April 14th), and while this year was not as warm, it is still earlier than the linear trend (of ~8 days per century) would have predicted, and was still in the top 20 earliest break-ups.
A little side bet I have going is whether any of the contrarians mention this. They were all very excited in 2013 when the record for the latest break-up was set, but unsurprisingly not at all interested in any subsequent years (with one exception in 2018). This year, they could try something like ‘it’s cooling because the break up was two weeks later than last year (a record hot year)’, but that would be lame, even by their standards.
Regional climate modeling and some common omissions
There is a growing need for local climate information in order to update our understanding of risks connected to the changing weather and prepare for new challenges. This need has been an important motivation behind the World Meteorological Organisation’s (WMO) Global Framework for Climate Services (GFCS).
There has also been a lot of work carried out to meet these needs over time, but I’m not convinced that people always get the whole story.
[Read more…] about Regional climate modeling and some common omissions
A problem with YouTube
The American Geophysical Union (AGU) started to stream sessions at their annual meeting in San Francisco a few years ago. This kind of participation over the Internet is a nice alternative since many scholars are unable to attend the AGU meetings due to distance, time constraints, time difference and cost.
Forced variations: Apr 2020
Unforced Variations: Apr 2020
Unbelievably, this is no April’s fool joke
Last week, a colleague shared a tweet with a link to a very unusual paper. I first thought it must be a joke, but then realised that since it was the last days in March when I read it, it could not be an April’s fool joke. It seems to be a serious paper.
So I thought it would be perfect to share the reference McCarthy et al. (2020) today. The paper has a few useful take-home messages, such as the C.R.A.P. framework.
Update: here is a presentation slide deck to accompany the paper.
References
- I.P. McCarthy, D. Hannah, L.F. Pitt, and J.M. McCarthy, "Confronting indifference toward truth: Dealing with workplace bullshit", Business Horizons, vol. 63, pp. 253-263, 2020. http://dx.doi.org/10.1016/j.bushor.2020.01.001
Further perspectives on pandemics and climate change
I have recently been asked whether the present corona pandemic will have any consequence on climate change. Gavin has already discussed the coronavirus and climate here on RealClimate, and I like to follow up on his post.
Rather than emphasising analogies, I would highlight additional common denominators between the present world-wide Covid-19 pandemic and climate change.
[Read more…] about Further perspectives on pandemics and climate change
Coronavirus and climate
As we collectively reel from the changes wrought by the current pandemic, people are being drawn by analogy to climate issues – but analogies can be tricky and often distort as much as they illuminate.
For instance, in the Boston Globe, Jeff Jacoby’s commentary was not particularly insightful and misquoted Mike Mann pretty egregiously. Mike’s response is good:
I am relieved to see policy makers treating the coronavirus threat with the urgency it deserves. They need to do the same when it comes to an even greater underlying threat: human-caused climate change.
In a recent column (“I’m skeptical about climate alarmism, but I take coronavirus fears seriously,” Ideas, March 15), Jeff Jacoby sought to reconcile his longstanding rejection of the wisdom of scientific expertise when it comes to climate with his embrace of such expertise when it comes to the coronavirus.
In so doing, Jacoby took my words out of context, mischaracterizing my criticisms of those who overstate the climate threat “in a way that presents the problem as unsolvable, and feeds a sense of doom, inevitability, and hopelessness.”
As I have pointed out in past commentaries, the truth is bad enough when it comes to the devastating impacts of climate change, which include unprecedented floods, heat waves, drought, and wildfires that are now unfolding around the world, including the United States and Australia, where I am on sabbatical.
The evidence is clear that climate change is a serious challenge we must tackle now. There’s no need to exaggerate it, particularly when it feeds a paralyzing narrative of doom and hopelessness.
There is still time to avoid the worst outcomes, if we act boldly now, not out of fear, but out of confidence that the future is still largely in our hands. That sentiment hardly supports Jacoby’s narrative of climate change as an overblown problem or one that lacks urgency.
While we have only days to flatten the curve of the coronavirus, we’ve had years to flatten the curve of CO2 emissions. Unfortunately, thanks in part to people like Jacoby, we’re still currently on the climate pandemic path.
Michael E. Mann
State College, Pa.
The writer is a professor at Penn State University, where he is director of the Earth System Science Center.
Direct connections
There are some direct connections too. The lockdowns and travel restrictions are having a material effect on emissions of short-lived air pollutants (like NOx, SO2 etc.), water discharges and carbon dioxide as well. The impacts on air and water quality are already being seen – perhaps allowing people to reset their shifted baselines for what clean air and water are like.
Business-as-usual is kaput
Obviously, nothing is going to be quite the same after this. We will soon be describing prior norms and behaviours as “that is so BC” (before coronavirus). Already, when watching pre-recorded TV shows, I internally cringe when seeing the handshaking and hugging.
But it should also be obvious that for worst-case scenarios to materialise, it is a combination of factors that drive the results. Luck, good or bad, and decisions, wise or unwise, combine to create the future. Luck drives the specific potency of the virus, it’s incubation period and lethality, but societal decisions determined the preparation (or lack thereof), the health care system design or capacity (or lack thereof), and governmental responses (adequate or not).
Indeed, every possible future can only be reached by a specific track of what is (the science) and what we do about it (the policy). That is no different with climate as it is with pandemics. There is no possible future in which no-one made any decisions.
This probably doesn’t need to be said, but planning for low probability, high impact, worst case scenarios is looking pretty smart right now.
— Gavin Schmidt (@ClimateOfGavin) March 15, 2020
Why not use a clever mathematical trick?
There is a clever mathematical trick for comparing different data sets, but it does not seem to be widely used. It is based on so-called empirical orthogonal functions (EOFs), which Edward Lorenz described in a Massachusetts Institute of Technology (MIT) scientific report from 1956. The EOFs are similar to principal component analysis (PCA).

The EOFs and PCAs provide patterns of spatio-temporal covariance structure. Usually these techniques are applied to datasets with many parallel variables to show coherent patterns of variability. Myles Allen used to lecture on EOFs at Oxford University about twenty years ago and convinced me about their value. Many scientists do indeed use EOFs to analyse their data.

It is not that there is little use of EOFs (they are widely used), but the question is how the EOFs are used and how the results are interpreted. I learned that EOFs can be used in many different ways from Doug Nychka, when I visited University Corporation for Atmospheric Research (UCAR) in 2011.

The clever trick is to apply these techniques to data compiled from more than one source of data. When used this way, the technique is labelled “common EOFs” or “common PCA”. There are some scientific studies that have made use of common EOFs or common PCA, such as Flurry (1988), Barnett (1999), Sengupta & Boyle (1993), Benestad (2001), and Gilett et al (2002).

Nevertheless, a Scholar Google recent search with “common EOFs” only gave 101 hits (2020-03-05). I find this low interest for this technique a bit puzzling, since it in many ways has lots in common to machine learning and artificial intelligence (AI), both which are hot topics these days.

Common EOFs are also particularly useful for quantifying local effects of global warming through a process known as empirical-statistical downscaling (ESD). It's pity that common EOFs aren't even mentioned in the recent textbook on ESD by Maraun and Widmann (2019)  (they are discussed in Benestad et al. (2008)).
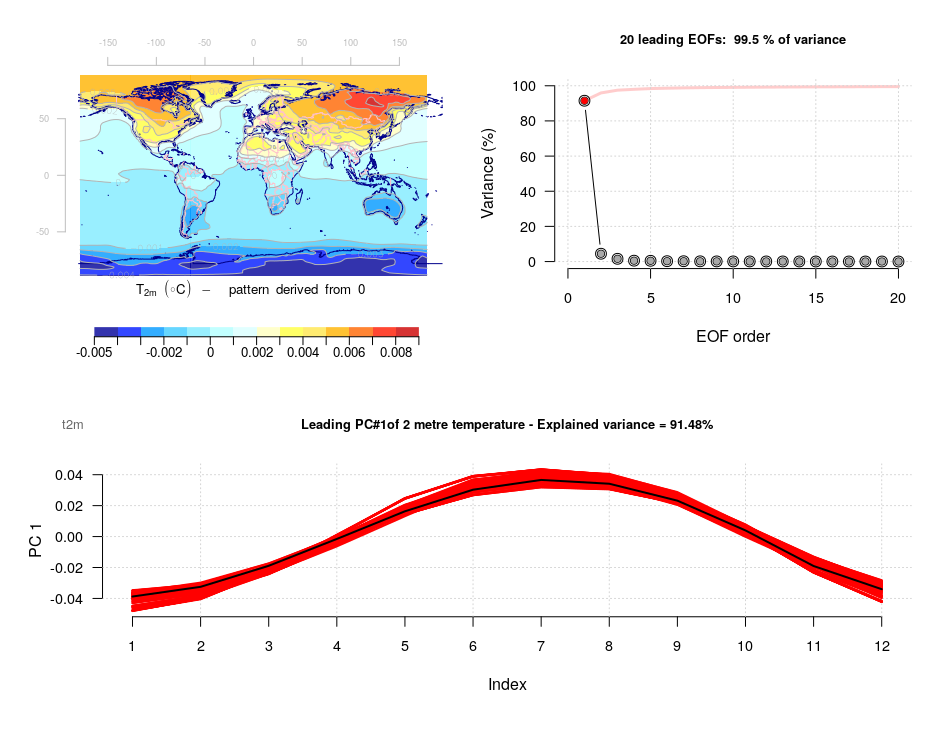
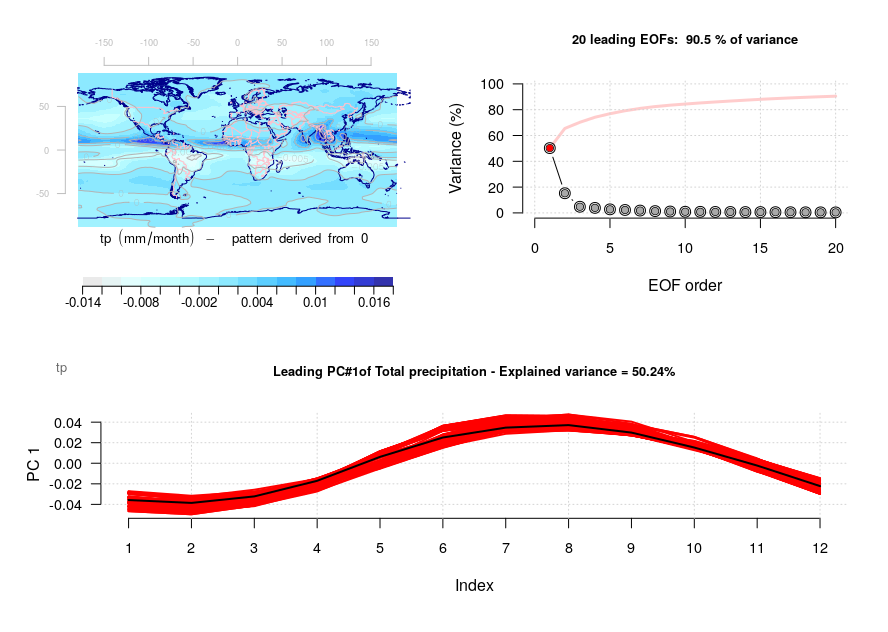
Figure. Examples showing how common EOFs can be used to compare the annual cycle in T(2m) in the upper set of panels and precipitation (lower panels) simulated by global climate models from the CMIP5 experiment (red) and compared with the ERAINT reanalysis (black).
The take-home message from these common EOFs, eigenvalues and principal components, is that the models do reproduce the large-scale patterns in the mean annual cycle. For those interested, common EOFs can easily be calculated with the R-based tool:
github.com/metno/esd.
References
- R.E. Benestad, "A comparison between two empirical downscaling strategies", International Journal of Climatology, vol. 21, pp. 1645-1668, 2001. http://dx.doi.org/10.1002/joc.703
- N.P. Gillett, F.W. Zwiers, A.J. Weaver, G.C. Hegerl, M.R. Allen, and P.A. Stott, "Detecting anthropogenic influence with a multi‐model ensemble", Geophysical Research Letters, vol. 29, 2002. http://dx.doi.org/10.1029/2002GL015836