• Skip to primary navigation
  • Skip to main content
  • Skip to primary sidebar
  • Skip to footer

RealClimate

Climate science from climate scientists...

  • Home
  • Start here
  • Contributors
  • Archives
You are here: Home / 2009 / Archives for November 2009

Archives for November 2009

Something Is X in the State of Denmark

29 Nov 2009 by rasmus

We received a letter with the title ‘Climate Change: The Role of Flawed Science‘ which may be of interest to the wider readership. The author, Peter Laut, is Professor (emeritus) of physics at The Technical University of Denmark and former scientific advisor on climate change for The Danish Energy Agency. He has long been a critic of the hypothesis that solar activity dominates the global warming trend, and has been involved in a series of heated public debates in Denmark. Even though most of his arguments concern scientific issues, such as data handling, and arithmetic errors, he also has much to say about the way that the debate about climate change has been conducted. It’s worth noting that he sent us this letter before the “CRU email” controversy broke out, so his criticism of the IPCC for being too even handed, is ironic and timely.

Update – the link in the letter is now fixed. -rasmus

Filed Under: Climate Science, Communicating Climate, Sun-earth connections

Where’s the data?

27 Nov 2009 by group

Much of the discussion in recent days has been motivated by the idea that climate science is somehow unfairly restricting access to raw data upon which scientific conclusions are based. This is a powerful meme and one that has clear resonance far beyond the people who are actually interested in analysing data themselves. However, many of the people raising this issue are not aware of what and how much data is actually available.

Therefore, we have set up a page of data links to sources of temperature and other climate data, codes to process it, model outputs, model codes, reconstructions, paleo-records, the codes involved in reconstructions etc. We have made a start on this on a new Data Sources page, but if anyone has other links that we’ve missed, note them in the comments and we’ll update accordingly.

The climate science community fully understands how important it is that data sources are made as open and transparent as possible, for research purposes as well as for other interested parties, and is actively working to increase accessibility and usability of the data. We encourage people to investigate the various graphical portals to get a feel for the data and what can be done with it. The providers of these online resources are very interested in getting feedback on any of these sites and so don’t hesitate to contact them if you want to see improvements.

Update: Big thank you to all for all the additional links given below. Keep them coming!

Filed Under: Climate Science, Instrumental Record

An offering

26 Nov 2009 by david

I video-taped and posted all the lectures from my Global Warming class this quarter. The class is part of our core science curriculum for non-science majors at the University of Chicago, and interest has been strong enough that the class has kind of taken over my teaching life. The lectures are based on my textbook, Understanding the Forecast, written for the class a few years ago. The students found it useful, I think, to be able to skip lectures and watch them later, but mostly I taped them for y’all, thinking someone might them useful. cheers, David.

Filed Under: Climate Science

Copenhagen

24 Nov 2009 by eric

Nov. 24th, 2009 Copenhagen Diagnosis

The ‘Copenhagen Diagnosis‘, a report by 26 scientists from around the world was released today. The report is intended as an update to the IPCC 2007 Working Group 1 report. Like the IPCC report, everything in the Copenhagen Diagnosis is from the peer-reviewed literature, so there is nothing really new. But the report summarizes and highlights those studies, published since the (2006) close-off date for the IPCC report, that the authors deemed most relevant to the negotiations in Copenhagen (COP15) next month. This report was written for policy-makers, stakeholders, the media and the broader public, and has been sent to each and every one of the COP15 negotiating teams throughout the world.

Among the points summarized in the report are that:

The ice sheets are both losing mass (and hence contributing to sea level rise). This was not certain at the time of the IPCC report.

Arctic sea ice has declined faster than projected by IPCC.

Greenhouse gas concentrations have continued to track the upper bounds of IPCC projections.

Observed global temperature changes remain entirely in accord with IPCC projections, i.e. an anthropogenic warming trend of about 0.2 ºC per decade with superimposed short-term natural variability.

Sea level has risen more than 5 centimeters over the past 15 years, about 80% higher than IPCC projections from 2001.

Perhaps most importantly, the report articulates a much clearer picture of what has to happen if the world wants to keep future warming within the reasonable threshold (2°C) that the European Union and the G8 nations have already agreed to in principle.

The full report is available at www.copenhagendiagnosis.org. Three of us at RealClimate are co-authors so we can’t offer an independent review of the report here. We welcome discussion in the comments section though. But read the report first before commenting, please.

Filed Under: Climate Science, Communicating Climate, IPCC, Reporting on climate

The CRU hack: Context

23 Nov 2009 by Gavin

This is a continuation of the last thread which is getting a little unwieldy. The emails cover a 13 year period in which many things happened, and very few people are up to speed on some of the long-buried issues. So to save some time, I’ve pulled a few bits out of the comment thread that shed some light on some of the context which is missing in some of the discussion of various emails.

  • Trenberth: You need to read his recent paper on quantifying the current changes in the Earth’s energy budget to realise why he is concerned about our inability currently to track small year-to-year variations in the radiative fluxes.
  • Wigley: The concern with sea surface temperatures in the 1940s stems from the paper by Thompson et al (2007) which identified a spurious discontinuity in ocean temperatures. The impact of this has not yet been fully corrected for in the HadSST data set, but people still want to assess what impact it might have on any work that used the original data.
  • Climate Research and peer-review: You should read about the issues from the editors (Claire Goodess, Hans von Storch) who resigned because of a breakdown of the peer review process at that journal, that came to light with the particularly egregious (and well-publicised) paper by Soon and Baliunas (2003). The publisher’s assessment is here.

Update: Pulling out some of the common points being raised in the comments.

  • HARRY_read_me.txt. This is a 4 year-long work log of Ian (Harry) Harris who was working to upgrade the documentation, metadata and databases associated with the legacy CRU TS 2.1 product, which is not the same as the HadCRUT data (see Mitchell and Jones, 2003 for details). The CSU TS 3.0 is available now (via ClimateExplorer for instance), and so presumably the database problems got fixed. Anyone who has ever worked on constructing a database from dozens of individual, sometimes contradictory and inconsistently formatted datasets will share his evident frustration with how tedious that can be.
  • “Redefine the peer-reviewed literature!” . Nobody actually gets to do that, and both papers discussed in that comment – McKitrick and Michaels (2004) and Kalnay and Cai (2003) were both cited and discussed in Chapter 2 of 3 the IPCC AR4 report. As an aside, neither has stood the test of time.
  • “Declines” in the MXD record. This decline was hidden written up in Nature in 1998 where the authors suggested not using the post 1960 data. Their actual programs (in IDL script), unsurprisingly warn against using post 1960 data. Added: Note that the ‘hide the decline’ comment was made in 1999 – 10 years ago, and has no connection whatsoever to more recent instrumental records.
  • CRU data accessibility. From the date of the first FOI request to CRU (in 2007), it has been made abundantly clear that the main impediment to releasing the whole CRU archive is the small % of it that was given to CRU on the understanding it wouldn’t be passed on to third parties. Those restrictions are in place because of the originating organisations (the various National Met. Services) around the world and are not CRU’s to break. As of Nov 13, the response to the umpteenth FOI request for the same data met with exactly the same response. This is an unfortunate situation, and pressure should be brought to bear on the National Met Services to release CRU from that obligation. It is not however the fault of CRU. The vast majority of the data in the HadCRU records is publicly available from GHCN (v2.mean.Z).
  • Suggestions that FOI-related material be deleted … are ill-advised even if not carried out. What is and is not responsive and deliverable to an FOI request is however a subject that it is very appropriate to discuss.
  • Fudge factors (update) IDL code in the some of the attached files calculates and applies an artificial ‘fudge factor’ to the MXD proxies to artificially eliminate the ‘divergence pattern’. This was done for a set of experiments reported in this submitted 2004 draft by Osborn and colleagues but which was never published. Section 4.3 explains the rationale very clearly which was to test the sensitivity of the calibration of the MXD proxies should the divergence end up being anthropogenic. It has nothing to do with any temperature record, has not been used in any published reconstruction and is not the source of any hockey stick blade anywhere.

Further update: This comment from Halldór Björnsson of the Icelandic Met. Service goes right to the heart of the accessibility issue:

Re: CRU data accessibility.

National Meteorological Services (NMSs) have different rules on data exchange. The World Meteorological Organization (WMO) organizes the exchange of “basic data”, i.e. data that are needed for weather forecasts. For details on these see WMO resolution number 40 (see http://bit.ly/8jOjX1).

This document acknowledges that WMO member states can place restrictions on the dissemination of data to third parties “for reasons such as national laws or costs of production”. These restrictions are only supposed to apply to commercial use, the research and education community is supposed to have free access to all the data.

Now, for researchers this sounds open and fine. In practice it hasn’t proved to be so.

Most NMSs also can distribute all sorts of data that are classified as “additional data and products”. Restrictions can be placed on these. These special data and products (which can range from regular weather data from a specific station to maps of rain intensity based on satellite and radar data). Many nations do place restrictions on such data (see link for additional data on above WMO-40 webpage for details).

The reasons for restricting access is often commercial, NMSs are often required by law to have substantial income from commercial sources, in other cases it can be for national security reasons, but in many cases (in my experience) the reasons simply seem to be “because we can”.

What has this got to do with CRU? The data that CRU needs for their data base comes from entities that restrict access to much of their data. And even better, since the UK has submitted an exception for additional data, some nations that otherwise would provide data without question will not provide data to the UK. I know this from experience, since my nation (Iceland) did send in such conditions and for years I had problem getting certain data from the US.

The ideal, that all data should be free and open is unfortunately not adhered to by a large portion of the meteorological community. Probably only a small portion of the CRU data is “locked” but the end effect is that all their data becomes closed. It is not their fault, and I am sure that they dislike them as much as any other researcher who has tried to get access to all data from stations in region X in country Y.

These restrictions end up by wasting resources and hurting everyone. The research community (CRU included) and the public are the victims. If you don’t like it, write to you NMSs and urge them to open all their data.

I can update (further) this if there is demand. Please let me know in the comments, which, as always, should be substantive, non-insulting and on topic.

Comments continue here.

Filed Under: Climate Science

The CRU hack

20 Nov 2009 by group

As many of you will be aware, a large number of emails from the Climatic Research Unit (CRU) at the University of East Anglia webmail server were hacked recently (Despite some confusion generated by Anthony Watts, this has absolutely nothing to do with the Hadley Centre which is a completely separate institution). As people are also no doubt aware the breaking into of computers and releasing private information is illegal, and regardless of how they were obtained, posting private correspondence without permission is unethical. We therefore aren’t going to post any of the emails here. We were made aware of the existence of this archive last Tuesday morning when the hackers attempted to upload it to RealClimate, and we notified CRU of their possible security breach later that day.

Nonetheless, these emails (a presumably careful selection of (possibly edited?) correspondence dating back to 1996 and as recently as Nov 12) are being widely circulated, and therefore require some comment. Some of them involve people here (and the archive includes the first RealClimate email we ever sent out to colleagues) and include discussions we’ve had with the CRU folk on topics related to the surface temperature record and some paleo-related issues, mainly to ensure that posting were accurate.
[Read more…] about The CRU hack

Filed Under: Climate Science

A problem of multiplicity

20 Nov 2009 by rasmus

One thing a scientist doesn’t want to mess up is the problem of multiplicity (also known as ‘field significance‘). It’s just like rolling a die 600 times, and then getting excited about getting roughly 100 sixes. However, sometimes it’s much more subtle than just rolling dice.

This problem seems to be an issue in a recent by paper with the title ‘Evidence for solar forcing in variability of temperatures and pressures in Europe‘ by Le Mouel et al. (2009) in the Journal of Atmospheric and Solar-Terrestrial Physics.

[Read more…] about A problem of multiplicity

Filed Under: Climate Science

A Treeline Story

17 Nov 2009 by Ray Bradley

Some of the highest growing trees in the world are also the oldest—bristlecone pines (Pinus longaeva) from the Great Basin in the western United States (eastern California, Nevada and Utah). The oldest example is more than 4800 years old. Because of their longevity and growth at high elevations (where the growth of trees is generally known to be limited by temperature) bristlecone pines have been of particular interest to dendroclimatologists (paleoclimatologists who study tree rings to reconstruct past climate). Numerous ecological studies carried out at treeline sites all over the world show that temperature imposes a critical limitation on the ability of trees to produce new tissue; mean daily temperatures of 8-9°C are required, so recent warming will have particular benefits for those trees that have managed to eke out an existence for so long, living “on the edge”.

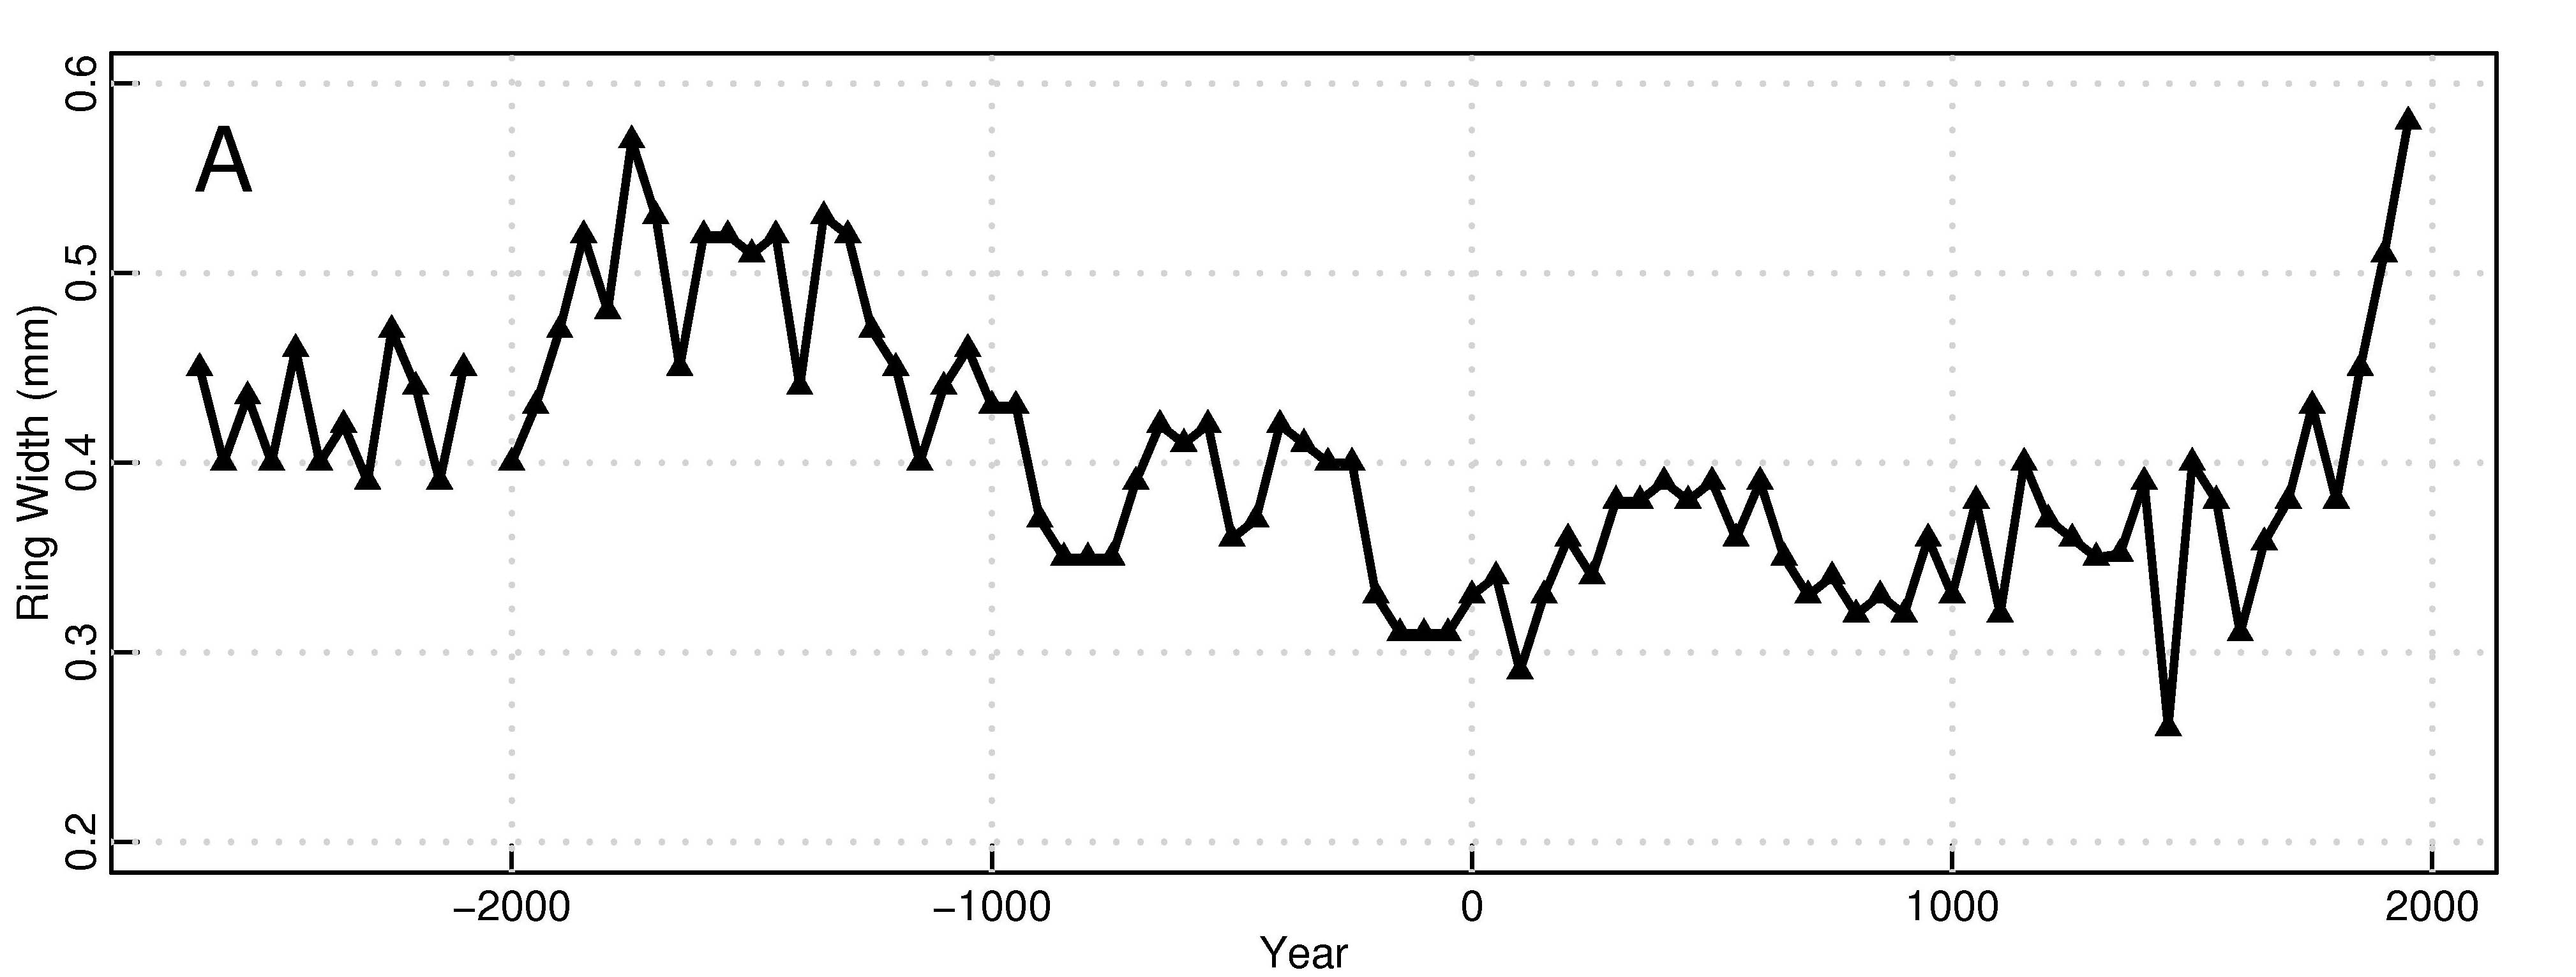
An interesting characteristic of the western bristlecone pines is that their recent growth has markedly increased—ring widths have been higher than in previous decades. Previous studies have debated to what extent this “fact” is real, or just an artifact of the way tree-ring data are analyzed. Because the growth of trees is radial, as trees get older and the diameter of a tree increases, annual ring widths decline in thickness. This is the normal “growth function” that is commonly removed from measurements before further analysis is carried out. The trick is to do this carefully so that as much climate information is retained while the growth function is discarded, and dendroclimatologists know how to do this quite well. However, sometimes the “standardization” procedure can introduce spurious results. This led some to regard the apparent growth increase in bristlecone pines to be a meaningless result of the data processing. In a new article in the Proceedings of the U.S. National Academy of Sciences (PNAS) Matthew Salzer (Laboratory of Tree Ring Research, University of Arizona) and colleagues examine this issue head on. They studied hundreds of trees from treeline sites in the Great Basin, aligned all the samples according to date, and simply averaged the results (Figure 1). Given that these trees are all long-lived, the complicating factor of growth function (which is strongest for the early growth of a tree) was not significant for assessing the most recent growth. Their results show that mean ring width in the last 50 years has been greater than in any previous 50 year period over the last 3700 years. You have to go all the way back to ~1900-1300 B.C. to find mean ring widths approaching recent values. Furthermore, the recent increase in ring widths is seen in trees at the upper forest border at sites hundreds of km away (even when the treelines there were at lower elevations)—but not in trees below the upper forest border. Below the zone closest to treeline, wide rings are formed in cool, wet years, and narrow rings in warm, dry years, and trees from this lower zone do not show the 20th century growth surge.

It is thus clear that the bristlecone pines from the highest regions, close to their growth limit, are showing a very strong response to recent warming, and indicating just how unusual it has been in the context of the last few millennia. Previous explanations have focused on possible CO2 fertilization effects (increasing water use efficiency) but there is no obvious reason why such factors would have affected only trees within approximately 150m of local treeline in different locations. Rather, the high elevation trees, close to the limit of growth, have responded positively to the recent increase in temperature just as ecological studies would have predicted.

One final note: bristlecone pines often have an unusual growth form known as “strip bark morphology” in which annual growth layers are restricted to only parts of a tree’s circumference. Some studies have suggested that such trees be avoided for paleoclimatic purposes, a point repeated in a recent National Academy of Sciences report (Surface temperature reconstructions for the last 2,000 years. NRC, 2006). However Salzer et al’s study shows that there is no significant difference in their results when the data are divided into two classes—strip bark and non-strip-bark cases –when the raw unstandardized data are compared. So that particular issue has apparently had people barking up the wrong tree…

Figure 1: Median ring-widths (non-overlapping 50-year means) of upper forest border Pinus longaeva from 3 sites in western North America, plotted on first year of interval (from Salzer et al, PNAS, 2009)

Filed Under: Climate Science

It’s all about me (thane)!

12 Nov 2009 by Gavin

Well, it’s not really all about me. But methane has figured strongly in a couple of stories recently and gets an apparently-larger-than-before shout-out in Al Gore’s new book as well. Since a part of the recent discussion is based on a paper I co-authored in Science, it is probably incumbent on me to provide a little context.

First off, these latest results are being strongly misrepresented in certain quarters. It should be obvious, but still bears emphasizing, that redistributing the historic forcings between various short-lived species and CH4 is mainly an accounting exercise and doesn’t impact the absolute effect attributed to CO2 (except for a tiny impact of fossil-derived CH4 on the fossil-derived CO2). The headlines that stated that our work shows a bigger role for CH4 should have made it clear that this is at the expense of other short-lived species, not CO2. Indeed, the attribution of historical forcings to CO2 that we made back in 2006 is basically the same as it is now.
[Read more…] about It’s all about me (thane)!

Filed Under: Climate modelling, Climate Science, Greenhouse gases

Muddying the peer-reviewed literature

11 Nov 2009 by Gavin

We’ve often discussed the how’s and why’s of correcting incorrect information that is occasionally found in the peer-reviewed literature. There are multiple recent instances of heavily-promoted papers that contained fundamental flaws that were addressed both on blogs and in submitted comments or follow-up papers (e.g. McLean et al, Douglass et al., Schwartz). Each of those wasted a huge amount of everyone’s time, though there is usually some (small) payoff in terms of a clearer statement of the problems and lessons for subsequent work. However, in each of those cases, the papers were already “in press” by the time other people were aware of the problems.

What is the situation though when problems (of whatever seriousness) are pointed out at an earlier stage? For instance, when a paper has been accepted in principle but a final version has not been sent in and well before the proofs have been sent out? At that point it would seem to be incumbent on the authors to ensure that any errors are fixed before they have a chance to confuse or mislead a wider readership. Often in earlier times corrections and adjustments would have been made using the ‘Note added in proof’, but this is less used these days since it is so easy to fix electronic versions.
[Read more…] about Muddying the peer-reviewed literature

Filed Under: Climate Science, Instrumental Record

  • Go to page 1
  • Go to page 2
  • Go to Next Page »

Primary Sidebar

Email Notification

get new posts sent to you automatically (free)
Loading

Recent Posts

  • Some new CMIP6 MSU comparisons
  • How not to science
  • Unforced variations: March 2023
  • The established ground and new ideas
  • 2022 updates to model-observation comparisons
  • Unforced variations: Feb 2023

Our Books

Book covers
This list of books since 2005 (in reverse chronological order) that we have been involved in, accompanied by the publisher’s official description, and some comments of independent reviewers of the work.
All Books >>

Recent Comments

  • Ron R. on Unforced variations: March 2023
  • Ron R. on Unforced variations: March 2023
  • Carbomontanus on Unforced variations: March 2023
  • Carbomontanus on Unforced variations: March 2023
  • jgnfld on Unforced variations: March 2023
  • Tomáš Kalisz on Unforced variations: March 2023
  • Ron R. on Unforced variations: March 2023
  • JCM on Unforced variations: March 2023
  • macias shurly on Unforced variations: March 2023
  • Dan on Unforced variations: March 2023
  • Killian on Unforced variations: March 2023
  • Ray Ladbury on Unforced variations: March 2023

Footer

ABOUT

  • About
  • Translations
  • Privacy Policy
  • Contact Page
  • Login

DATA

  • Data Sources
  • Climate model projections compared to observations

INDEX

  • Acronym index
  • Index

Realclimate Stats

1,296 posts

8 pages

230,187 comments

Copyright © 2023 · RealClimate is a commentary site on climate science by working climate scientists for the interested public and journalists.