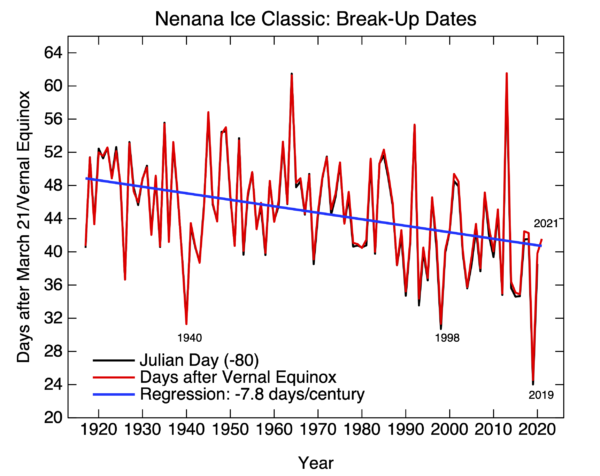
As in previous years, the spring break-up of river ice on the Tanana River at Nenana and the Yukon River at Dawson City in Canada (new! h/t Ed Wiebe), is a great opportunity to highlight phenology that indicates that the planet is in fact reacting to the ongoing global warming. As we’ve done in previous years, the Nenana dates can be plotted and show a clear trend towards earlier break-ups (by about 8 days/century over the whole record, or 13 days/century since 1975).
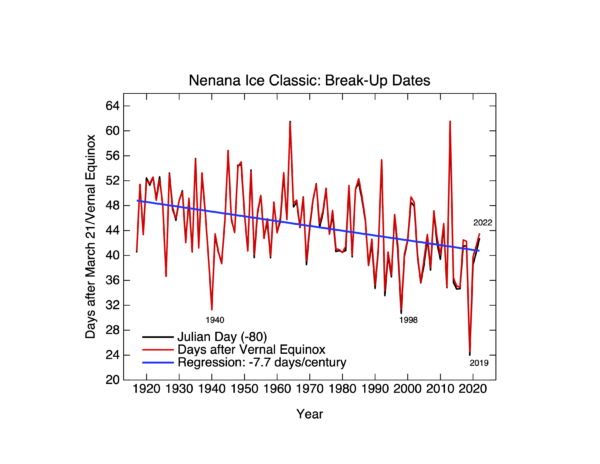
2022 was on trend, and in 2014, I noted that May 3rd was the most likely date given the trends until then.
Dawson City in the Yukon is about 250 miles east of Nenana which is close enough for the seasonal anomalies in climate to be quite highly correlated. So one might expect that the break-up dates would be similarly correlated… and indeed they are:
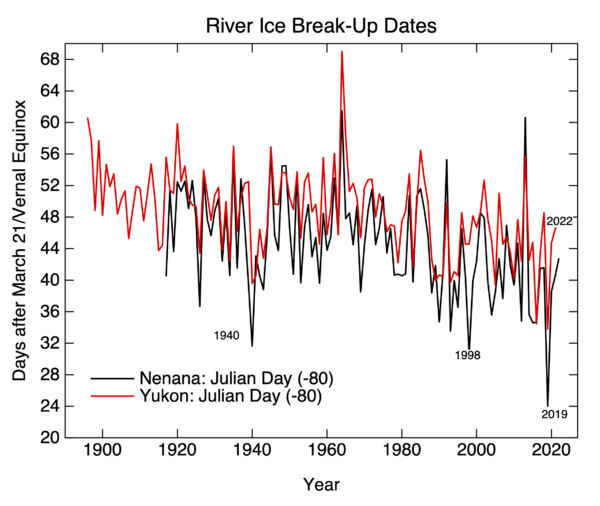
The ice at Dawson breaks up on average 3.8 days later than the ice at Nenana (5.1 days this year), but the correlation between the two series is an impressive 0.82. There have been 15 times the ice went out within 24 hours of each other and in 1963 they broke up less than 3 minutes apart! The trends are likewise very similar 7.7±3.8 days/century for Nenana, compared to 6.5±3.1 days/century since 1917. This pretty much puts paid to the occasional claim of the urban heat island in Fairbanks affecting the water and causing the trend.
[Update: I misunderstood the Yukon river break up website, and erroneously stated that the break-up was on May 2nd. It was not. I’ll update this again when it has. Apologies.]
[Update II: The Yukon river ice broke up on May 7, and I’ve updated the graph and text.]