• Skip to primary navigation
  • Skip to main content
  • Skip to primary sidebar
  • Skip to footer

RealClimate

Climate science from climate scientists...

  • Start here
  • Model-Observation Comparisons
  • Miscellaneous Climate Graphics
  • Surface temperature graphics
You are here: Home / Archives for Climate Science / IPCC

IPCC

Raising Climate Literacy

3 Nov 2025 by group 13 Comments

Guest commentary by Figen Mekik

Climate change has become “that” topic – like evolution of species, plate tectonics, or AI where the public has heard so much about it that many think they know everything they need to know.  Such confidence can be both a good and bad thing. 

The upside is that the biggest global societal problem of our time, climate change, has become a part of the broader culture. The vast majority of the world agrees that something must be done to mitigate global warming – 69% of the world population is willing to contribute 1% of their income to climate mitigation, and 89% demand climate action from their governments and politicians. 62% of Americans feel a personal duty to reduce the effects of climate change.  However, the downside is that most lack a sufficient foundation in the science of climate change which creates misconceptions, a lack of ability to discern pseudoscience, and an ill-founded surety about the realities of global warming.   Misconceptions get in the way of understanding the science behind the predictions of climate change to the point where mitigation efforts are derailed or stalled. The consequence is that anthropogenic climate change, a phrase used to describe the change in climate attributable to human activity, becomes a political “belief” rather than accepted as scientific discourse.

The U.S. is among the most politically divided countries about anthropogenic climate change. Despite 61% of Americans regarding the scientific evidence supporting a warming Earth as solid, the current administration has successfully and systematically defunded most of its institutions providing the most scientifically sound information and educational materials about climate change. The damage to NASA, NOAA, NIH, and EPA is profound and is threatening the exalted status of the U.S. as a global leader in scientific research. Such misguidedness stems in part from “The vast majority of the world” (the tendency of individuals to underestimate the willingness of others to want to mitigate climate change), and in greater part from “climate modeling ignorance.”  

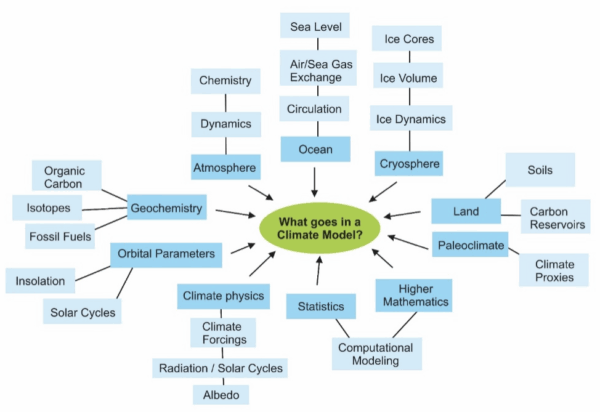
One of the most pernicious misconceptions about climate change is the idea that climate models make projections for the next 100 years by simply extrapolating the globally averaged changes in weather patterns over the last 40 – 50 years into the future. This is an important misconception to correct because it goes to the core of the credibility of climate models in the mind of lay people who make political decisions about mitigating hazards of anthropogenic climate change.  This misconception is an outgrowth from another one – that weather and climate are the same thing.  Many lay people do not realize that both regional and  global climate is determined by many factors beyond atmospheric chemistry and dynamics, including (but not limited to) ocean circulation, the thermal properties of both seawater and ice, the extent and volume of ice cover as well as Earth’s orbital parameters – are all part and parcel of climate models:

Schematic illustrating fields and topics contributing to creation, modification, and usage of climate models. Contributing topics and fields are not exhaustive!

For example, “will it snow tomorrow?” is a ‘weather’ question, while “how do El Niño events in the tropical Pacific Ocean affect winters in West Michigan?” is a climate question. This distinction matters for making decisions about mitigating climate change because it fosters the understanding that teleconnections affect both global and regional climate, and that a persistent change related to global warming in the natural cyclicity of a distant interaction between ocean and atmosphere (El Niño in the tropical Pacific) can change what to expect in West Michigan in the next 50 or 100 years. 

Another pervasive misconception is the confusion of Environmental Science with Climate Science.  Two big questions arise: “what can a climatologist do that an environmental scientist cannot?” and “why does developing Climate Science programs in colleges distinct from environmental science matter for the lay person, the broader public?” 

Nationally, while both Environmental Science and Climate Science programs are broadly
multidisciplinary and interrelated, they have important differences. Climate Science is a physical science focusing on the causes, direct effects, and changes in climate through all of Earth’s history including the Anthropocene (the “Human Era”) through computational models involving the chemistry and physics of climate change; while Environmental Science is a natural science broadly involving ecology, microbiology, soil science, conservation, restoration, natural resource management, entomology, pollution, water quality, and similar. 

For example, pollution of a river system is a massive environmental problem. So is recycling waste. But neither are problems directly related to climate change. Similarly, availability of food or clean water is a sustainability question related more to human population growth, economics, politics, and environmental change than climate change; though of course the greater the human population, the greater the amount of greenhouse gasses emitted to the atmosphere which leads to climate warming.   So, climate change affects and informs environmental change and sustainability but is only one aspect of those fields. The change in duration of the annual growth season or warmer temperatures shifting to higher latitudes will affect availability of food and water – these are sustainability issues. 

Unfortunately, only a handful of colleges and universities across the United States have developed college majors specifically in Climate Science, most recently Grand Valley State University.  However, academic programs specifically dedicated to Climate System Science are a new national trend – so new in fact that it is difficult to find information about the number of students enrolled or graduates produced annually nationwide. 

What has this got to do with “climate modeling ignorance”? 

Creating academic programs specifically focused on Climate System Science with a bend toward climate modeling is crucial at these times of swift and dangerous climate change. Lay people (the voting public) need to better understand the scientific basis for the causes and predictions related to anthropogenic climate change so humanity can make better informed decisions about mitigation efforts.  

Not everyone can dedicate resources and time to majoring in Climate Science but growing a population of well-educated climate scientists will help create a more climate literate public. Individuals specialized in climate system science who understand the strengths and uncertainties associated with climate modeling can inform the broader public about anthropogenic climate change and more effective ways of countering and preventing its hazardous effects.

A Communications major minoring in Climate Science may pursue a career as a climate journalist or spokesperson. In essence, a student minoring or majoring in Climate Science becomes a person who fosters climate literacy in their communities. According to the Bureau of Labor Statistics, the average salary for climatologists is $94,570 annually, there were 10,500 people employed as climatologists in 2020, and the projected growth rate for climatologist jobs between 2020 and 2030 is 8%.  According to ZipRecruiter, the average earnings for a climate scientist or climate change specialist is $111,343. 

In summary, degrees in Climate Science and Environmental Science are distinct from one another by content and by job prospects they offer. The job prospects for climate scientists are numerous and varied because climatologists are urgently needed in a world where climate is changing fast and often times unpredictably.  

References

  1. M.S. McCaffrey, and S.M. Buhr, "Clarifying Climate Confusion: Addressing Systemic Holes, Cognitive Gaps, and Misconceptions Through Climate Literacy", Physical Geography, vol. 29, pp. 512-528, 2008. http://dx.doi.org/10.2747/0272-3646.29.6.512
  2. P. Andre, T. Boneva, F. Chopra, and A. Falk, "Globally representative evidence on the actual and perceived support for climate action", Nature Climate Change, vol. 14, pp. 253-259, 2024. http://dx.doi.org/10.1038/s41558-024-01925-3
  3. A. Ziegler, "Political orientation, environmental values, and climate change beliefs and attitudes: An empirical cross country analysis", Energy Economics, vol. 63, pp. 144-153, 2017. http://dx.doi.org/10.1016/j.eneco.2017.01.022
  4. F. Lehner, and T.F. Stocker, "From local perception to global perspective", Nature Climate Change, vol. 5, pp. 731-734, 2015. http://dx.doi.org/10.1038/nclimate2660
  5. M. Maslin, and P. Austin, "Climate models at their limit?", Nature, vol. 486, pp. 183-184, 2012. http://dx.doi.org/10.1038/486183a
  6. D. Lombardi, and G.M. Sinatra, "College Students’ Perceptions About the Plausibility of Human-Induced Climate Change", Research in Science Education, vol. 42, pp. 201-217, 2010. http://dx.doi.org/10.1007/s11165-010-9196-z
  7. W. Fleming, A.L. Hayes, K.M. Crosman, and A. Bostrom, "Indiscriminate, Irrelevant, and Sometimes Wrong: Causal Misconceptions about Climate Change", Risk Analysis, vol. 41, pp. 157-178, 2020. http://dx.doi.org/10.1111/risa.13587

Filed Under: Climate modelling, Climate Science, Communicating Climate, El Nino, Featured Story, IPCC Tagged With: Climate Literacy, Education

DOE CWG Report “Moot”?

10 Sep 2025 by Gavin 119 Comments

Somewhat breaking news. A court filing (from 9/4) from DOE has noted that the Climate Working Group has been disbanded (as of 9/3). This was done to make the EDF/UCS lawsuit moot, but it also means that DOE is withdrawing the report, no-one will respond appropriately to the comments submitted, and (possibly) it becomes irrelevant for the EPA reconsideration of the Endangerment Finding.

What a farce.

Update: Via Andy Revkin, the EDF/UCS’s blistering response to the DOE filing. Pass the popcorn.

Filed Under: Climate impacts, Climate modelling, Climate Science, Featured Story, Instrumental Record, IPCC, Model-Obs Comparisons, Scientific practice

Climate Scientists response to DOE report

2 Sep 2025 by Gavin

As we’ve mentioned, Andrew Dessler and Robert Kopp have been coordinating a scientific peer review of the DOW ‘CWG’ Critique of Climate Science. It is now out.

[Read more…] about Climate Scientists response to DOE report

Filed Under: Arctic and Antarctic, Carbon cycle, Climate impacts, Climate modelling, Climate Science, Featured Story, Greenhouse gases, Hurricanes, Instrumental Record, IPCC, Model-Obs Comparisons, Scientific practice, Sea level rise, Sun-earth connections Tagged With: CWG, DOE, Endangerment Finding

Critique of Chapter 6 “Extreme Weather” in the DOE review

2 Sep 2025 by group

Guest commentary by Kerry Emanuel

Executive Summary

Chapter 6 of the draft DOE report examines whether global warming exacerbates extreme weather. It rightly notes that because events such as hurricanes are rare, detecting their response to climate change in short and imperfect historical records is extremely difficult—if not impossible. Yet the authors devote most of the remainder of the chapter to attempting just that. By omitting to frame such efforts in the context of theory and models, they commit three fundamental errors: 1) searching for trends where none were predicted, 2) neglecting important variables for which trends were predicted and 3) overlooking—or failing to acknowledge—that some predicted trends are of a magnitude that is not a priori detectable in existing noisy and short data sets. The draft report also overlooks recent literature on climate change effects on weather extremes, and quotes selectively and misleadingly from the most recent report of the Intergovernmental Panel on Climate Change (IPCC). For these reasons, I find much of Chapter 6 to be of questionable utility. There are at least three climate change-induced trends in hurricane-related hazards that were predicted theoretically, simulated by models, and confirmed by observations:

  1. Hurricanes are producing more rain, causing increased flooding. As water, not wind, is the source of most damage and mortality in hurricanes, this is the most consequential scientific finding.
  2. The proportion of hurricanes that reach high intensity is increasing.
  3. Hurricanes are intensifying more rapidly.

There is no robust scientific finding that hurricane frequency is increasing or expected to increase. Thus, much of Chapter 6 of the DOE report is devoted to refuting a hypothesis unsupported by scientific consensus. The short section on tornadoes does not include other more destructive aspects of severe convective storms, such as hail and damaging straight-line winds, and as with the section on hurricanes, omits inferences from theory and models.

[This commentary is also available as a pdf file]

[Read more…] about Critique of Chapter 6 “Extreme Weather” in the DOE review

Filed Under: Climate Science, Featured Story, Greenhouse gases, Hurricanes, In the News, Instrumental Record, IPCC Tagged With: CWG, DOE, Endangerment Finding

The Endangerment of the Endangerment Finding?

29 Jul 2025 by group

The EPA, along with the “Climate Working Group” (CWG) of usual suspects (plus Judith Curry and Ross McKitrick) at DOE, have just put out a document for public comment their attempt to rescind the 2009 Endangerment Finding for greenhouse gas emissions.

[Read more…] about The Endangerment of the Endangerment Finding?

Filed Under: Climate impacts, Climate modelling, Climate Science, Featured Story, Greenhouse gases, In the News, Instrumental Record, IPCC, Model-Obs Comparisons, Reporting on climate Tagged With: DOE, Endangerment Finding, EPA

The AMOC is slowing, it’s stable, it’s slowing, no, yes, …

26 Jan 2025 by Stefan

There’s been a bit of media whiplash on the issue of AMOC slowing lately – ranging from the AMOC being “on the brink of collapse” to it being “more stable than previously thought”. AMOC, of course, refers to the Atlantic Meridional Overturning Circulation, one of the worlds major ocean circulation systems which keeps the northern Atlantic region (including Europe) exceptionally warm for its latitude. So what is this whiplash about?

As is often the case with such media whiplash, there isn’t much scientific substance behind it, except for the usual small incremental steps in the search for improved understanding. It is rare that one single paper overthrows our thinking, though media reports unfortunately often give that impression. Real science is more like a huge jigsaw puzzle, where each new piece adds a little bit.

The latest new piece is a new reconstruction of how the AMOC has changed over the past 60 years, by Jens Terhaar and colleagues. The background to this discussion is familiar to our regular readers (else just enter ‘AMOC’ in the RealClimate search field): proper measurements of the AMOC flow are only available since 2004 in the RAPID project, thus for earlier times we need to use indirect clues. One of these is the sea surface temperature ‘finger print’ of AMOC changes as discussed in our paper Caesar et al. 2018 (Fig. 1). There we used the cold blob temperature anomaly (Nov-May) as an index for AMOC strength. Other studies have used other sea surface temperature or salinity patterns as well as paleoclimatic proxy data (e.g. sediment grain sizes), and generally found an AMOC decline since the 19th Century superimposed by some decadal variability. The new paper critices our (i.e. Caesar et al) reconstruction and suggests a new method using surface heat fluxes from reanalysis data as an indicator of AMOC strength.

Figure 1 The ‘cold blob’ and the warm stretch along the Gulf Stream path (red arrows). This ‘finger print’ of an AMOC slowdown is physically understood (Zhang 2008) and visible not just for the satellite era shown above, but also the reanalysis data (Fig. 3a below) and observed sea surface temperature trends since the year 1870 (Caesar et al. 2018). Map: Ruijian Gou.

Here’s three questions about it.

1. Does the ‘cold blob’ work well as AMOC indicator?

We had tested that in the historic runs of 15 different CMIP5 climate models in Caesar et al. 2018 (our Fig. 5) and found it works very well, except for two outlier models which were known to not produce a realistic AMOC. Now Terhaar et al. redid this test with the new CMIP6 model generation und found it works less well, i.e. the uncertainty is larger (although for future simulations where the AMOC shows a significant decline in the models, our AMOC index also works well in their analysis).

Which raises the question: which models are better for this purpose: CMIP5 or CMIP6? One might think that newer models are better – but this does not seem to be the case for CMIP6. Irrespective of the AMOC, the CMIP6 models created substantial controversy when their results came out: the climate sensitivity of a subset of ‘hot models’ was far too high, these models did not reproduce past temperature evolution well (compared to observed data), and IPCC made the unprecedented move of not presenting future projections as straightforward model average plus/minus model spread, but instead used the new concept of “assessed global warming” where models are weighted according to how well they reproduce observational data.

In the North Atlantic, the historic runs of CMIP6 models on average do not reproduce the ‘cold blob’ despite this being such a striking feature of the observational data, as shown clearly in the Summary for Policy Makers of the IPCC AR6 (see Fig. 2 below). Of the 24 CMIP6 models, a full 23 underestimate the sea surface cooling in the ‘cold blob’. And most of the CMIP6 models even show a strengthening of the AMOC in the historic period, which past studies have shown to be linked to strong aerosol forcing in many of these models (e.g. Menary et al. 2020, Robson et al. 2022). The historic Northern Hemisphere temperature evolution in the models with a strong aerosol effect “is not consistent with observations” and they “simulate the wrong sign of subpolar North Atlantic surface salinity trends”, as Robson et al. write. Thus I consider CMIP6 models as less suited to test how well the ‘cold blob’ works as AMOC indicator than the CMIP5 models.

Figure 2 Comparison of observed and simulated annual mean surface temperature change for 1°C global warming (IPCC, 2021, Figure SPM.5). The models on average do not reproduce the observed cold blob.

2. Is the new AMOC reconstruction method, based on the surface heat loss, better?

In the CMIP6 models it looks like that, and the link between AMOC heat transport and surface heat loss to the north makes physical sense. However, in the models the surface heat loss is perfectly known. In the real ocean that is not an observed quantity. It has to be taken from model simulations, the so-called reanalysis. While these simulations assimilate observational data, over most of the ocean surface these are basically sea surface temperatures, but surface heat loss depends also on air temperature, wind speed, humidity, radiation and cloud cover in complex ways, all of which are not accurately known. Therefore these surface heat loss data are much less accurate than sea surface temperature data and in my view not well suited to reconstruct the AMOC time evolution. 

That is supported by the fact that two different reanalysis data sets were used, leading to quite different AMOC reconstructions. Also the AMOC time evolution they found differs from other reconstruction methods for the same time period (see point 3 below).

And there is another issue: we’ve previously looked at ERA5 surface heat flux trend, as shown here from my article in Oceanography 2024:

Figure 3 Sea surface temperature trend (left) and surface heat flux trend (right) 1940-2022 from the ERA5 reanalysis data also used in Terhaar et al. Source: Oceanography 2024.

You see in both figures (in temperature as well as surface heat flux) the AMOC slowdown ‘fingerprint’ which includes both the ‘cold blob’ and a warming along the American coast due to a northward Gulf Stream shift, which is also a symptom of AMOC weakening. However, Terhaar et al. integrate over the whole northern Atlantic north of 26 °N so that the red area of increasing heat loss largely compensates for the blue area of decreasing heat loss. So in their analysis these two things cancel, while in the established concept of the ‘fingerprint’ (see Zhang 2008: Coherent surface-subsurface fingerprint of the Atlantic meridional overturning circulation) these two things both reinforce the evidence for an AMOC weakening.

3. How do these new reconstructions compare to others?

Here is how the Terhaar reconstructions (bottom two) compare:

Figure 4 Several AMOC reconstructions, with the RAPID measurements on top. The reconstruction by Frajka-Williams et al. 2015 used surface height data from satellite, and the Worthington et al 2021 reconstruction uses a water mass regression based on RAPID data. Graph: Levke Caesar.

The reconstruction at the bottom using a reanalysis product from Japan doesn’t resemble anything, while the blue one using the European ERA5 reanalysis at least has the 1980s minimum and early 2000s maximum in common with other data, albeit with much smaller amplitude; it is a lot smoother. Thus it also misses the strong AMOC decline 2004-2010 and subsequent partial recovery seen in the RAPID measurements as well as the Caesar and Worthington reconstructions. A main reason for the lack of significant trend in the Terhaar reconstructions further is the time interval they used; for the same time span the Caesar reconstruction also does not show an even remotely significant trend (p-value is only 0.5), so in this respect our reconstructions actually agree for the period they overlap. The fact that ours shows a significant AMOC decline is because of the stable AMOC we find during 1900-1960, which is stronger than in the following sixty years. Here our reconstruction method shows its advantage in that reliable and accurate sea surface temperature data exist so far back in time.

Hence, I do not believe that the new attempt to reconstruct the AMOC is more reliable than earlier methods based on temperature or salinity patterns, on density changes in the ‘cold blob’ region, or on various paleoclimatic proxy data, which have concluded there is a weakening. But since we don’t have direct current measurements going far enough back in time, some uncertainty about that remains. The new study however does not change my assessment of AMOC weakening in any way.

And all agree that the AMOC will weaken in response to global warming in future and that this poses a serious risk, whether this weakening has already emerged from natural variability in the limited observational data we have, or not. Hence the open letter of 44 experts presented in October at the Arctic Circle Assembly (see video of my plenary presentation there), which says:

We, the undersigned, are scientists working in the field of climate research and feel it is urgent to draw the attention of the Nordic Council of Ministers to the serious risk of a major ocean circulation change in the Atlantic. A string of scientific studies in the past few years suggests that this risk has so far been greatly underestimated. Such an ocean circulation change would have devastating and irreversible impacts especially for Nordic countries, but also for other parts of the world.

Post script

Since I’m sometimes asked about that: last year a data study by Volkov et al. revised the slowing trend of the Florida current as well as the AMOC. Contrary to ‘climate skeptics’ claims, it has no impact on our long-term estimate of ~3 Sv slowing since 1950, i.e. -0.4 Sv/decade (Caesar et al. 2018). Both the original and the revised trend estimates for the RAPID section data (see Figure) suggest the recent AMOC weakening since 2004 is steeper than the long-term trend we estimated.

Filed Under: Climate Science, Featured Story, Instrumental Record, IPCC, Model-Obs Comparisons, Oceans, Reporting on climate Tagged With: AMOC, Atlantic Meridional Overturning Circulation, CMIP5, CMIP6, North Atlantic

2024 Hindsight

11 Jan 2025 by Gavin

To no-one’s surprise 2024 was the warmest year on record – and by quite a clear margin.

[Read more…] about 2024 Hindsight

Filed Under: Climate Science, El Nino, Featured Story, Instrumental Record, IPCC Tagged With: 1.5ºC, MSU

Operationalizing Climate Science

17 Nov 2024 by Gavin

There is a need to make climate science more agile and more responsive, and that means moving (some of it) from research to operations.

[Read more…] about Operationalizing Climate Science

Filed Under: Aerosols, Climate impacts, Climate modelling, Climate Science, Featured Story, Greenhouse gases, Instrumental Record, IPCC Tagged With: CMIP6, CMIP7

Much ado about acceleration

4 Apr 2024 by Gavin

There has been a lot of commentary about perceived disagreements among climate scientists about whether climate change is (or will soon be) accelerating. As with most punditry, there is less here than it might seem.

[Read more…] about Much ado about acceleration

Filed Under: Climate modelling, Climate Science, El Nino, Featured Story, Greenhouse gases, Hurricanes, Instrumental Record, IPCC Tagged With: acceleration, climate change, CMIP6

Spencer’s Shenanigans

28 Jan 2024 by Gavin

A recent sensible-sounding piece by Roy Spencer for the Heritage foundation is full of misrepresentations. Let’s play spot the fallacy.

[Read more…] about Spencer’s Shenanigans

Filed Under: Climate modelling, Climate Science, Featured Story, Instrumental Record, IPCC Tagged With: CMIP6, MSU, Roy Spencer

  • Page 1
  • Page 2
  • Page 3
  • Interim pages omitted …
  • Page 12
  • Go to Next Page »

Primary Sidebar

Search

Search for:

Email Notification

get new posts sent to you automatically (free)
Loading

Recent Posts

  • Raising Climate Literacy
  • Unforced variations: Nov 2025
  • High-resolution ‘fingerprint’ images reveal a weakening Atlantic Ocean circulation (AMOC)
  • Unforced variations: Oct 2025
  • “But you said the ice was going to disappear in 10 years!”
  • Time and Tide Gauges wait for no Voortman

Our Books

Book covers
This list of books since 2005 (in reverse chronological order) that we have been involved in, accompanied by the publisher’s official description, and some comments of independent reviewers of the work.
All Books >>

Recent Comments

  • Nigelj on “But you said the ice was going to disappear in 10 years!”
  • Geoff Miell on Unforced variations: Nov 2025
  • Uma Bhatt on Raising Climate Literacy
  • Paul Pukite (@whut) on Unforced variations: Nov 2025
  • Figen on Raising Climate Literacy
  • Figen on Raising Climate Literacy
  • Figen on Raising Climate Literacy
  • Figen on Raising Climate Literacy
  • Figen on Raising Climate Literacy
  • Nigelj on Unforced variations: Nov 2025
  • patrick o twentyseven on Unforced variations: Nov 2025
  • Ray Ladbury on “But you said the ice was going to disappear in 10 years!”
  • Nigelj on Unforced variations: Nov 2025
  • Paul Pukite (@whut) on Unforced variations: Nov 2025
  • Tomáš Kalisz on Unforced variations: Nov 2025
  • Keith Woollard on High-resolution ‘fingerprint’ images reveal a weakening Atlantic Ocean circulation (AMOC)
  • Susan Anderson on “But you said the ice was going to disappear in 10 years!”
  • Susan Anderson on “But you said the ice was going to disappear in 10 years!”
  • Mal Adapted on Raising Climate Literacy
  • Susan Anderson on Raising Climate Literacy
  • jgnfld on Unforced variations: Nov 2025
  • Mal Adapted on Raising Climate Literacy
  • Julian on Unforced variations: Nov 2025
  • Piotr on Unforced variations: Nov 2025
  • Ken Towe on Raising Climate Literacy
  • David on Unforced variations: Nov 2025
  • E. Schaffer on Raising Climate Literacy
  • David on “But you said the ice was going to disappear in 10 years!”
  • Steven Emmerson on “But you said the ice was going to disappear in 10 years!”
  • David on Raising Climate Literacy

Footer

ABOUT

  • About
  • Translations
  • Privacy Policy
  • Contact Page
  • Login

DATA AND GRAPHICS

  • Data Sources
  • Model-Observation Comparisons
  • Surface temperature graphics
  • Miscellaneous Climate Graphics

INDEX

  • Acronym index
  • Index
  • Archives
  • Contributors

Realclimate Stats

1,386 posts

11 pages

248,013 comments

Copyright © 2025 · RealClimate is a commentary site on climate science by working climate scientists for the interested public and journalists.