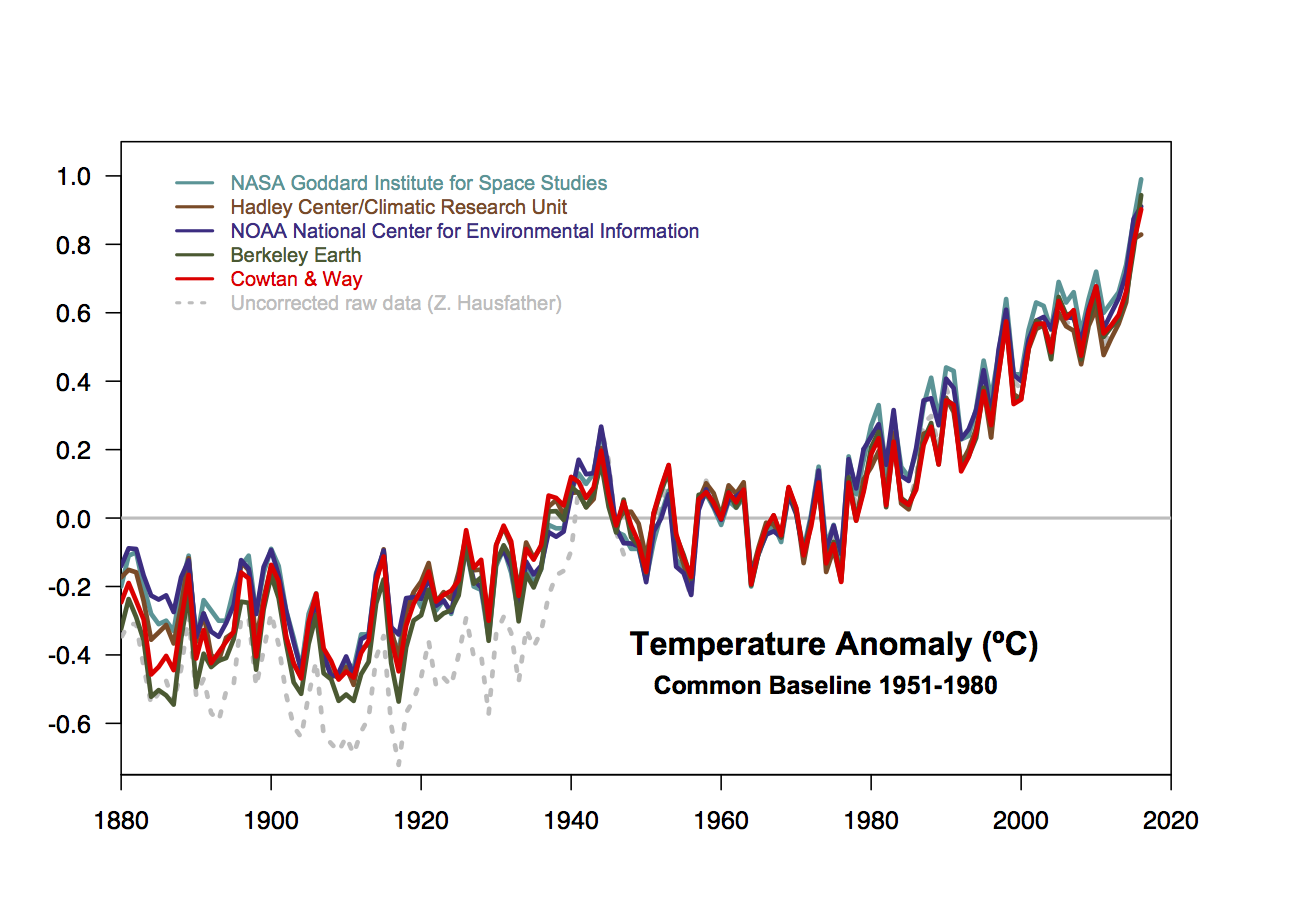
• Skip to primary navigation
  • Skip to main content
  • Skip to primary sidebar
  • Skip to footer

RealClimate

Climate science from climate scientists...

  • Start here
  • Model-Observation Comparisons
  • Miscellaneous Climate Graphics
  • Surface temperature graphics

Blog – realclimate.org – All Posts

Do regional climate models add value compared to global models?

22 May 2016 by rasmus

2016-05-20 10.08.17

Global climate models (GCM) are designed to simulate earth’s climate over the entire planet, but they have a limitation when it comes to describing local details due to heavy computational demands. There is a nice TED talk by Gavin that explains how climate models work.

We need to apply downscaling to compute the local details. Downscaling may be done through empirical-statistical downscaling (ESD) or regional climate models (RCMs) with a much finer grid. Both take the crude (low-resolution) solution provided by the GCMs and include finer topographical details (boundary conditions) to calculate more detailed information. However, does more details translate to a better representation of the world?

The question of “added value” was an important topic at the International Conference on Regional Climate conference hosted by CORDEX of the World Climate Research Programme (WCRP). The take-home message was mixed on whether RCMs provide a better description of local climatic conditions than the coarser GCMs.

[Read more…] about Do regional climate models add value compared to global models?

Filed Under: Climate impacts, Climate modelling, Climate Science, downscaling, Reporting on climate, statistics

AMOC slowdown: Connecting the dots

19 May 2016 by Stefan

I want to revisit a fascinating study that recently came from (mainly) the Geophysical Fluid Dynamics Lab in Princeton. It looks at the response of the Atlantic Ocean circulation to global warming, in the highest model resolution that I have seen so far. That is in the CM2.6 coupled climate model, with 0.1° x 0.1° degrees ocean resolution, roughly 10km x 10km. Here is a really cool animation.

When this model is run with a standard, idealised global warming scenario you get the following result for global sea surface temperature changes.

Saba_Fig4

Fig. 1. Sea surface temperature change after doubling of atmospheric CO2 concentration in a scenario where CO2 increases by 1% every year. From Saba et al. 2016.

[Read more…] about AMOC slowdown: Connecting the dots

Filed Under: Climate Science, Oceans

Recycling Carbon?

9 May 2016 by Stefan

Guest commentary by Tony Patt, ETH Zürich

This morning I was doing my standard reading of the New York Times, which is generally on the good side with climate reporting, and saw the same old thing: an article about a potential solution, which just got the story wrong, at least incomplete. The particular article was about new technologies for converting CO2 into liquid fuels. These could be important if they are coupled with air capture of CO2, and if the energy that fuels them is renewable: this could be the only realistic way of producing large quantities of liquid fuel with no net CO2 emissions, large enough (for example) to supply the aviation sector. But the article suggested that this technology could make coal-fired power plants sustainable, because it would recycle the carbon. Of course that is wrong: to achieve the 2°C target we need to reduce the carbon intensity of the energy system by 100% in about 50 years, and yet the absolute best that a one-time recycling of carbon can do is to reduce the carbon intensity of the associated systems by 50%.

The fact is, there is a huge amount of uncritical, often misleading media coverage of the technological pathways and government policies for climate mitigation. As with the above story, the most common are those suggesting that approaches that result in a marginal reduction of emissions will solve the problem, and fail to ask whether those approaches also help us on the pathway towards 100% emissions reduction, or whether they take us down a dead-end that stops well short of 100%. There are also countless articles suggesting that the one key policy instrument that we need to solve the problem is a carbon tax or cap-and-trade market. We know, from two decades of social-science research, that these instruments do work to bring about marginal reductions in emissions, largely by stimulating improvements in efficiency. We also know that, at least so far, they have done virtually nothing to stimulate investment in the more sweeping changes in energy infrastructure that are needed to eliminate reliance on fossil fuels as the backbone of our system, and hence reduce emissions by 100%. We also know that other policy instruments have worked to stimulate these kinds of changes, at least to a limited extent. One thing we don’t know is what combination of policies could work to bring about the changes fast enough in the future. That is why this is an area of vigorous social science research. Just as there are large uncertainties in the climate system, there are large uncertainties in the climate solution system, and misreporting on these uncertainties can easily mislead us.

It’s fantastic that web sites like Real Climate and Climate Feedback re out there to clear some of the popular misconceptions about how the climate system functions. But if we care about actually solving the problem of climate change, then we also need to work continuously to clear the misconceptions, arising every day, about the strategies to take us there.

Anthony Patt is professor at the ETH in Zurich; his research focuses on climate policy

Filed Under: Reporting on climate, Solutions

Comparing models to the satellite datasets

7 May 2016 by Gavin

How should one make graphics that appropriately compare models and observations? There are basically two key points (explored in more depth here) – comparisons should be ‘like with like’, and different sources of uncertainty should be clear, whether uncertainties are related to ‘weather’ and/or structural uncertainty in either the observations or the models. There are unfortunately many graphics going around that fail to do this properly, and some prominent ones are associated with satellite temperatures made by John Christy. This post explains exactly why these graphs are misleading and how more honest presentations of the comparison allow for more informed discussions of why and how these records are changing and differ from models.
[Read more…] about Comparing models to the satellite datasets

Filed Under: Climate modelling, Climate Science, El Nino, Greenhouse gases, Instrumental Record, IPCC, Model-Obs Comparisons, statistics

Unforced variations: May 2016

4 May 2016 by group

This month’s open thread. Usual rules apply.

Filed Under: Climate Science, Open thread

Nenana Ice Classic 2016

23 Apr 2016 by Gavin

Just a quick note since I’ve been tracking this statistic for a few years, but the Nenana Ice Classic tripod went down this afternoon (Apr 23, 3:39 Alaska Standard Time). See the earlier post for what this is and why it says something about the climate (see posts on 2014 and 2015 results).

With this unofficial time, this year places 4th earliest for the breakup of ice in the Tanana river. It is unsurprising that it was early given the exceptional warmth in Alaska this year.

The exact ranking of years depends a little on how one accounts for leap-year and other calendrical effects. The raw date is the 4th earliest, but given that this year is a leap year, it would be the 5th earliest counting Julian days from the start of the year. Tying the season to the vernal equinox is more stable, which again leads to the 4th earliest. But regardless of that detail, and consistent with local climate warming, the ice break-up date have advanced about 7 days over the last century.

As a side bet, I predict (based on previous years) that despite enormous attention in the skeptic-osphere given the Nenana result in 2013 (when it was remarkably late), it won’t be mentioned there this year.

Filed Under: Climate Science, Instrumental Record, statistics

The Volcano Gambit

9 Apr 2016 by Gavin

Anyone reading pundits and politicians pontificating profusely about climate or environmental science will, at some point, have come across the “volcano gambit”. During the discussion they will make a claim that volcanoes (or even a single volcano) produce many times more pollutant emissions than human activities. Often the factor is extremely precise to help give an illusion of science-iness and, remarkably, almost any pollutant can be referenced. This “volcano gambit” is an infallible sign that indicates the author is clueless about climate science, but few are aware of its long and interesting history…

[Read more…] about The Volcano Gambit

Filed Under: Carbon cycle, Climate Science, Greenhouse gases, Instrumental Record, skeptics

Unforced Variations: Apr 2016

2 Apr 2016 by group

This month’s open thread. Standard rules apply…

Filed Under: Climate Science, Open thread

What drives uncertainties in adapting to sea-level rise?

17 Mar 2016 by Stefan

Guest article by Sally Brown, University of Southampton

Let me get this off my chest – I sometimes get frustrated at climate scientists as they love to talk about uncertainties! To be sure, their work thrives on it. I’m someone who researches the projected impacts and adaptation to sea-level rise and gets passed ‘uncertain’ climate data projections to add to other ‘uncertain’ data projections in my impact modellers work bag. But climate scientists do a good job. Without exploring uncertainties, science loses robustness, but uncertainties in combination can become unbounded and unhelpful to end users.

Let’s take an adaptation to sea-level rise as an example: With increasing scientific knowledge, acceptance and mechanisms that would allow adaptation to potentially occur, one would think that adaptation would be straight forward to implement. Not so. Instead of hard and fast numbers, policy makers are faced with wide ranges of uncertainties from different sources, making decision making challenging. So what uncertainties are there in the drivers of change, and can understanding these uncertainties enable better decisions for adaptation?

Prior to considering adaptation in global or regional models, or implementation at local level, drivers of change and their impacts (and thus uncertainties) require analysis – here are a few examples. [Read more…] about What drives uncertainties in adapting to sea-level rise?

Filed Under: Climate impacts, Climate Science, Oceans

The Early Anthropocene Hypothesis: An Update

15 Mar 2016 by mike

Guest post from Bill Ruddiman, University of Virginia

For over a decade, paleoclimate scientists have argued whether the warmth of the last several thousand years was natural or anthropogenic. This brief comment updates that debate, also discussed earlier at RC: Debate over the Early Anthropogenic Hypothesis (2005) and An Emerging View on Early Land Use (2011). The graph below outlines the evolution of that debate through 4 phases.

RuddimanFigure

In phase 1 (the 1900’s), scientists viewed Holocene climate change as driven only by natural causes until the industrial era began. But by the late 1990’s, ice core data revealed late Holocene GHG rises unlike trends in previous interglaciations. Two hypotheses proposed natural causes for the CO2 increase: carbonate compensation (Broecker et al., 1999, 2001) and coral-reef construction (Ridgewell et al., 2003).

In phase 2 (2001-2003), the early anthropogenic hypothesis (EAH) challenged natural explanations for the anomalous late Holocene CO2 (and CH4) rises, attributing them to the spread of early agriculture thousands of years ago.

In phase 3 (2004-2008), several arguments were advanced against the EAH:
* too few people lived millennia ago to have had a significant influence on land clearance, GHG emissions and climate;
* a (proposed) interglacial stage 11 analog for the Holocene suggested that thousands of years of natural warmth still remain in the current interglaciation;
* the weak decrease in ice core δ13CO2 during the last 7000 years did not permit extensive deforestation which would have released abundant 12C -rich carbon.
Papers by myself, my co-authors at Wisconsin, and others during phase 3 rebutted some of these criticisms, but community opinion remained divided.

Phase 4 (2009-2016) has seen a major shift in viewpoint of published papers: 30 papers favor aspects of the EAH, 6 papers oppose it, and 5 are in the middle. Most of the phase 4 papers that oppose the hypothesis or are ‘in the middle’ are based on modeling studies. Many of the 30 supporting papers are broad-scale compilations of archaeological and paleoecological evidence:
* The average GHG trends from 7 previous interglaciations show CO2 and CH4 decreases, in contrast to the late Holocene increases;
* Interglacial stage 19, the closest Holocene analog, shows decreases in CH4 and CO2, and the CO2 decrease closely matches the 2003 EAH prediction;
* CH4 emissions from Asian rice paddies account for 70% of the observed CH4 rise from 5000 to 1000 years ago
* historical data show that early per-capita land use was at least 4 times larger than assumed in several phase-3 land use simulations
* a recent land use simulation based on historical evidence accounts for more than half the CO2 anomaly originally proposed in the EAH;
* pollen evidence shows nearly complete deforestation in north-central Europe before the industrial era began;
* δD and δ18O trends show anomalous late Holocene warmth compared to cooling trends in prior interglaciations, in agreement with A-OGCM simulations of the warming effect of the anthropogenic CO2 and CH4 trends.

_____________
Anyone seeking more detail on this issue should contact pisgahill@gmail.com for pdf copies of the recent 2016 Ruddiman et al. paper in Reviews of Geophysics and an invited paper just submitted to Oxford University Press that summarizes the history of this debate, with full references to the papers shown in the table.

Filed Under: Climate Science

  • « Go to Previous Page
  • Page 1
  • Interim pages omitted …
  • Page 37
  • Page 38
  • Page 39
  • Page 40
  • Page 41
  • Interim pages omitted …
  • Page 137
  • Go to Next Page »

Primary Sidebar

Search

Search for:

Email Notification

get new posts sent to you automatically (free)
Loading

Recent Posts

  • Unforced variations: July 2025
  • Unforced variations: Jun 2025
  • Predicted Arctic sea ice trends over time
  • The most recent climate status
  • Unforced variations: May 2025
  • Unforced Variations: Apr 2025

Our Books

Book covers
This list of books since 2005 (in reverse chronological order) that we have been involved in, accompanied by the publisher’s official description, and some comments of independent reviewers of the work.
All Books >>

Recent Comments

  • Pedro Prieto on Unforced variations: July 2025
  • Nigelj on Unforced variations: July 2025
  • Scott Nudds on Unforced variations: July 2025
  • Susan Anderson on Unforced variations: July 2025
  • William on Unforced variations: July 2025
  • jgnfld on Unforced variations: July 2025
  • Piotr on Unforced variations: July 2025
  • William on Unforced variations: July 2025
  • William on Unforced variations: July 2025
  • Paul Pukite (@whut) on Unforced variations: July 2025
  • William on Unforced variations: July 2025
  • William on Unforced variations: July 2025
  • Scott Nudds on Unforced variations: July 2025
  • Scott Nudds on Unforced variations: July 2025
  • William on Predicted Arctic sea ice trends over time
  • Piotr on Predicted Arctic sea ice trends over time
  • CherylJosie on Unforced variations: July 2025
  • William on Predicted Arctic sea ice trends over time
  • Tomáš Kalisz on Unforced variations: July 2025
  • Piotr on Unforced variations: July 2025

Footer

ABOUT

  • About
  • Translations
  • Privacy Policy
  • Contact Page
  • Login

DATA AND GRAPHICS

  • Data Sources
  • Model-Observation Comparisons
  • Surface temperature graphics
  • Miscellaneous Climate Graphics

INDEX

  • Acronym index
  • Index
  • Archives
  • Contributors

Realclimate Stats

1,368 posts

11 pages

244,172 comments

Copyright © 2025 · RealClimate is a commentary site on climate science by working climate scientists for the interested public and journalists.