The past winter was globally the warmest on record. At the same time it set a new cold record in the subpolar North Atlantic – and it was very cold in the eastern parts of North America. Are these things related?
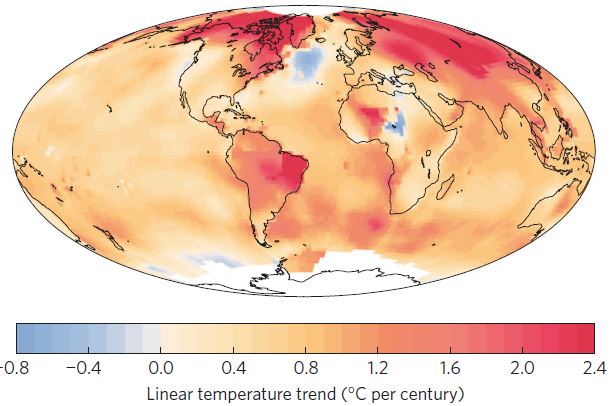
Two weeks ago NOAA published the following map of temperature anomalies for the past December-January-February (i.e. the Northern Hemisphere winter). One week ago, we published a paper in Nature Climate Change (which had been in the works for a few years) arguing that the cold in the subpolar North Atlantic is indicative of an AMOC slowdown (as discussed in my last post). Immediately our readers started to ask (as we indeed had been asking ourselves): does the cold winter in eastern North America (culminating in the Inhofe snowball incident) have anything to do with what is going on in the Atlantic?
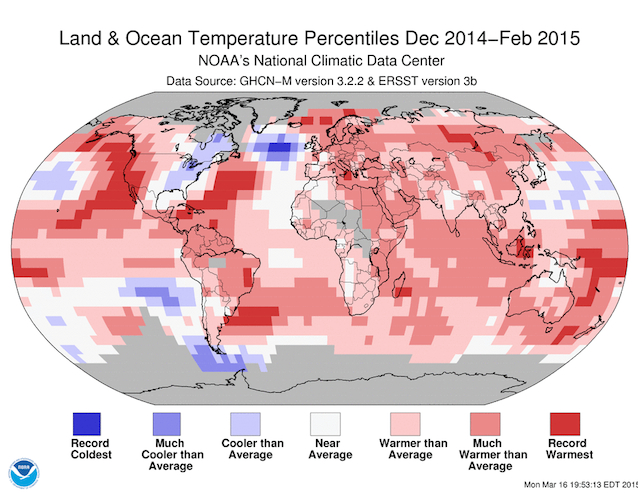 Fig. 1 Temperature anomaly map for the past december-january-february, from NOAA.
[Read more…] about A hypothesis about the cold winter in eastern North America + Update
References
- S. Rahmstorf, J.E. Box, G. Feulner, M.E. Mann, A. Robinson, S. Rutherford, and E.J. Schaffernicht, "Exceptional twentieth-century slowdown in Atlantic Ocean overturning circulation", Nature Climate Change, vol. 5, pp. 475-480, 2015. http://dx.doi.org/10.1038/nclimate2554