In a comment in Nature titled Ditch the 2 °C warming goal, political scientist David Victor and retired astrophysicist Charles Kennel advocate just that. But their arguments don’t hold water.
It is clear that the opinion article by Victor & Kennel is meant to be provocative. But even when making allowances for that, the arguments which they present are ill-informed and simply not supported by the facts. The case for limiting global warming to at most 2°C above preindustrial temperatures remains very strong.
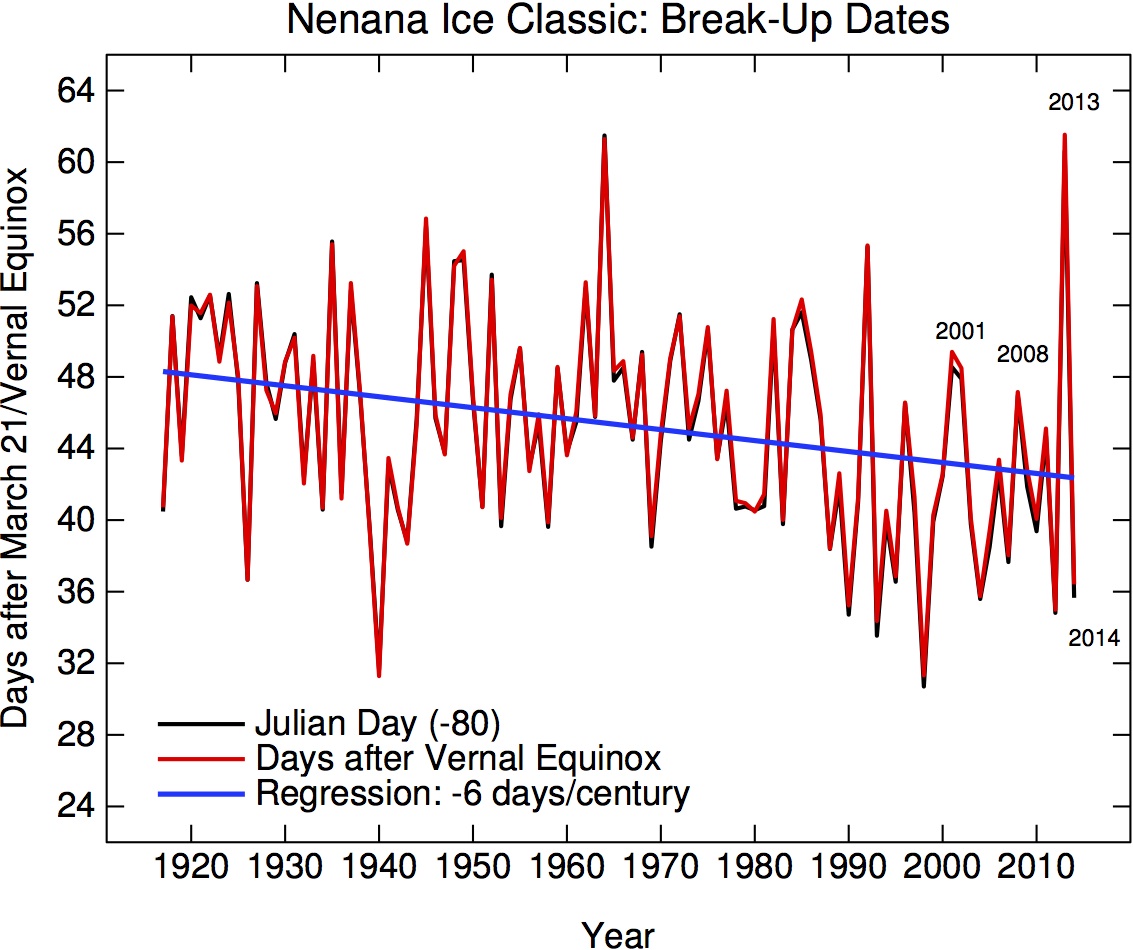
Let’s start with an argument that they apparently consider especially important, given that they devote a whole section and a graph to it. They claim:
The scientific basis for the 2 °C goal is tenuous. The planet’s average temperature has barely risen in the past 16 years. [Read more…] about Limiting global warming to 2 °C – why Victor and Kennel are wrong + update