So Wednesday was temperature series update day. The HadCRUT4, NOAA NCEI and GISTEMP time-series were all updated through to the end of 2018 (slightly delayed by the federal government shutdown). Berkeley Earth and the MSU satellite datasets were updated a couple of weeks ago. And that means that everyone gets to add a single additional annual data point to their model-observation comparison plots!
Climate Science
Forced Responses: Feb 2019
A bimonthly thread on societal responses to climate change. Note that there is another open thread for climate science topics. Please stick to specifics as opposed to arguments about ethics, politics or morality in general.
Unforced variations: Feb 2019
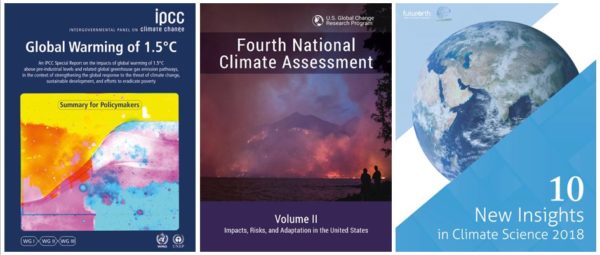
What the 2018 climate assessments say about the Gulf Stream System slowdown
Last year, twenty thousand peer reviewed studies on ‘climate change’ were published. No single person can keep track of all those – you’d have to read 55 papers every single day. (And, by the way, that huge mass of publications is why climate deniers will always find something to cherry-pick that suits their agenda.) That is why climate assessments are so important, where a lot of scientists pool their expertise and discuss and assess and summarize the state of the art.
So let us have a quick look what last year’s climate assessments say about the much-discussed topic of whether the Atlantic Meridional Overturning Circulation (AMOC, a.k.a. Gulf Stream System) has already slowed down, as predicted by climate models in response to global warming.
New Ocean Heat Content Histories
Guest commentary from Laure Zanna (U. Oxford) and G. Jake Gebbie (WHOI)
Two recent papers, [cite ref=”Zanna et al. (2019)”]10.1073/pnas.1808838115[/cite] (hereafter ZKGIH19) and [cite ref=”Gebbie & Huybers (2019)”]10.1126/science.aar8413[/cite] (hereafter GH19), independently reconstructed ocean heat content (OHC) changes prior to the instrumentally-based records (which start ~1950). The goals (and methodologies) of the two papers were quite different – ZKGIH19 investigated regional patterns of ocean warming and thermal sea level rise, while GH19 analyzed the long-term memory of the deep ocean – but they both touch on the same key questions of climate forcing and response.
[Read more…] about New Ocean Heat Content HistoriesThe Climate Scientists are Alright
Guest commentary from Eric Guilyardi (IPSL) and Valérie Masson-Delmotte (IPSL/IPCC)
[This is a translation of an article in Le Monde (Jan 11).]
In recent weeks in France, there has been a profusion of articles about the “climate scientist blues” (Le Monde 21/Dec, JDD 9/Dec, France Info 26/Sep), which has apparently affecting them “scientifically”. This follows a spate of similar articles in the US and Australian media (Esquire, 2015; The Monthly, 2018; Sierra Club Magazine, 2018). But what is the point of knowing the mood of scientists, or whether so-and-so is optimistic or pessimistic?
[Read more…] about The Climate Scientists are AlrightDecluttering
Given some unexpected down time this month (and maybe next month too!), I’ve been trying to go through key old posts on this site. The basic idea is to update links to other sites, references and figures that over the years have died (site domains that were abandoned, site redesigns, deliberate deletions etc.). Most notably, the IPCC website recently broke all the existing links to elements of the reports which we had referenced in hundreds of places. Thanks guys!
Some folk have been notifying us of issues they found (thanks Marcus!) and I’ve been fixing those as they come up, but obviously there are more. Links to old blog posts from Deltoid, Scienceblogs, Pielke Sr. or Prometheus generally don’t work anymore though they can sometimes be found on the wayback machine. It turns out a lot has changed since 2004 and many hotlinked images in particular have disappeared.
It’s obviously not worth finding replacements for every dead link, but digital uncluttering and fixing up is useful. So, please use this thread to notify us of any useful fixes we can make (and if you have an updated link,, that’d be perfect). Additionally, please let us know if any of the old content is still useful or interesting to you. We know there is still substantial traffic to the back catalog, so maybe it should be highlighted in some way?
To those of you who might ask whether blogging still brings me joy… of course it does!
NOAA-thing burger officially confirmed
Back in February 2017, I wrote about the tediously predictable arc of criticisms of the [cite ref=”Karl et al (2015)”]10.1126/science.aaa5632[/cite] paper, and in particular the comments of John Bates at Judith Curry’s blog.
an initial claim of imperfection spiced up with insinuations of misconduct, coordination with a breathless hyping of the initial claim with ridiculous supposed implications, some sensible responses refuting the initial specific claims and demolishing the wilder extrapolations. Unable to defend the nonsense clarifications are made that the initial claim wasn’t about misconduct but merely about ‘process’ (for who can argue against better processes?). Meanwhile the misconduct and data falsification claims escape into the wild, get more exaggerated and lose all connection to any actual substance.
The outcome was easy to predict:
the issues of ‘process’ will be lost in the noise, the fake overreaction will dominate the wider conversation and become an alternative fact to be regurgitated in twitter threads and blog comments for years, the originators of the issue may or may not walk back the many mis-statements they and others made but will lose credibility in any case, mainstream scientists will just see it as hyper-partisan noise and ignore it, no papers will be redacted, no science will change, and the actual point (one presumes) of the ‘process’ complaint (to encourage better archiving practices) gets set back because it’s associated with such obvious nonsense.
But I missed out the very final outcome which I should have been able to predict too: a report, commissioned from learned experts, who spent months poring over the details (including more than 600,000 emails!) and in the end, concluding there was nothing significantly wrong in anything Karl et al did.
That report has now been made public. [Update: apparently this happened in December]
In it the authors make some sensible recommendations to clean up the thicket of conflicting requirements at NOAA for publishing science papers, they spot one mistake made by Karl et al (submitting to Science the day before the NOAA internal review was officially completed), but overall find no substance to the allegations of “thumbs on the scale”, no improper interference by politicians, no rush to publish to influence political discussions, no data tampering, no missing archives. Nothing.
But there is one curious revelation. It turns out that the person in charge of the NOAA internal review about which John Bates was so concerned was…. John Bates!
And even more curiously:
“The MITRE Committee learned that the internal review, later criticized by Bates, was conducted and approved under his own authority. The MITRE Committee found no evidence that Bates ever mentioned this fact in his blog, email, or anywhere else in his discussion of the matter in public.”
Did he mention this to David Rose or Judith Curry in private perhaps? If so, you’d think that they would have publically said so. If not, it adds one more misrepresentation to the pile.
What a colossal and counter-productive waste of everyone’s time.
Unforced Variations: Jan 2019
Let’s check your temperature
The underlying mission of my job is to safeguard lives and property through climate change adaptation based on science. In other words, to help society to prepare itself for risks connected with more extreme rainfall and temperatures.
For many people, “climate” may seem to be an abstract concept. I have had many conversations about climate, and then realised that people often have different interpretations. In my mind, climate is the same as weather statistics (which I realise can be quite abstract to many).
To avoid miscommunication, I want to make sure that we are on the same page when I discuss climate. Maybe it helps if I talk about more familiar and specific aspects, such as the temperature, rainfall, snow, or wind?