I just came across an interesting way to eliminate the impression of a global warming. A trick used to argue that the global warming had stopped, and the simple recipe is as follows:
Climate Science
Updating the CRU and HadCRUT temperature data
The latest incarnation of the CRUTEM land surface temperatures and the HadCRUT global temperatures are out this week. This is the 4th version of these products, which have undergone a number of significant changes over that time and so this is a good opportunity to discuss how and why data products evolve and what that means in the bigger scheme of things.
[Read more…] about Updating the CRU and HadCRUT temperature data
Sherwood Rowland, CFCs, ozone depletion and the public role of scientists
Many of you will have read the obituaries of the Nobel Prize-winning chemist Sherwood Rowland (Nature, BBC) who sadly died over the weekend. DotEarth has a good collection of links to papers, videos and tributes.
[Read more…] about Sherwood Rowland, CFCs, ozone depletion and the public role of scientists
Misrepresentation from Lindzen
Richard Lindzen is a very special character in the climate debate – very smart, high profile, and with a solid background in atmospheric dynamics. He has, in times past, raised interesting critiques of the mainstream science. None of them, however, have stood the test of time – but exploring the issues was useful. More recently though, and especially in his more public outings, he spends most of his time misrepresenting the science and is a master at leading people to believe things that are not true without him ever saying them explicitly.
However, in his latest excursion at a briefing at the House of Lords Commons in the UK, among the standard Lindzen arguments was the following slide (which appears to be a new addition):
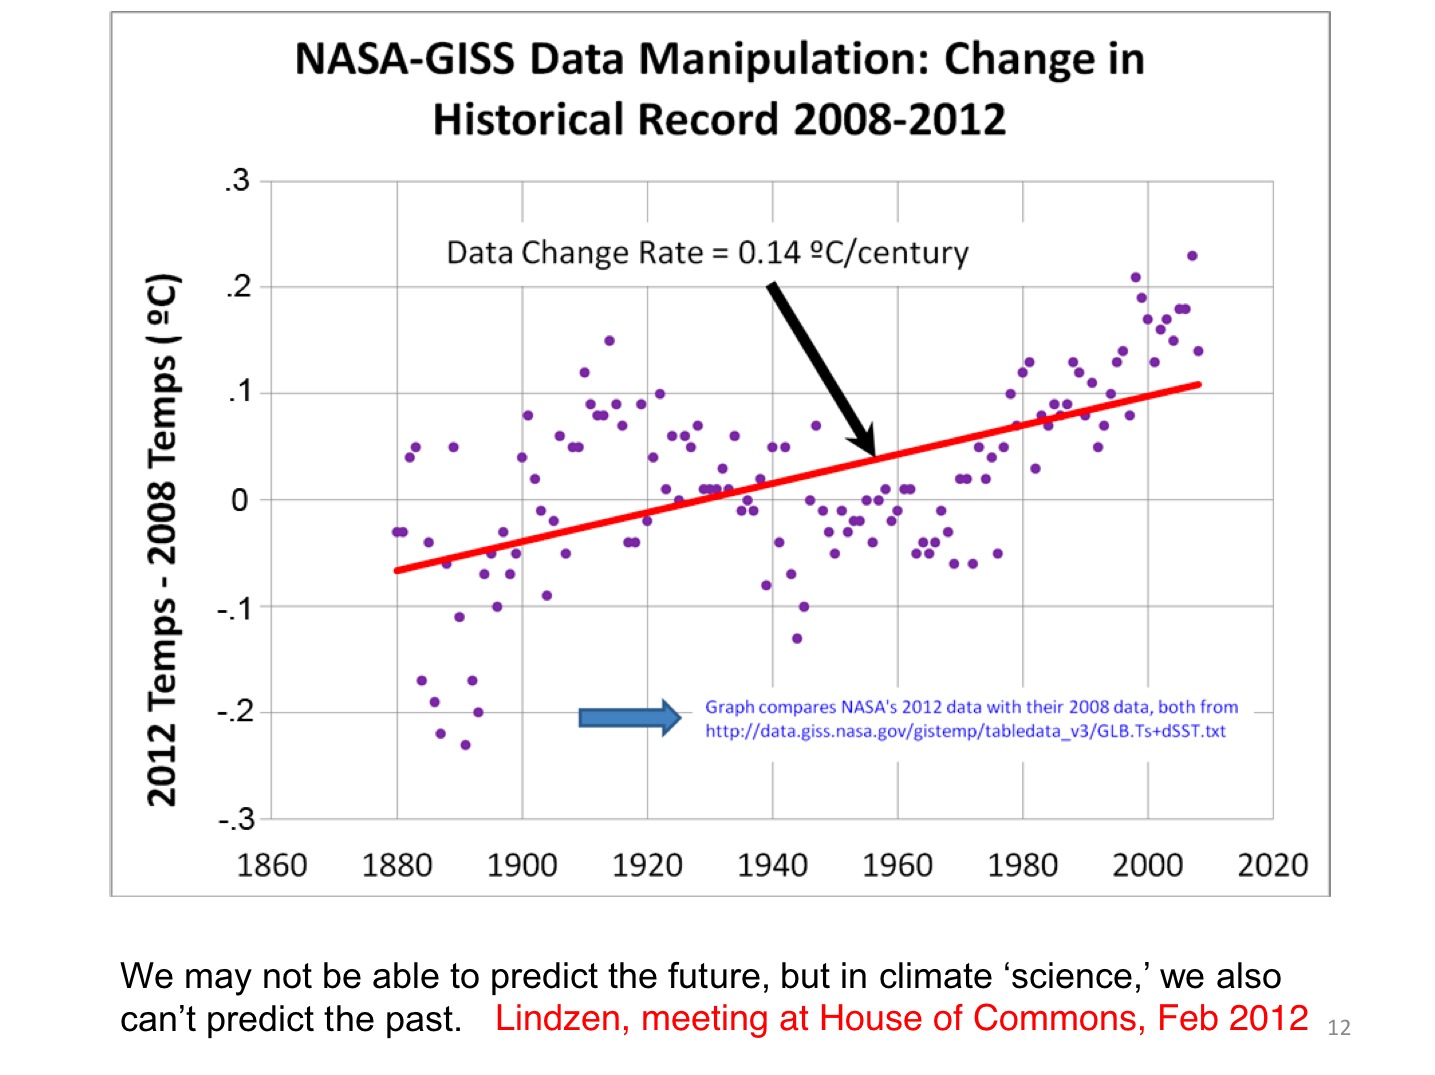
What Lindzen is purporting to do is to compare the NASA GISS temperature product from 2012 to the version in 2008 (i.e. the y-axis is the supposedly the difference between what GISS estimated the anomaly to be in 2012 relative to 2008). A rising trend would imply that temperatures in more recent years had been preferentially enhanced in the 2012 product. The claim being made is that NASA GISS has ‘manipulated’ (in a bad way) the data in order to produce an increasing trend of global mean temperature anomalies (to the tune of 0.14ºC/Century compared to the overall trend of 0.8ºC/Century) between the 2008 and 2012 versions of the data, which are apparently shown subtracted from each other in Lindzen’s figure. Apparently, this got ‘a big laugh’ at his presentation.
However, this is not in the least bit true: the data are not what he claims, the interpretation is wrong, and the insinuations are spurious.
Unforced Variations: March 2012
This month’s open thread – for appetizers we have: William Nordhaus’s extremely impressive debunking in the NY Review of Books of the WSJ 16 letter and public polling on the issue of climate change. Over to you…
Bickmore on the WSJ response
Guest commentary from Barry Bickmore (repost)
The Wall Street Journal posted yet another op-ed by 16 scientists and engineers, which even include a few climate scientists(!!!). Here is the editor’s note to explain the context.
Editor’s Note: The authors of the following letter, listed below, are also the signatories of“No Need to Panic About Global Warming,” an op-ed that appeared in the Journal on January 27. This letter responds to criticisms of the op-ed made by Kevin Trenberth and 37 others in a letter published Feb. 1, and by Robert Byer of the American Physical Society in a letter published Feb. 6.
A relative sent me the article, asking for my thoughts on it. Here’s what I said in response.
[Read more…] about Bickmore on the WSJ response
2011 Updates to model-data comparisons
And so it goes – another year, another annual data point. As has become a habit (2009, 2010), here is a brief overview and update of some of the most relevant model/data comparisons. We include the standard comparisons of surface temperatures, sea ice and ocean heat content to the AR4 and 1988 Hansen et al simulations.
[Read more…] about 2011 Updates to model-data comparisons
Global Temperatures, Volcanic Eruptions, and Trees that Didn’t Bark
My co-authors and I have just published an article in Nature Geoscience (advance online publication here; associated press release here) which seeks to explain certain enigmatic features of tree-ring reconstructions of Northern Hemisphere (NH) temperatures of the past millennium. Most notable is the virtual absence of cooling in the tree-ring reconstructions during what ice core and other evidence suggest is the most explosive volcanic eruption of the past millennium–the AD 1258 eruption. Other evidence suggests wide-spread global climate impacts of this eruption [see e.g. the review by Emile-Geay et al (2008)]. We argue that this–and other missing episodes of volcanic cooling, are likely an artifact of biological growth effects, which lead to a substantial underestimation of the largest volcanic cooling events in trees growing near treeline. We speculate that this underestimation may also have led to overly low estimates of climate sensitivity in some past studies attempting to constrain climate model sensitivity parameters with proxy-reconstructed temperature changes.
Tree rings are used as proxies for climate because trees create unique rings each year that often reflect the weather conditions that influenced the growing season that year. For reconstructing past temperatures, dendroclimatologists typically seek trees growing at the boreal or alpine treeline, since temperature is most likely to be the limiting climate variable in that environment. But this choice may also prove problematic under certain conditions. Because the trees at these locations are so close to the threshold for growth, if the temperature drops just a couple of degrees during the growing season, there will be little or no growth and therefore a loss of sensitivity to any further cooling. In extreme cases, there may be no growth ring at all. And if no ring was formed in a given year, that creates a further complication, introducing an error in the chronology established by counting rings back in time.
[Read more…] about Global Temperatures, Volcanic Eruptions, and Trees that Didn’t Bark
So What’s A Teacher to Do?
Guest Commentary by Eugenie Scott, National Center for Science Education
Imagine you’re a middle-school science teacher, and you get to the section of the course where you’re to talk about climate change. You mention the “C” words, and two students walk out of the class.
Or you mention global warming and a hand shoots up.
“Mrs. Brown! My dad says global warming is a hoax!”
Or you come to school one morning and the principal wants to see you because a parent of one of your students has accused you of political bias because you taught what scientists agree about: that the Earth is getting warmer, and human actions have had an important role in this warming.
Or you pick up the newspaper and see that your state legislature is considering a bill that declares that accepted sciences like global warming (and evolution, of course) are “controversial issues” that require “alternatives” to be taught.
[Read more…] about So What’s A Teacher to Do?
Unforced Variations: February 2012
This month’s open thread. Current topics are focused on the laughingly bad Daily Mail article by David Rose, the fallout from the Wall Street Journal’s latest regurgitation of why no-one should ever do anything ever. And perhaps someone might want to audit some of David Whitehouse’s arithmetic and reading comprehension…
Or anything else. Within reason.