Many of our tech-savvy friends — the kind of folks who nurse along the beowulf clusters our climate models run on — are scratching their heads over some cheeky shrieking that recently appeared in a WIRED magazine article on Rethinking What it Means to be Green . Crank up the A/C! Kill the Spotted Owl! Keep the SUV! What’s all that supposed to be about?
Climate Science
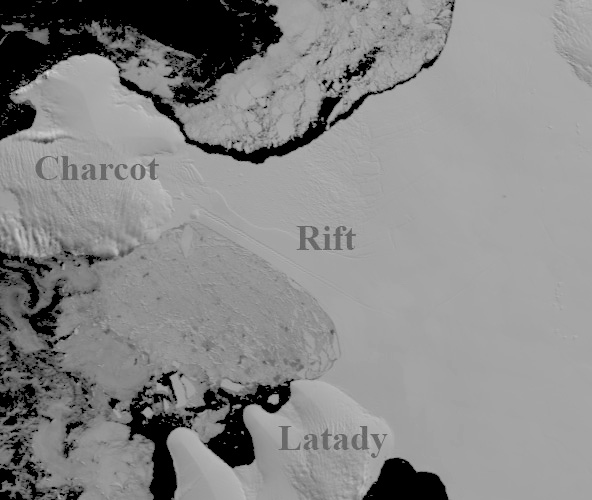
Ice Shelf Instability
Guest contribution from Mauri S. Pelto
Ice shelves are floating platforms of ice fed by mountain glaciers and ice sheets flowing from the land onto the ocean. The ice flows from the grounding line where it becomes floating to the seaward front, where icebergs calve. For a typical glacier when the climate warms the glacier merely retreats, reducing its low elevation, high melting area by increasing its mean elevation. An ice shelf is nearly flat and cannot retreat in this fashion. Ice shelves cannot persist unless the entire ice shelf is an accumulation zone, where snowpack does not completely melt even in the summer.
Of buckets and blogs
This last week has been an interesting one for observers of how climate change is covered in the media and online. On Wednesday an interesting paper (Thompson et al) was published in Nature, pointing to a clear artifact in the sea surface temperatures in 1945 and associating it with the changing mix of fleets and measurement techniques at the end of World War II. The mainstream media by and large got the story right – puzzling anomaly tracked down, corrections in progress after a little scientific detective work, consequences minor – even though a few headline writers got a little carried away in equating a specific dip in 1945 ocean temperatures with the more gentle 1940s-1970s cooling that is seen in the land measurements. However, some blog commentaries have gone completely overboard on the implications of this study in ways that are very revealing of their underlying biases.
The best commentary came from John Nielsen-Gammon’s new blog where he described very clearly how the uncertainties in data – both the known unknowns and unknown unknowns – get handled in practice (read that and then come back). Stoat, quite sensibly, suggested that it’s a bit early to be expressing an opinion on what it all means. But patience is not one of the blogosphere’s virtues and so there was no shortage of people extrapolating wildly to support their pet hobbyhorses. This in itself is not so unusual; despite much advice to the contrary, people (the media and bloggers) tend to weight new individual papers that make the news far more highly than the balance of evidence that really underlies assessments like the IPCC. But in this case, the addition of a little knowledge made the usual extravagances a little more scientific-looking and has given it some extra steam.
[Read more…] about Of buckets and blogs
Freeman Dyson’s selective vision
In the New York Review of Books, Freeman Dyson reviews two recent ones about global warming, but his review is mostly shaped by his own rather selective vision.
1. Carbon emissions are not a problem because in a few years genetic engineers will develop “carbon-eating trees” that will sequester carbon in soils. Ah, the famed Dyson vision thing, this is what we came for. The seasonal cycle in atmospheric CO2 shows that the lifetime of a CO2 molecule in the air before it is exchanged with another in the land biosphere is about 12 years. Therefore if the trees could simply be persuaded to drop diamonds instead of leaves, repairing the damage to the atmosphere could be fast, I suppose. The problem here, unrecognized by Dyson, is that the business-as-usual he’s defending would release almost as much carbon to the air by the end of the century as the entire reservoir of carbon stored on land, in living things and in soils combined. The land carbon reservoir would have to double in size in order keep up with us. This is too visionary for me to bet the farm on.
Tropical tropospheric trends again
Back in December 2007, we quite heavily criticised the paper of Douglass et al (in press at IJoC) which purported to show that models and data were inconsistent when it came to the trends in the tropical troposphere. There were two strands to our critique: i) that the statistical test they used was not appropriate and ii) that they did not acknowledge the true structural uncertainty in the observations. Most subsequent discussion has been related to the statistical issue, but the second point is perhaps more important.
Even when Douglass et al was written, those authors were aware that there were serious biases in the radiosonde data (they had been reported in Sherwood et al, 2005 and elsewhere), and that there were multiple attempts to objectively address the problems and to come up with more homogeneous analyses. We mentioned the RAOBCORE project at the time and noted the big difference using their version 1.4 vs 1.2 made to the comparison (a difference nowhere mentioned in Douglass et al’s original accepted paper which only reported on v1.2 despite them being aware of the issue). However, there are at least three new papers in press that independently tackle the issue, and their results go a long towards addressing the problems.
[Read more…] about Tropical tropospheric trends again
How to cook a graph in three easy lessons
 These days, when global warming inactivists need to trot out somebody with some semblance of scientific credentials (from the dwindling supply who have made themselves available for such purposes), it seems that they increasingly turn to Roy Spencer, a Principal Research Scientist at the University of Alabama. Roy does have a handful of peer-reviewed publications, some of which have quite decent and interesting results in them. However, the thing you have to understand is that what he gets through peer-review is far less threatening to the mainstream picture of anthropogenic global warming than you’d think from the spin he puts on it in press releases, presentations and the blogosphere. His recent guest article on Pielke Sr’s site is a case in point, and provides the fodder for our discussion today.
[Read more…] about How to cook a graph in three easy lessons
Climate Change and Tropical Cyclones (Yet Again)
By Rasmus Benestad & Michael Mann
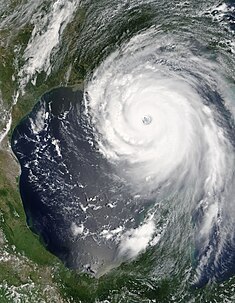
Just as Typhoon Nargis has reminded us of the destructive power of tropical cyclones (with its horrible death toll in Burma–around 100,000 according to the UN), a new paper by Knutson et al in the latest issue of the journal Nature Geosciences purports to project a reduction in Atlantic hurricane activity (principally the ‘frequency’ but also integrated measures of powerfulness).
The close timing of the Knutson et al and Typhoon Nargis is of course coincidental. But the study has been accorded the unprecedented privilege (that is, for a climate change article published during the past 7 years) of a NOAA press conference. What’s the difference this time? Well, for one thing, the title of the paper: “Simulated reduction in Atlantic hurricane frequency under twenty-first-century warming conditions” (emphasis added).
[Read more…] about Climate Change and Tropical Cyclones (Yet Again)
The Global Cooling Bet – Part 2 Apuesta al Enfriamiento Global – Segunda Parte La scommessa sul raffreddamento globale – II parte
Last week we proposed a bet against the “pause in global warming” forecast in Nature by Keenlyside et al. and we promised to present our scientific case later – so here it is.
Traducido por Angela Carosio
La semana pasada propusimos una apuesta contra el pronóstico en un artículo de la revista Nature “pausa en el calentamiento global” por Keenlyside et al. y prometimos presentar nuestro caso científico en otra ocasión, y aquí está.
[Read more…] about The Global Cooling Bet – Part 2
What the IPCC models really say Lo que dicen realmente los modelos del IPCC Cosa dicono realmente i modelli dell‘IPCC
Over the last couple of months there has been much blog-viating about what the models used in the IPCC 4th Assessment Report (AR4) do and do not predict about natural variability in the presence of a long-term greenhouse gas related trend. Unfortunately, much of the discussion has been based on graphics, energy-balance models and descriptions of what the forced component is, rather than the full ensemble from the coupled models. That has lead to some rather excitable but ill-informed buzz about very short time scale tendencies. We have already discussed how short term analysis of the data can be misleading, and we have previously commented on the use of the uncertainty in the ensemble mean being confused with the envelope of possible trajectories (here). The actual model outputs have been available for a long time, and it is somewhat surprising that no-one has looked specifically at it given the attention the subject has garnered. So in this post we will examine directly what the individual model simulations actually show.
[Read more…] about What the IPCC models really say
Global Cooling-Wanna Bet? Enfriamiento Global, ¿Quieres apostar? Raffreddamento Globale – scommettiamo?
By Stefan Rahmstorf, Michael Mann, Ray Bradley, William Connolley, David Archer, and Caspar Ammann
Global cooling appears to be the “flavour of the month”. First, a rather misguided media discussion erupted on whether global warming had stopped, based on the observed temperatures of the past 8 years or so (see our post). Now, an entirely new discussion is capturing the imagination, based on a group of scientists from Germany predicting a pause in global warming last week in the journal Nature (Keenlyside et al. 2008).
Specifically, they make two forecasts for global temperature, as discussed in the last paragraphs of their paper and shown in their Figure 4 (see below). The first forecast concerns the time interval 2000-2010, while the second concerns the interval 2005-2015 (*). For these two 10-year averages, the authors make the following prediction:
“… the initialised prediction indicates a slight cooling relative to 1994-2004 conditions”
Their graph shows this: temperatures in the two forecast intervals (green points shown at 2005 and 2010) are almost the same and are both lower than observed in 1994-2004 (the end of the red line in their graph).
 Keenlyside et al ’08” align = “left” width=90%/>
Figure 4 from Keenlyside et al ’08
The authors also make regional predictions, but naturally it was this global prediction that captivated most newspaper stories around the world (e.g. BBC News, Reuters, Bloomberg and so on), because of its seeming contradiction with global warming. The authors emphasise this aspect in their own media release, which was titled: Will Global Warming Take a Short Break?
That this cooling would just be a temporary blip and would change nothing about global warming goes without saying and has been amply discussed elsewhere (e.g. here). But another question has been rarely discussed: will this forecast turn out to be correct?
We think not – and we are prepared to bet serious money on this. We have double-checked with the authors: they say they really mean this as a serious forecast, not just as a methodological experiment. If the authors of the paper really believe that their forecast has a greater than 50% chance of being correct, then they should accept our offer of a bet; it should be easy money for them. If they do not accept our bet, then we must question how much faith they really have in their own forecast.
The bet we propose is very simple and concerns the specific global prediction in their Nature article. If the average temperature 2000-2010 (their first forecast) really turns out to be lower or equal to the average temperature 1994-2004 (*), we will pay them € 2500. If it turns out to be warmer, they pay us € 2500. This bet will be decided by the end of 2010. We offer the same for their second forecast: If 2005-2015 (*) turns out to be colder or equal compared to 1994-2004 (*), we will pay them € 2500 – if it turns out to be warmer, they pay us the same. The basis for the temperature comparison will be the HadCRUT3 global mean surface temperature data set used by the authors in their paper.
To be fair, the bet needs an escape clause in case a big volcano erupts or a big meteorite hits the Earth and causes cooling below the 1994-2004 level. In this eventuality, the forecast of Keenlyside et al. could not be verified any more, and the bet is off.
The bet would also need a neutral arbiter – we propose, for example, the director of the Hadley Centre, home of the data used by Keenlyside et al., or a committee of neutral colleagues. This neutral arbiter would also decide whether a volcano or meteorite impact event is large enough as to make the bet obsolete.
We will discuss the scientific reasons for our assessment here another time – first we want to hear from Keenlyside et al. whether they accept our bet. Our friendly challenge is out – we hope they will accept it in good sportsmanship.
(*) We adopt here the definition of the 10-year intervals as in their paper, which is from 1 November of the first year to 31 October of the last year. I.e.: 2000-2010 means 1 November 2000 until 31 October 2010.
Update: We have now published part 2 of this bet with our scientific arguments.
_______________________
Update: Andy Revkin has weighed in at “dot earth”.
Update 5/11/08: so has Anna Barnett at Nature’s ‘climate feedback’ blog
El enfriamiento global parece ser el sabor del mes. Primero, ha brotado una discusión descarriada en los medios de comunicación sobre si el calentamiento global se ha detenido, basándose en las temperaturas observadas en los pasados 8 años (ver nuestro correo aquí). Ahora hay una nueva discusión que está capturando la imaginación, basada en un grupo de científicos alemanes que predijeron una pausa en el calentamiento global la semana pasada en un artículo en la revista Nature (Keenlyside et al. 2008).
En dicho artículo se hacen dos pronósticos de temperaturas globales, y se discuten en los últimos párrafos y se muestran en la Figura 4 (ver abajo). El primer pronóstico se refiere a los años 2000-2010, mientras que el segundo se refiere a los años 2005-2015 (*). Los autores hacen las siguientes predicciones para estos dos intervalos promedio de diez años:
“la predicción inicial indica un leve enfriamiento con respecto a las condiciones en los años 1994-2004”
El gráfico muestra lo siguiente: Las temperaturas en los dos intervalos pronosticados (los puntos verdes muestran 2005 y 2010) son casi iguales y son ambas más bajas que las observadas en 1994-2004, correspondiente al final de la línea roja en el gráfico.
Keenlyside et al ’08” align = “left” width=90%/>
Figura 4 extraída del artículo de Keenlyside et al, 2008
Los autores también hacen pronósticos regionales, pero fue, naturalmente, el pronóstico global el que cautivó la mayoría de las historias en diarios alrededor del mundo (ej.: BBC Noticias http://www.nytimes.com/2008/05/01/science/earth/01climate.html?_r=1&>New%20York%20Times,%20¿El Calentamiento Global, se Tomará unas Cortas Vacaciones?
No es siquiera necesario explicar que este enfriamiento es solo un pequeño parpadeo y que no cambiará nada del calentamiento global. El tema ha sido ampliamente discutido en otros sitios (ej. aquí). Pero hay una pregunta que se ha discutido poco: ¿Será correcto el pronóstico?
Nosotros pensamos que no, y estamos dispuestos a apostar una importante suma de dinero por nuestra postura. Hemos verificado dos veces con los autores: ellos insisten en que su artículo es un pronóstico serio y que no se trata de un experimento metodológico. Si los autores realmente piensan que su pronóstico tiene una chance de ser correcta mayor al 50%, entonces deberían aceptar nuestra apuesta; sería una oportunidad de ganar dinero fácil. Si no aceptan nuestra apuesta, deberíamos cuestionar, entonces, cuanta fe realmente tienen en su pronóstico.
La apuesta que proponemos es muy simple y concierne su pronóstico específico en el artículo de la revista Nature. Si la temperatura promedio de 2000-2010 (su primer pronóstico) resulta ser más baja o igual que la temperatura promedio de 1994-2004 (*), les pagaremos € 2500. Si resulta ser más alta, ellos nos pagan € 2500 a nosotros. Esta apuesta será decidida a fines del 2010. Ofrecemos lo mismo para el segundo pronóstico: si la temperatura promedio de 2005-2015(*) resulta ser más baja o igual comparando con la temperatura promedio de 1994-2004(*) les pagaremos € 2500, si resulta ser más alta, ellos nos pagan a nosotros esa cifra. Tomaremos el HADCRUT3, conjunto de datos del promedio de la temperatura de superficie global, como base para comparar las temperaturas, que es la misma base de datos utilizada por los autores en el artículo.
Para ser justos, necesitaríamos una cláusula de salvaguardia, por si un gran volcán hace erupción o si un gran meteorito golpea la tierra y causa un enfriamiento menor al del promedio de 1994-2004. En este caso, el pronóstico de Keenlyside et al. no se podría verificar y por lo tanto la apuesta sería inválida.
La apuesta también tendría que tener un árbitro neutral, proponemos, por ejemplo, el director del Hadley Centre, donde se albergan los datos utilizados por Keenlyside et al., o un comité de colegas neutrales. Dicho árbitro neutral también decidirá si una eventual explosión volcánica o un impacto de meteorito son lo suficientemente grandes para invalidar la apuesta.
Discutiremos pronto las razones científicas de nuestra evaluación, primero queremos ver si Keenlyside et al. acepta nuestra apuesta. Nuestro amigable desafío ha sido propuesto y esperamos que sea aceptado con buen espíritu deportivo.
(*) Adoptamos aquí la misma definición de intervalos de 10 años que en su artículo, que va del 1 de noviembre del primer año al 31 de octubre del último año, ej.:2000-2010 significa 1 de noviembre de 2000 hasta 31 de octubre de 2010.
Actualización: Ya hemos publicado la segunda parte de esta apuesta con nuestros argumentos científicos.