This month’s open thread. We’re going to guess that most of what people want to talk about is related to the IPCC WG1 AR5 report… Have at it!
Climate Science
The new IPCC climate report
The time has come: the new IPCC report is here! After several years of work by over 800 scientists from around the world, and after days of extensive discussion at the IPCC plenary meeting in Stockholm, the Summary for Policymakers was formally adopted at 5 o’clock this morning. Congratulations to all the colleagues who were there and worked night shifts. The full text of the report will be available online beginning of next week. Realclimate summarizes the key findings and shows the most interesting graphs.
Update 29 Sept: Full (un-copyedited) report available here.
Global warming
It is now considered even more certain (> 95%) that human influence has been the dominant cause of the observed warming since the mid-20th century. Natural internal variability and natural external forcings (eg the sun) have contributed virtually nothing to the warming since 1950 – the share of these factors was narrowed down by IPCC to ± 0.1 degrees. The measured temperature evolution is shown in the following graph.
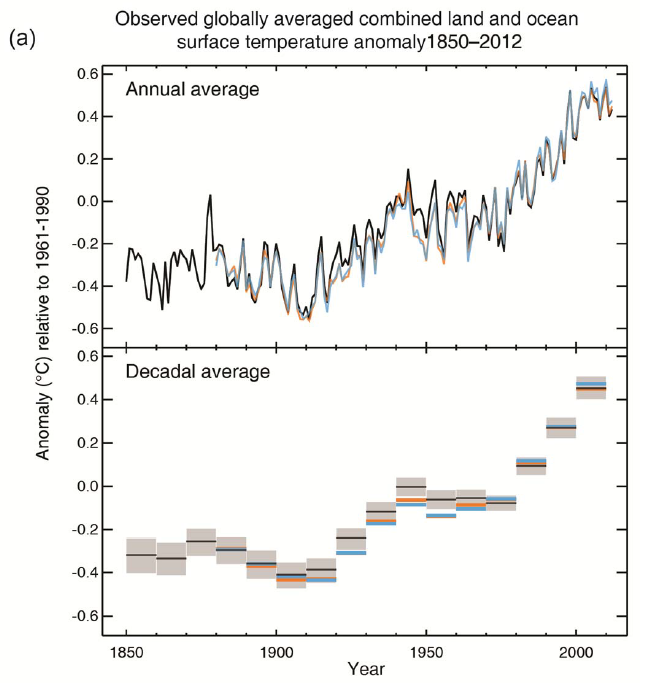
Figure 1 The measured global temperature curve from several data sets. Top: annual values. Bottom: averaged values over a decade.
[Read more…] about The new IPCC climate report
What ocean heating reveals about global warming
The heat content of the oceans is growing and growing. That means that the greenhouse effect has not taken a pause and the cold sun is not noticeably slowing global warming.
NOAA posts regularly updated measurements of the amount of heat stored in the bulk of the oceans. For the upper 2000 m (deeper than that not much happens) it looks like this:
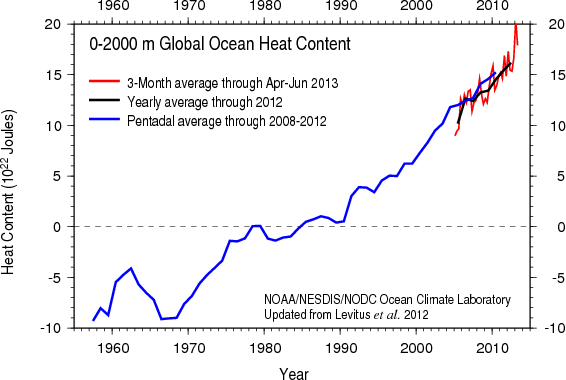
Change in the heat content in the upper 2000 m of the world’s oceans. Source: NOAA
[Read more…] about What ocean heating reveals about global warming
Paleoclimate: The End of the Holocene
Recently a group of researchers from Harvard and Oregon State University has published the first global temperature reconstruction for the last 11,000 years – that’s the whole Holocene (Marcott et al. 2013). The results are striking and worthy of further discussion, after the authors have already commented on their results in this blog.
[Read more…] about Paleoclimate: The End of the Holocene
On mismatches between models and observations
It is a truism that all models are wrong. Just as no map can capture the real landscape and no portrait the true self, numerical models by necessity have to contain approximations to the complexity of the real world and so can never be perfect replications of reality. Similarly, any specific observations are only partial reflections of what is actually happening and have multiple sources of error. It is therefore to be expected that there will be discrepancies between models and observations. However, why these arise and what one should conclude from them are interesting and more subtle than most people realise. Indeed, such discrepancies are the classic way we learn something new – and it often isn’t what people first thought of.
[Read more…] about On mismatches between models and observations
Unforced variations: Sept. 2013
This month’s open thread… Expect pre-IPCC report discussion (SPM due on Sep 27, full report (pre-copy-editing) Sep 30th), analysis of this years Arctic ice cover minimum, and a host of the usual distractions.
The inevitability of sea level rise
Guest post by Anders Levermann [via The Conversation]
![]()
Small numbers can imply big things. Global sea level rose by a little less than 0.2 metres during the 20th century – mainly in response to the 0.8 °C of warming humans have caused through greenhouse gas emissions. That might not look like something to worry about. But there is no doubt that for the next century, sea level will continue to rise substantially. The multi-billion-dollar question is: by how much? [Read more…] about The inevitability of sea level rise
Unforced variations: August 2013
This month’s open thread.
Since there are two main topics (Advocacy and Methane bombs) buzzing around the blogo-twitter-sphere this week, perhaps those are our starters for ten… (Feel free to populate the comments with links to various commentaries – we will chime in as we find time).
Arctic misrepresentations
At the weekend, Christopher Booker at the Daily Telegraph made another attempt (see previous) to downplay the obvious decreases in Arctic sea ice by (mis-)quoting a statement from Arctic oceanographer Ken Drinkwater and colleagues:
[Read more…] about Arctic misrepresentations
AGU Chapman Conference on Climate Science Communication
A couple of weeks ago, there was a small conference on Climate Science communication run by the AGU. Both Mike and I attended, but it was very notable that it wasn’t just scientists attending – there were also entertainers, psychologists, film-makers and historians. There were a lot of quite diverse perspectives and many discussions about the what’s, why’s and how’s of climate science communication.
There were a couple of notable features: the conference had a lively twitter hashtag (#climatechapman), and almost the entire proceedings were webcast live (schedule). The video from this has now been posted on YouTube in more bite-sized chunks.
While our own presentations (Mike here and Gavin here) are available, it is worth watching the presentations from people you might not have heard of, as well as a few from more established people. We’ll embed a few here, but please point out some of the other ones of interest in the comments.
[Read more…] about AGU Chapman Conference on Climate Science Communication