• Skip to primary navigation
  • Skip to main content
  • Skip to primary sidebar
  • Skip to footer

RealClimate

Climate science from climate scientists...

  • Start here
  • Model-Observation Comparisons
  • Miscellaneous Climate Graphics
  • Surface temperature graphics
You are here: Home / Archives for statistics

statistics

Rapid attribution of PNW heatwave

7 Jul 2021 by group

Summary: It was almost impossible for the temperatures seen recently in the Pacific North West heatwave to have occurred without global warming. And only improbable with it.

It’s been clear for at least a decade that global warming has been in general increasing the intensity of heat waves, with clear trends in observed maximum temperatures that match what climate models have been predicting. For the specific situation in the Pacific NorthWest at the end of June, we now have the first attribution analysis from the World Weather Attribution group – a consortium of climate experts from around the world working on extreme event attribution. Their preprint (Philip et al.) is available here.
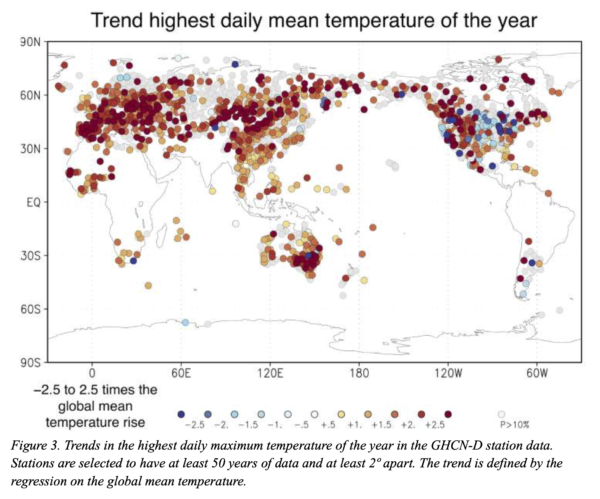
Trends in Tmax globally
[Read more…] about Rapid attribution of PNW heatwave

Filed Under: Climate impacts, Climate modelling, Climate Science, heatwaves, Instrumental Record, statistics

A potential rule of thumb for hourly rainfall?

20 Mar 2021 by rasmus

Future global warming will be accompanied by more intense rainfall and flash floods due to increased evaporation, as a consequence of higher surface temperatures which also lead to a higher turn-around rate for the global hydrological cycle. In other words, we will see changing rainfall patterns. And if the global area of rainfall also shrinks, then a higher regional concentration of the rainfall is bound to lead to more intense downpours (the global rainfall indicator is discussed here). 

[Read more…] about A potential rule of thumb for hourly rainfall?

Filed Under: Climate impacts, Climate Science, climate services, hydrological cycle, Solutions, statistics

Don’t climate bet against the house

3 Feb 2021 by Gavin

Decades ago (it seems) when perhaps it was still possible to have good faith disagreements about the attribution of current climate trends, James Annan wrote a post here summarizing the thinking and practice of Climate Betting. That led to spate of wagers on continued global warming (a summary of his bets through 2005 and attempts to set up others is here).

There were earlier bets, the most well known perhaps was the one for $100 between Hugh Ellsaesser and Jim Hansen in 1989 on whether there would be a new temperature record within three years. There was (1990), and Ellsaesser paid up in January 1991 (Kerr, 1991). But these more recent bets were more extensive.

[Read more…] about Don’t climate bet against the house

References

  1. R.A. Kerr, "Global Temperature Hits Record Again", Science, vol. 251, pp. 274-274, 1991. http://dx.doi.org/10.1126/science.251.4991.274

Filed Under: Arctic and Antarctic, Climate Science, Instrumental Record, skeptics, statistics

How good have climate models been at truly predicting the future?

4 Dec 2019 by Gavin

A new paper from Hausfather and colleagues (incl. me) has just been published with the most comprehensive assessment of climate model projections since the 1970s. Bottom line? Once you correct for small errors in the projected forcings, they did remarkably well.

[Read more…] about How good have climate models been at truly predicting the future?

Filed Under: Climate modelling, Climate Science, Greenhouse gases, Instrumental Record, Model-Obs Comparisons, statistics

Let’s check your temperature

26 Dec 2018 by rasmus

The underlying mission of my job is to safeguard lives and property through climate change adaptation based on science. In other words, to help society to prepare itself for risks connected with more extreme rainfall and temperatures.

For many people, “climate” may seem to be an abstract concept. I have had many conversations about climate, and then realised that people often have different interpretations. In my mind, climate is the same as weather statistics (which I realise can be quite abstract to many).

To avoid miscommunication, I want to make sure that we are on the same page when I discuss climate. Maybe it helps if I talk about more familiar and specific aspects, such as the temperature, rainfall, snow, or wind?

[Read more…] about Let’s check your temperature

Filed Under: Climate Science, climate services, Communicating Climate, statistics, Supplemental data

Model Independence Day

4 Jul 2018 by Gavin

We hold these truths to be self-evident, that all models are created equal, that they are endowed by their Creators with certain unalienable Rights, that among these are a DOI, Runability and Inclusion in the CMIP ensemble mean.

Well, not quite. But it is Independence Day in the US, and coincidentally there is a new discussion paper (Abramowitz et al) (direct link) posted on model independence just posted at Earth System Dynamics.

[Read more…] about Model Independence Day

References

  1. G. Abramowitz, N. Herger, E. Gutmann, D. Hammerling, R. Knutti, M. Leduc, R. Lorenz, R. Pincus, and G.A. Schmidt, "Model dependence in multi-model climate ensembles: weighting, sub-selection and out-of-sample testing", 2018. http://dx.doi.org/10.5194/esd-2018-51

Filed Under: Climate modelling, Climate Science, IPCC, statistics

Will climate change bring benefits from reduced cold-related mortality? Insights from the latest epidemiological research

11 Jun 2018 by Stefan

Guest post by Veronika Huber

Climate skeptics sometimes like to claim that although global warming will lead to more deaths from heat, it will overall save lives due to fewer deaths from cold. But is this true? Epidemiological studies suggest the opposite.

Mortality statistics generally show a distinct seasonality. More people die in the colder winter months than in the warmer summer months. In European countries, for example, the difference between the average number of deaths in winter (December – March) and in the remaining months of the year is 10% to 30%. Only a proportion of these winter excess deaths are directly related to low ambient temperatures (rather than other seasonal factors). Yet, it is reasonable to suspect that fewer people will die from cold as winters are getting milder with climate change. On the other hand, excess mortality from heat may also be high, with, for example, up to 70,000 additional deaths attributed to the 2003 summer heat wave in Europe. So, will the expected reduction in cold-related mortality be large enough to compensate for the equally anticipated increase in heat-related mortality under climate change? [Read more…] about Will climate change bring benefits from reduced cold-related mortality? Insights from the latest epidemiological research

Filed Under: Climate impacts, Climate Science, statistics

Climate indicators

6 May 2018 by rasmus

The climate system is complex, and a complete description of its state would require huge amounts of data. However, it is possible to keep track of its conditions through summary statistics.

There are some nice resources which give an overview of a number for climate indicators. Some examples include NASA and The Climate Reality Project.

The most common indicator is the atmospheric background CO2 concentration, the global mean temperature, the global mean sea level, and the area with snow or Arctic sea ice. Other indicators include rainfall statistics, drought indices, or other hydrological aspects. The EPA provides some examples.   

One challenge has been that the state of the hydrological cycle is not as easily summarised by one single index in the same way as the global mean temperature or the global mean sea level height. However, Giorgi et al. (2011) suggested a measure of hydro-climatic intensity (HY-INT) which is an integrated metric that captures the precipitation intensity as well as dry spell length.  

There are also global datasets of indices representing the more extreme aspects of climate called CLIMDEX, providing a list of 27 core climate extremes indices (so-called the ‘ETCCDI’ indices, referring to the ‘CCl/CLIVAR/JCOMM Expert Team on Climate Change Detection and Indices’).

In addition, there is a website hosted by the NOAA that presents various U.S. Climate Extremes Index (CEI) in an interactive way.

So there are quite a few indicators for various aspects of the climate. One question we should ask, however, is whether they capture all the important and relevant aspects of the climate. I think that they don’t, and that there are still some gaps.

[Read more…] about Climate indicators

References

  1. F. Giorgi, E. Im, E. Coppola, N.S. Diffenbaugh, X.J. Gao, L. Mariotti, and Y. Shi, "Higher Hydroclimatic Intensity with Global Warming", Journal of Climate, vol. 24, pp. 5309-5324, 2011. http://dx.doi.org/10.1175/2011JCLI3979.1

Filed Under: Climate impacts, Climate Science, Extras, hydrological cycle, statistics

Why extremes are expected to change with a global warming

5 Sep 2017 by rasmus

Joanna Walters links extreme weather events with climate change in a recent article in the Guardian, however, some  reservations have been expressed about such links in past discussions.

For example, we discussed the connection between single storms and global warming in the post Hurricanes and Global Warming – Is there a connection?, the World Meteorological Organization (WMO) has issued a statement, and Mike has recently explained the connection in the Guardian.

[Read more…] about Why extremes are expected to change with a global warming

Filed Under: Climate impacts, Climate Science, Hurricanes, hydrological cycle, IPCC, statistics

Observations, Reanalyses and the Elusive Absolute Global Mean Temperature

10 Aug 2017 by Gavin

One of the most common questions that arises from analyses of the global surface temperature data sets is why they are almost always plotted as anomalies and not as absolute temperatures.

There are two very basic answers: First, looking at changes in data gets rid of biases at individual stations that don’t change in time (such as station location), and second, for surface temperatures at least, the correlation scale for anomalies is much larger (100’s km) than for absolute temperatures. The combination of these factors means it’s much easier to interpolate anomalies and estimate the global mean, than it would be if you were averaging absolute temperatures. This was explained many years ago (and again here).

Of course, the absolute temperature does matter in many situations (the freezing point of ice, emitted radiation, convection, health and ecosystem impacts, etc.) and so it’s worth calculating as well – even at the global scale. However, and this is important, because of the biases and the difficulty in interpolating, the estimates of the global mean absolute temperature are not as accurate as the year to year changes.

This means we need to very careful in combining these two analyses – and unfortunately, historically, we haven’t been and that is a continuing problem.

[Read more…] about Observations, Reanalyses and the Elusive Absolute Global Mean Temperature

Filed Under: Climate modelling, Climate Science, Instrumental Record, Scientific practice, statistics

  • « Go to Previous Page
  • Page 1
  • Page 2
  • Page 3
  • Page 4
  • Go to Next Page »

Primary Sidebar

Search

Search for:

Email Notification

get new posts sent to you automatically (free)
Loading

Recent Posts

  • The most recent climate status
  • Unforced variations: May 2025
  • Unforced Variations: Apr 2025
  • WMO: Update on 2023/4 Anomalies
  • Andean glaciers have shrunk more than ever before in the entire Holocene
  • Climate change in Africa

Our Books

Book covers
This list of books since 2005 (in reverse chronological order) that we have been involved in, accompanied by the publisher’s official description, and some comments of independent reviewers of the work.
All Books >>

Recent Comments

  • Piotr on Unforced variations: May 2025
  • William on The most recent climate status
  • Mr. Know It All on Unforced variations: May 2025
  • Piotr on The most recent climate status
  • Nigelj on Unforced variations: May 2025
  • Kevin McKinney on Unforced variations: May 2025
  • Kevin McKinney on The most recent climate status
  • Kevin McKinney on The most recent climate status
  • Kevin McKinney on The most recent climate status
  • Mr. Know It All on The most recent climate status
  • K on Unforced variations: May 2025
  • Tomáš Kalisz on Unforced variations: May 2025
  • Tomáš Kalisz on Unforced variations: May 2025
  • Piotr on Unforced variations: May 2025
  • Piotr on Unforced variations: May 2025
  • Susan Anderson on Unforced variations: May 2025
  • Ken Towe on The most recent climate status
  • Keith Woollard on The most recent climate status
  • Dan on Unforced variations: May 2025
  • Nigelj on The most recent climate status

Footer

ABOUT

  • About
  • Translations
  • Privacy Policy
  • Contact Page
  • Login

DATA AND GRAPHICS

  • Data Sources
  • Model-Observation Comparisons
  • Surface temperature graphics
  • Miscellaneous Climate Graphics

INDEX

  • Acronym index
  • Index
  • Archives
  • Contributors

Realclimate Stats

1,365 posts

11 pages

243,163 comments

Copyright © 2025 · RealClimate is a commentary site on climate science by working climate scientists for the interested public and journalists.