• Skip to primary navigation
  • Skip to main content
  • Skip to primary sidebar
  • Skip to footer

RealClimate

Climate science from climate scientists...

  • Home
  • Start here
  • Contributors
  • Archives
You are here: Home / Search for "rahmstorf"

Search Results for: rahmstorf

Stefan Rahmstorf

6 Dec 2004 by Stefan

A physicist and oceanographer by training, Stefan Rahmstorf has moved from early work in general relativity theory to working on climate issues.

He has done research at the New Zealand Oceanographic Institute, at the Institute of Marine Science in Kiel and since 1996 at the Potsdam Institute for Climate Impact Research in Germany (in Potsdam near Berlin).

His work focuses on the role of ocean currents in climate change, past and present.

In 1999 Rahmstorf was awarded the $ 1 million Centennial Fellowship Award of the US-based James S. McDonnell foundation.

Since 2000 he teaches physics of the oceans as a professor at Potsdam University.

Rahmstorf is a member of the Academia Europaea and served from 2004-2013 in the German Advisory Council on Global Change (WBGU). He was also one of the lead authors of the 4th Assessment Report of the IPCC. In 2007 he became an Honorary Fellow of the University of Wales and in 2010 a Fellow of the American Geophysical Union.

More information about his research and publication record can be found here.

All posts by stefan.
Filed Under: Contributor Bio's

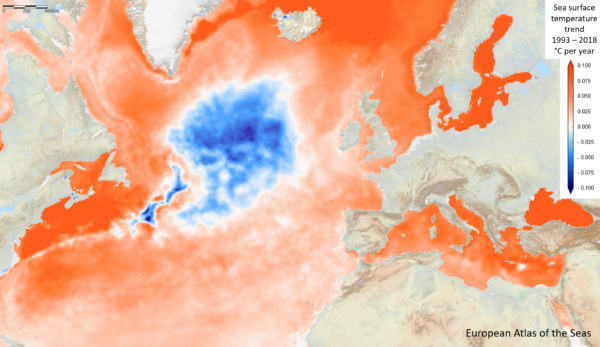
The water south of Greenland has been cooling, so what causes that?

17 Dec 2022 by Stefan

Sea surface temperature trend 1993 – 2018, from European Atlas of the Seas

Let’s compare two possibilities by a back-of-envelope calculation.

(1) Is it due to a reduced heat transport of the Atlantic Meridional Overturning Circulation (AMOC)?

(2) Or is it simply due to the influx of cold meltwater as the Greenland Ice Sheet is losing ice?

The latter is often suggested. The meltwater also contributes indirectly to slowing the AMOC, but not because it is cold but because it is freshwater (not saline), which contributes to the first option (i.e. AMOC decline).

AMOC heat transport

For that we take the AMOC flow rate times the temperature difference of 15 °C between the northward upper branch and southward deep return flow to obtain the heat transport.

17,000,000 m3/s x 15 K x 1025 kg/m3 x 4 kJ/kgK = 1 PW (1)

(Here, 1 PW = 1015 Watt and 4 kJ/kgK is the heat capacity of water.)

An AMOC weakening by 15 % thus cools the region at a rate of 0.15 PW = 1.5 x 10¹⁴ W and according to model simulations can fully explain the observed cooling trend (2). Of course, this slowdown is not only due to Greenland meltwater – other factors like increasing precipitation probably play a larger role, but the impact of Greenland melting is not negligible, as we argue in (3).

Greenland ice melt

Here we start by taking the Greenland mass loss rate into the ocean, times the temperature difference between the meltwater and the water it replaces. Note we are interested in the longer-term temperature trend over decades over the region with the meltwater properly mixed in, not at some temporary patches of meltwater floating locally at the surface.

Total Greenland mass loss has been on average 270 Gt/year for the last two decades (4).

Most of that evaporates though, and what ends up in the ocean of this, according to a recent study by Jason Box (5), is around 100 Gt/year, about 30% of which in form of ice and 70% in form of meltwater.

100 Gt/year = 3000 tons/second – that sounds a lot but the AMOC flow is more than 5000 times larger.

Assuming the ice and meltwater runoff occurs at 0 °C and replaces water that is 10 °C (a very high assumption corresponding to summer conditions and not the long-term average), the cooling rate is:

3,000,000 kg/s x 10 K x 4 kJ/kgK = 1.2 x 10¹¹ W

So in comparison, the cooling effect of a 15 % AMOC slowdown is over 1,000 times larger than the direct cooling effect of the Greenland meltwater.

For the part entering the ocean as ice, we must also consider that to melt ice requires energy. The heat of fusion of water is 334 kJ/kg so that adds 900 tons/s x 334 kJ/kg = 3 x 10¹¹ W.

So it turns out that those suggesting that ‘cold’ meltwater might cause the cold blob in the northern Atlantic are doubly wrong: if we talk about the direct impact of stuff coming off Greenland, than ice is the dominant factor and the energy that’s required to melt the ice. But both the direct effect of meltwater and of icebergs entering the ocean are completely dwarfed by the weakening of the AMOC (regardless of whether we take the numbers of Box et al. or other estimates). And Greenland’s contribution to that is not because the meltwater is ‘cold’, but because it is fresh – it contains no salt and dilutes the saltiness of the ocean water, thereby reducing its density.

As an additional observation: the cooling patch shown above often vanishes in summer, covered up by a warm surface layer – just when the Greenland melt season is on – only to resurface when deeper mixing starts in autumn. Which again supports the idea that it is not due to a direct effect of cold meltwater influx. Also compare the temperature change directly at the Greenland coast, where the meltwater enters, in the image above.

Finally, some have suggested that the cold blob south of Greenland has been caused by increased heat loss to the atmosphere. That of course is relevant for short-term weather variability – if a cold wind blows over the ocean it will of course cool the surface – but I do not think it can explain the long-term trend, as we discussed earlier here at Realclimate.

References

1.            Trenberth, K. E. & Fasullo, J. T. (2017) Atlantic meridional heat transports computed from balancing Earth’s energy locally, Geophys. Res. Let. 44: 1919-1927.

2.            Caesar, L., Rahmstorf, S., Robinson, A., Feulner, G., & Saba, V. (2018) Observed fingerprint of a weakening Atlantic Ocean overturning circulation, Nature 556: 191-196.

3.            Rahmstorf, S., J.E. Box, G. Feulner, M.E. Mann, A. Robinson, S. Rutherford, and E.J. Schaffernicht, 2015: Exceptional twentieth-century slowdown in Atlantic Ocean overturning circulation. Nature Climate Change, 5, 475–480, doi:10.1038/nclimate2554.

4.            NASA Vital Signs, https://climate.nasa.gov/vital-signs/ice-sheets/

5.            Box, J. E., et al. (2022), Greenland ice sheet climate disequilibrium and committed sea-level rise, Nature Clim. Change, 12(9), 808-813, doi: 10.1038/s41558-022-01

Filed Under: Climate Science

Sea level in the IPCC 6th assessment report (AR6)

13 Aug 2021 by Stefan

My top 3 impressions up-front:

  • The sea level projections for the year 2100 have been adjusted upwards again.
  • The IPCC has introduced a new high-end risk scenario, stating that a global rise “approaching 2 m by 2100 and 5 m by 2150 under a very high greenhouse gas emissions scenario cannot be ruled out due to deep uncertainty in ice sheet processes.”
  • The IPCC gives more consideration to the large long-term sea-level rise beyond the year 2100.

And here is the key sea-level graphic from the Summary for Policy Makers:

Source: IPCC AR6, Figure SPM.8

This is a pretty clear illustration of how sea level starts to rise slowly; but in the long run, sea-level rise caused by fossil-fuel burning and deforestation in our generation could literally go off the chart and inundate many coastal cities and wipe entire island nations off the map. But first things first.

Observed Past Rise

Let’s dive a little deeper into the full report and start with the observed sea level change. Since 1901 sea level has risen by 20 cm, a rise unprecedented in at least 3,000 years (disclosure: I co-authored some of the research behind the latter conclusion).

Source: IPCC AR6 Fig. 2.28b

Since 1900 the rise has greatly accelerated. During the most recent period analyzed, 2006-2018, it’s been rising at a rate of 3.7 mm/year – nearly three times as fast as during 1901-1971 (1.3 mm/year). The IPCC calls this a “robust acceleration (high confidence) of global mean sea level rise over the 20th century”, as did the SROCC in 2019.

The finding of sea-level acceleration is not new. The AR4 already concluded in 2007: “There is high confidence that the rate of sea level rise has increased between the mid-19th and the mid-20th centuries.” And the AR5 found in 2013 that “there is high confidence that the rate of sea level rise has increased during the last two centuries, and it is likely that global mean sea level has accelerated since the early 1900’s.” (Which has not stopped “climate skeptics” from repeatedly claiming a lack of acceleration.)

Source: IPCC AR6 Fig. 2.28c

The reason for earlier hedged wording by the IPCC was the possibility of natural decadal variability affecting the trend estimates, but the AR6 now concludes “that the main driver of the observed global mean sea-level rise since at least 1970 is very likely anthropogenic forcing”. That is the result of so-called “attribution studies” – attempts to differentiate with the help of a combination of data, models, pattern detection and statistics between all possible human-caused and natural factors in the observed changes. However, on the level of basic physical reasoning, it is of course a no-brainer that warming will cause land-ice to melt (and melt faster as it gets hotter) and ocean waters to expand, so sea-level rise is the inevitable result.

And there is this:

New observational evidence leads to an assessed sea level rise over the period 1901 to 2018 that is consistent with the sum of individual components contributing to sea level rise, including expansion due to ocean warming and melting of glaciers and ice sheets (high confidence).

IPCC AR6

That’s an important consistency check; the independent data add up to the overall observed rise.

The Future Until 2100

It is virtually certain that global mean sea level will continue to rise over the 21st century in response to continued warming of the climate system.

IPCC AR6

By how much? That depends on our emissions and is shown in the following figure. The take-away message is: for high emissions we’d likely get close to a meter, sticking to the Paris agreement would cut that down to half a meter.

Source: IPCC AR6, Figure SPM.8

And how does that compare to the recent previous reports? Here is the comparison the IPCC shows:

Projections of global mean sea level for 2050 (left) and 2100 (right). The different colours and boxes represent three emissions scenarios: RCP8.5/SSP5-8.5 (red), RCP4.5/SSP2-4.5 (light blue/yellow) and RCP2.6/SSP1-2.6 (dark blue). Projections are given for AR6, SROCC, AR5, a survey of 106 experts (Survey), structured expert judgment (SEJ), models including marine ice cliff instability (MICI) and projections including only medium-confidence processes (MED). Source: IPCC (2021) Figure 9.25.

If you look at the 2100 projections for the last three reports (AR5, SROCC, AR6) you can see that the numbers have increased each time – and remember that the AR5 numbers had already increased by ~60% compared to the AR4. This illustrates the fact that IPCC has been too “cautious” in the past (which is not a virtue in risk assessment), having to correct itself upward again and again (all the while “climate skeptics” try to paint the IPCC as “alarmist”, for want of any better arguments to play down the climate crisis).

Related to that are notable changes in grappling with uncertainty and risk. The IPCC is now showing very likely (5-95 percentile) as well as likely (17-83 percentile) ranges. In the AR5, it had made the rather ad-hoc argument that “global mean sea level rise is likely (medium confidence) to be in the 5 to 95% range of projections from proces-based models”. So their likely range was actually the modelled very likely range.

The IPCC now splits the uncertainty into two types, hence the two different shadings in the uncertainty bars, in an attempt to also cover uncertainty in processes which we still cannot confidently model. They write:

Importantly, likely range projections do not include those ice-sheet-related processes whose quantification is highly uncertain or that are characterized by deep uncertainty. Higher amounts of global mean sea level rise before 2100 could be caused by earlier-than-projected disintegration of marine ice shelves, the abrupt, widespread onset of Marine Ice Sheet Instability (MISI) and Marine Ice Cliff Instability (MICI) around Antarctica, and faster-than-projected changes in the surface mass balance and dynamical ice loss from Greenland. In a low-likelihood, high-impact storyline and a high CO2 emissions scenario, such processes could in combination contribute more than one additional meter of sea level rise by 2100.

Note that this uncertainty goes to one side: up. For estimating this uncertainty they use an expert survey as well as a smaller but more detailed structured expert judgement. I co-authored the survey (see also 7-minute video about it) with Ben Horton and others, as well as a predecessor survey published in 2014, and I am happy to see that the IPCC now includes this type of expert judgement to assess risks that can’t yet be modelled reliably, but cannot be just ignored either. In dealing with the climate crisis, it simply is not enough to consider what is likely to happen – it is even more important to understand what the risks are.

Think about it: If someone builds a nuclear facility near to your house, would you be satisfied with knowing that it is “likely” to work well (say, 83% certain)? Or would you like to know about a few percent chance that it could blow up like Chernobyl in your lifetime?

With the high-end risk scenarios, the IPCC is catching up with other assessments such as the US National Climate Assessment of 2017, which already showed a “high” scenario of 2 meters and an “extreme” scenario of 2.5 meters of rise by 2100.

The Long Term Future

One of the headline statements of the AR6 is:

Many changes due to past and future greenhouse gas emissions are irreversible for centuries to millennia, especially changes in the ocean, ice sheets and global sea level.

IPCC AR6

That’s because huge ice sheets take a long time to melt in a warmer climate, and the ocean waters take a long time to warm up as you go further down, away from the surface. So by what we are doing now in the next couple of decades we determine the rate and amount of sea-level rise for millennia to come, condemning many generations to continually changing coastlines and forcing them to abandon many coastal cities, large and small. That we cannot turn this back is the reason why the precautionary principle should be applied to the climate crisis.

Just look at the ranges expected by the year 2300, in the right-hand panel of the first image above. Even in the blue mitigation scenario, which limits warming to well below 2 °C, our descendants may well have to deal with 2-3 meters of sea-level rise, which would be catastrophic for the people living at the world’s coastlines. Not only would it be extremely hard and costly – if possible at all – to defend cities like New York during a storm surge with a so much higher sea level. We would see massive coastal erosion happening all around. And remember that “nuisance flooding” is already causing real problems after just 20 cm of sea-level rise, for example along the eastern seaboard of the US!

At least with this Paris scenario and a good portion of sheer luck, we may get away with less than a meter rise. But with further unmitigated increase in emissions, a desastrous 2 meter rise is about as likely as an utterly devastating 7 meter rise. What would our descendants think we were doing?

Filed Under: Climate Science

Should the official Atlantic hurricane season be lengthened?

2 Apr 2021 by Jim Kossin

By Jim Kossin, Tim Hall, Mike Mann, and Stefan Rahmstorf

The 2020 Atlantic hurricane season broke a number of records, with the formation of an unprecedented 30 “named storms” (storms that reach wind-speed intensity of at least 18 m/s and are then given an official name). The season also started earlier than normal. In fact, when ranked by their order in the season, the date of formation of every named storm, from Tropical Storm Arthur to Hurricane Iota was substantially earlier than normal (Fig. 1).

Fig. 1 Average number of named storms by day of the year in the historical record from 1851–2019 (dark blue line). The light blue shading denotes the range between the minimum and maximum number of storms observed by each day. The days of formation for the 2020 named storms are shown by the red squares.
[Read more…] about Should the official Atlantic hurricane season be lengthened?

Filed Under: Climate Science, Hurricanes, Instrumental Record

Climate Change and Extreme Summer Weather Events – The Future is still in Our Hands

31 Oct 2018 by mike


Summer 2018 saw an unprecedented spate of extreme weather events, from the floods in Japan, to the record heat waves across North America, Europe and Asia, to wildfires that threatened Greece and even parts of the Arctic. The heat and drought in the western U.S. culminated in the worst California wildfire on record. This is the face of climate change, I commented at the time.

Some of the connections with climate change here are pretty straightforward. One of the simplest relationships in all of atmospheric science tells us that the atmosphere holds exponentially more moisture as temperatures increase. Increased moisture means potentially for greater amounts of rainfall in short periods of time, i.e. worse floods. The same thermodynamic relationship, ironically, also explains why soils evaporate exponentially more moisture as ground temperatures increase, favoring more extreme drought in many regions. Summer heat waves increase in frequency and intensity with even modest (e.g. the observed roughly 2F) overall warming owing to the behavior of the positive “tail” of the bell curve when you shift the center of the curve even a small amount. Combine extreme heat and drought and you get more massive, faster-spreading wildfires. It’s not rocket science.

But there is more to the story. Because what made these events so devastating was not just the extreme nature of the meteorological episodes but their persistence. When a low-pressure center stalls and lingers over the same location for days at a time, you get record accumulation of rainfall and unprecedented flooding. That’s what happened with Hurricane Harvey last year and Hurricane Florence this year. It is also what happened with the floods in Japan earlier this summer and the record summer rainfall we experienced this summer here in Pennsylvania. Conversely, when a high-pressure center stalls over the same location, as happened in California, Europe, Asia and even up into the European Arctic this past summer, you get record heat, drought and wildfires.

Scientists such as Jennifer Francis have linked climate change to an increase in extreme weather events, especially during the winter season when the jet stream and “polar vortex” are relatively strong and energetic. The northern hemisphere jet stream owes its existence to the steep contrast in temperature in the middle latitudes (centered around 45N) between the warm equator and the cold Arctic. Since the Arctic is warming faster than the rest of the planet due to the melting of ice and other factors that amplify polar warming, that contrast is decreasing and the jet stream is getting slower. Just like a river traveling over gently sloping territory tends to exhibit wide meanders as it snakes its way toward the ocean, so too do the eastward-migrating wiggles in the jet stream (known as Rossby waves) tend to get larger in amplitude when the temperature contrast decreases. The larger the wiggles in the jet stream the more extreme the weather, with the peaks corresponding to high pressure at the surface and the troughs low pressure at the surface. The slower the jet stream, the longer these extremes in weather linger in the same locations, giving us more persistent weather extremes.

Something else happens in addition during summer, when the poleward temperature contrast is especially weak. The atmosphere can behave like a “wave guide”, trapping the shorter wavelength Rossby waves (those that that can fit 6 to 8 full wavelengths in a complete circuit around the Northern Hemisphere) to a relatively narrow range of latitudes centered in the mid-latitudes, preventing them from radiating energy away toward lower and higher latitudes. That allows the generally weak disturbances in this wavelength range to intensify through the physical process of resonance, yielding very large peaks and troughs at the sub-continental scale, i.e. unusually extreme regional weather anomalies. The phenomenon is known as Quasi-Resonant Amplification or “QRA”, and (see Figure below).

Many of the most damaging extreme summer weather events in recent decades have been associated with QRA, including the 2003 European heatwave, the 2010 Russian heatwave and wildfires and Pakistan floods (see below), and the 2011 Texas/Oklahoma droughts. More recent examples include the 2013 European floods, the 2015 California wildfires, the 2016 Alberta wildfires and, indeed, the unprecedented array of extreme summer weather events we witnessed this past summer.

The increase in the frequency of these events over time is seen to coincide with an index of Arctic amplification (the difference between warming in the Arctic and the rest of the Northern Hemisphere), suggestive of a connection (see Figure below).

Last year we (me and a team of collaborators including RealClimate colleague Stefan Rahmstorf) published an article in the Nature journal Scientific Reports demonstrating that the same pattern of amplified Arctic warming (“Arctic Amplification”) that is slowing down the jet stream is indeed also increasing the frequency of QRA episodes. That means regional weather extremes that persist longer during summer when the jet stream is already at its weakest. Based on an analysis of climate observations and historical climate simulations, we concluded that the “signal” of human influence on QRA has likely emerged from the “noise” of natural variability over the past decade and a half. In summer 2018, I would argue, that signal was no longer subtle. It played out in real time on our television screens and newspaper headlines in the form of an unprecedented hemisphere-wide pattern of extreme floods, droughts, heat waves and wildfires.

In a follow-up article just published in the AAAS journal Science Advances, we look at future projections of QRA using state-of-the-art climate model simulations. It is important to note that that one cannot directly analyze QRA behavior in a climate model simulation for technical reasons. Most climate models are run at grid resolutions of a degree in latitude or more. The physics that characterizes QRA behavior of Rossby Waves faces a stiff challenge when it comes to climate models because it involves the second mathematical derivative of the jet stream wind with respect to latitude. Errors increase dramatically when you calculate a numerical first derivative from gridded fields and even more so when you calculate a second derivative. Our calculations show that the critical term mentioned above suffers from an average climate model error of more than 300% relative to observations. By contrast, the average error of the models is less than a percent when it comes to latitudinal temperature averages and still only about 30% when it comes to the latitudinal derivative of temperature.

That last quantity is especially relevant because QRA events have been shown to have a well-defined signature in terms of the latitudinal variation in temperature in the lower atmosphere. Through a well-established meteorological relationship known as the thermal wind, the magnitude of the jet stream winds is in fact largely determined by the average of that quantity over the lower atmosphere. And as we have seen above, this quantity is well captured by the models (in large part because the change in temperature with latitude and how it responds to increasing greenhouse gas concentrations depends on physics that are well understood and well represented by the climate models).

These findings, incidentally have broader implications. First of all, climate model-based studies used to assess the degree to which current extreme weather events can be attributed to climate change are likely underestimating the climate change influence. One model-based study for example suggested that climate change only doubled the likelihood of the extreme European heat wave this summer. As I commented at the time, that estimate is likely too low for it doesn’t account for the role that we happen to know, in this case, that QRA played in that event. Similarly, climate models used to project future changes in extreme weather behavior likely underestimate the impact that future climate changes could have on the incidence of persistent summer weather extremes like those we witnessed this past summer.

So what does our study have to say about the future? We find that the incidence of QRA events would likely continue to increase at the same rate it has in recent decades if we continue to simply add carbon dioxide to the atmosphere. But there’s a catch: The future emissions scenarios used in making future climate projections must also account for factors other than greenhouse gases. Historically, for example, the use of old coal technology that predates the clean air acts produced sulphur dioxide gas which escapes into the atmosphere where it reacts with other atmospheric constituents to form what are known as aerosols.

These aerosols caused acid rain and other environmental problems in the U.S. before factories in the 1970s were required to install “scrubbers” to remove the sulphur dioxide before it leaves factory smokestacks. These aerosols also reflect incoming sunlight and so have a cooling effect on the surface in the industrial middle-latitudes where they are produced. Some countries, like China, are still engaged in the older, dirtier-form of coal burning. If we continue with business-as-usual burning of fossil fuels, but countries like China transition to more modern “cleaner” coal burning to avoid air pollution problems, we are likely to see a substantial drop in aerosols over the next half century. Such an assumption is made in the Intergovernmental Panel on Climate Change (IPCC)’s “RCP 8.5” scenario—basically, a “business as usual” future emissions scenario which results in more than a tripling of carbon dioxide concentrations relative to pre-industrial levels (280 parts per million) and roughly 4-5C (7-9F) of planetary warming by the end of the century.

As a result, the projected disappearance of cooling aerosols in the decades ahead produces an especially large amount of warming in middle-latitudes in summer (when there is the most incoming sunlight to begin with, and, thus, the most sunlight to reflect back to space). Averaged across the various IPCC climate models there is even more warming in mid-latitudes than in the Arctic—in other words, the opposite of Arctic Amplification i.e. Arctic De-amplification (see Figure below). Later in the century after the aerosols disappear greenhouse warming once again dominates and we again see an increase in QRA events.

So, is there any hope to avoid future summers like the summer of 2018? Probably not. But in the scenario where we rapidly move away from fossil fuels and stabilize greenhouse gas concentrations below 450 parts per million, giving us a roughly 50% chance of averting 2C/3.6F planetary warming (the so-called “RCP 2.6” IPCC scenario) we find that the frequency of QRA events remains roughly constant at current levels.

While we will presumably have to contend with many more summers like 2018 in the future, we could likely prevent any further increase in persistent summer weather extremes. In other words, the future is still very much in our hands when it comes to dangerous and damaging summer weather extremes. It’s simply a matter of our willpower to transition quickly from fossil fuels to renewable energy.

Filed Under: Aerosols, Arctic and Antarctic, Climate impacts, Climate Science, Greenhouse gases, heatwaves Tagged With: aerosols, Arctic amplification, climate change, greenhouse warming, weather extremes

Does a slow AMOC increase the rate of global warming?

18 Jul 2018 by Stefan

Established understanding of the AMOC (sometimes popularly called Gulf Stream System) says that a weaker AMOC leads to a slightly cooler global mean surface temperature due to changes in ocean heat storage. But now, a new paper in Nature claims the opposite and even predicts a phase of rapid global warming. What’s the story?

By Stefan Rahmstorf and Michael Mann

In 1751, the captain of an English slave-trading ship made a historic discovery. While sailing at latitude 25°N in the subtropical North Atlantic Ocean, Captain Henry Ellis lowered a “bucket sea-gauge” down through the warm surface waters into the deep. By means of a long rope and a system of valves, water from various depths could be brought up to the deck, where its temperature was read from a built-in thermometer. To his surprise Captain Ellis found that the deep water was icy cold.

These were the first ever recorded temperature measurements of the deep ocean. And they revealed what is now known to be a fundamental feature of all the world oceans: deep water is always cold. The warm waters of the tropics and subtropics are confined to a thin layer at the surface; the heat of the sun does not slowly warm up the depths as might be expected. Ellis wrote:

“This experiment, which seem’d at first but mere food for curiosity, became in the interim very useful to us. By its means we supplied our cold bath, and cooled our wines or water at pleasure; which is vastly agreeable to us in this burning climate.”

[Read more…] about Does a slow AMOC increase the rate of global warming?

Filed Under: Arctic and Antarctic, Climate Science, El Nino, Hurricanes, Oceans

Does global warming make tropical cyclones stronger?

30 May 2018 by Stefan

By Stefan Rahmstorf, Kerry Emanuel, Mike Mann and Jim Kossin

Friday marks the official start of the Atlantic hurricane season, which will be watched with interest after last year’s season broke a number of records and e.g. devastated Puerto Rico’s power grid, causing serious problems that persist today. One of us (Mike) is part of a team that has issued a seasonal forecast (see Kozar et al 2012) calling for a roughly average season in terms of overall activity (10 +/- 3 named storms), with tropical Atlantic warmth constituting a favorable factor, but predicted El Nino conditions an unfavorable factor.  Meanwhile, the first named storm, Alberto, has gone ahead without waiting for the official start of the season.

In the long term, whether we will see fewer or more tropical cyclones in the Atlantic or in other basins as a consequence of anthropogenic climate change is still much-debated. There is a mounting consensus, however, that we will see more intense hurricanes. So let us revisit the question of whether global warming is leading to more intense tropical storms. Let’s take a step back and look at this issue globally, not just for the Atlantic. [Read more…] about Does global warming make tropical cyclones stronger?

Filed Under: Climate Science, Hurricanes, Oceans

Stronger evidence for a weaker Atlantic overturning circulation

11 Apr 2018 by Stefan

Through two new studies in Nature, the weakening of the Gulf Stream System is back in the scientific headlines. But even before that, interesting new papers have been published – high time for an update on this topic.

Let’s start with tomorrow’s issue of Nature, which besides the two new studies (one of which I was involved in) also includes a News&Views commentary. Everything revolves around the question of whether the Gulf Stream System has already weakened. Climate models predict this will be one consequence of global warming – alongside other problems such as rising sea levels and increasing heat waves, droughts and extreme precipitation. But is such a slowdown already underway today? This question is easier asked than answered. The Atlantic Meridional Overturning Circulation (AMOC, also known as Gulf Stream System) is a huge, three-dimensional flow system throughout the Atlantic, which fluctuates on different time scales. It is therefore by no means enough to put a current meter in the water at one or two points. [Read more…] about Stronger evidence for a weaker Atlantic overturning circulation

Filed Under: Climate impacts, Climate Science, Instrumental Record, Oceans, Paleoclimate

El Niño and the record years 1998 and 2016

4 Nov 2017 by Stefan

2017 is set to be one of warmest years on record. Gavin has been making regular forecasts of where 2017 will end up, and it is now set to be #2 or #3 in the list of hottest years:

With update thru September, ~80% chance of 2017 being 2nd warmest yr in the GISTEMP analysis (~20% for 3rd warmest). pic.twitter.com/k3CEM9rGHY

— Gavin Schmidt (@ClimateOfGavin) October 17, 2017

In either case it will be the warmest year on record that was not boosted by El Niño. I’ve been asked several times whether that is surprising. After all, the El Niño event, which pushed up the 2016 temperature, is well behind us. El Niño conditions prevailed in the tropical Pacific from October 2014 throughout 2015 and in the first half of 2016, giving way to a cold La Niña event in the latter half of 2016. (Note that global temperature lags El Niño variations by several months so this La Niña should have cooled 2017.) [Read more…] about El Niño and the record years 1998 and 2016

Filed Under: Climate Science, El Nino

The climate has always changed. What do you conclude?

20 Jul 2017 by Stefan

Probably everyone has heard this argument, presented as objection against the findings of climate scientists on global warming: “The climate has always changed!” And it is true: climate has changed even before humans began to burn fossil fuels. So what can we conclude from that?

A quick quiz

Do you conclude…

(1) that humans cannot change the climate?

(2) that we do not know whether humans are to blame for global warming?

(3) that global warming will not have any severe consequences?

(4) that we cannot stop global warming? [Read more…] about The climate has always changed. What do you conclude?

Filed Under: Climate Science, Communicating Climate, Paleoclimate, skeptics

  • Go to page 1
  • Go to page 2
  • Go to page 3
  • Interim pages omitted …
  • Go to page 10
  • Go to Next Page »

Primary Sidebar

Email Notification

get new posts sent to you automatically (free)
Loading

Recent Posts

  • Some new CMIP6 MSU comparisons
  • How not to science
  • Unforced variations: March 2023
  • The established ground and new ideas
  • 2022 updates to model-observation comparisons
  • Unforced variations: Feb 2023

Our Books

Book covers
This list of books since 2005 (in reverse chronological order) that we have been involved in, accompanied by the publisher’s official description, and some comments of independent reviewers of the work.
All Books >>

Recent Comments

  • JCM on Unforced variations: March 2023
  • jgnfld on Unforced variations: March 2023
  • Killian on Unforced variations: March 2023
  • zebra on Unforced variations: March 2023
  • macias shurly on Unforced variations: March 2023
  • Carbomontanus on Unforced variations: March 2023
  • jgnfld on Unforced variations: March 2023
  • Geoff Miell on Unforced variations: March 2023
  • Carbomontanus on Unforced variations: March 2023
  • Victor on Unforced variations: March 2023
  • David on Some new CMIP6 MSU comparisons
  • Carbomontanus on Unforced variations: March 2023

Footer

ABOUT

  • About
  • Translations
  • Privacy Policy
  • Contact Page
  • Login

DATA

  • Data Sources
  • Climate model projections compared to observations

INDEX

  • Acronym index
  • Index

Realclimate Stats

1,296 posts

8 pages

230,153 comments

Copyright © 2023 · RealClimate is a commentary site on climate science by working climate scientists for the interested public and journalists.