In the Northern Hemisphere, the late 20th / early 21st century has been the hottest time period in the last 400 years at very high confidence, and likely in the last 1000 – 2000 years (or more). It has been unclear whether this is also true in the Southern Hemisphere. Three studies out this week shed considerable new light on this question. This post provides just brief summaries; we’ll have more to say about these studies in the coming weeks. [Read more…] about Fresh hockey sticks from the Southern Hemisphere
Arctic and Antarctic
Unlocking the secrets to ending an Ice Age
Guest Commentary by Chris Colose, SUNY Albany
It has long been known that characteristics of the Earth’s orbit (its eccentricity, the degree to which it is tilted, and its “wobble”) are slightly altered on timescales of tens to hundreds of thousands of years. Such variations, collectively known as Milankovitch cycles, conspire to pace the timing of glacial-to-interglacial variations.
Despite the immense explanatory power that this hypothesis has provided, some big questions still remain. For one, the relative roles of eccentricity, obliquity, and precession in controlling glacial onsets/terminations are still debated. While the local, seasonal climate forcing by the Milankovitch cycles is large (of the order 30 W/m2), the net forcing provided by Milankovitch is close to zero in the global mean, requiring other radiative terms (like albedo or greenhouse gas anomalies) to force global-mean temperature change.
The last deglaciation occurred as a long process between peak glacial conditions (from ~26-20,000 years ago) to the Holocene (~10,000 years ago). Explaining this evolution is not trivial. Variations in the orbit cause opposite changes in the intensity of solar radiation during the summer between the Northern and Southern hemisphere, yet ice age terminations seem synchronous between hemispheres. This could be explained by the role of the greenhouse gas CO2, which varies in abundance in the atmosphere in sync with the glacial cycles and thus acts as a “globaliser” of glacial cycles, as it is well-mixed throughout the atmosphere. However, if CO2 plays this role it is surprising that climatic proxies indicate that Antarctica seems to have warmed prior to the Northern Hemisphere, yet glacial cycles follow in phase with Northern insolation (“INcoming SOLar radiATION”) patterns, raising questions as to what communication mechanism links the hemispheres.
There have been multiple hypotheses to explain this apparent paradox. One is that the length of the austral summer co-varies with boreal summer intensity, such that local insolation forcings could result in synchronous deglaciations in each hemisphere (Huybers and Denton, 2008). A related idea is that austral spring insolation co-varies with summer duration, and could have forced sea ice retreat in the Southern Ocean and greenhouse gas feedbacks (e.g., Stott et al., 2007).
Based on transient climate model simulations of glacial-interglacial transitions (rather than “snapshots” of different modeled climate states), Ganopolski and Roche (2009) proposed that in addition to CO2, changes in ocean heat transport provide a critical link between northern and southern hemispheres, able to explain the apparent lag of CO2 behind Antarctic temperature. Recently, an elaborate data analysis published in Nature by Shakun et al., 2012 (pdf) has provided strong support for these model predictions. Shakun et al. attempt to interrogate the spatial and temporal patterns associated with the last deglaciation; in doing so, they analyze global-scale patterns (not just records from Antarctica). This is a formidable task, given the need to synchronize many marine, terrestrial, and ice core records.
[Read more…] about Unlocking the secrets to ending an Ice Age
References
- P. Huybers, and G. Denton, "Antarctic temperature at orbital timescales controlled by local summer duration", Nature Geoscience, vol. 1, pp. 787-792, 2008. http://dx.doi.org/10.1038/ngeo311
- L. Stott, A. Timmermann, and R. Thunell, "Southern Hemisphere and Deep-Sea Warming Led Deglacial Atmospheric CO 2 Rise and Tropical Warming", Science, vol. 318, pp. 435-438, 2007. http://dx.doi.org/10.1126/science.1143791
- A. Ganopolski, and D.M. Roche, "On the nature of lead–lag relationships during glacial–interglacial climate transitions", Quaternary Science Reviews, vol. 28, pp. 3361-3378, 2009. http://dx.doi.org/10.1016/j.quascirev.2009.09.019
- J.D. Shakun, P.U. Clark, F. He, S.A. Marcott, A.C. Mix, Z. Liu, B. Otto-Bliesner, A. Schmittner, and E. Bard, "Global warming preceded by increasing carbon dioxide concentrations during the last deglaciation", Nature, vol. 484, pp. 49-54, 2012. http://dx.doi.org/10.1038/nature10915
Arctic Sea Ice Volume: PIOMAS, Prediction, and the Perils of Extrapolation
Guest Commentary by Axel Schweiger, Ron Lindsay, and Cecilia Bitz
We have just passed the annual maximum in Arctic sea ice extent which always occurs sometime in March. Within a month we will reach the annual maximum in Arctic sea ice volume. After that, the sea ice will begin its course towards its annual minimum of both extent and volume in mid-September. This marks the beginning of the ritual of the annual sea ice watch that includes predictions of the extent and rank of this year’s sea ice minimum, as well as discussion about the timing of its eventual demise. One of the inputs into that discussion is the “PIOMAS” ice-ocean model output of ice volume – and in particular, some high-profile extrapolations. This is worth looking at in some detail.
[Read more…] about Arctic Sea Ice Volume: PIOMAS, Prediction, and the Perils of Extrapolation
An Arctic methane worst-case scenario
Let’s suppose that the Arctic started to degas methane 100 times faster than it is today. I just made that number up trying to come up with a blow-the-doors-off surprise, something like the ozone hole. We ran the numbers to get an idea of how the climate impact of an Arctic Methane Nasty Surprise would stack up to that from Business-as-Usual rising CO2
Curve-fitting and natural cycles: The best part

It is not every day that I come across a scientific publication that so totally goes against my perception of what science is all about. Humlum et al., 2011 present a study in the journal Global and Planetary Change, claiming that most of the temperature changes that we have seen so far are due to natural cycles.
They claim to present a new technique to identify the character of natural climate variations, and from this, to produce a testable forecast of future climate. They project that
the observed late 20th century warming in Svalbard is not going to continue for the next 20–25 years. Instead the period of warming may be followed by variable, but generally not higher temperatures for at least the next 20–25 years.
However, their claims of novelty are overblown, and their projection is demonstrably unsound.
[Read more…] about Curve-fitting and natural cycles: The best part
References
- O. Humlum, J. Solheim, and K. Stordahl, "Identifying natural contributions to late Holocene climate change", Global and Planetary Change, vol. 79, pp. 145-156, 2011. http://dx.doi.org/10.1016/j.gloplacha.2011.09.005
Times Atlas map of Greenland to be corrected
We were pleased to hear from the University of Arizona’s Jeff Kargel that the Times Atlas folks are now updating their atlas of Greenland. As we reported earlier, the first edition was completely in error, and led to some rather bizarre claims about the amount of ice loss in Greenland. Kargel reports that HarperCollins (publisher of the Times Atlas) has now fully retracted their error and has produced a new map of Greenland that will be made available as a large-format, 2-side map insert for the Atlas and will also be available free online. Meanwhile, Kargel and colleagues have produced their own updated small-scale map and have written a paper that includes both their new map and a description of the incident that led up to it. Kargel was instrumental in pushing the cryosphere community to send a strong message to the publishers that they needed to correct their mistake. (A pre-print of the paper, currently under review and under public discussion on Cryolist, is available here.)
 Figure 1 in Kargel et al. (2011) generated by a collaboration of the Geological Survey of Denmark and Greenland (GEUS) and the Programme for Monitoring of the Greenland Ice Sheet (PROMICE) with the Polar Geospatial Center Department of Geology and Geophysics, University of Minnesota. Contact: Michele Citterio (GEUS) for questions about the glacier outlines or Paul Morin (UMinn.) for questions about the MODIS base image mosaic.
HarperCollins is to be commended for listening to the scientific community and producing a corrected map. Unfortunately, and despite recent events demonstrating that popular allegations against climate scientists are all wrong, HarperCollins still says on their web site that it’s all the scientists’ fault for not being clear (“The one thing that is very apparent is that there is no clarity in the scientific and cartographic community on this issue”,they write). Hmm. Our own view is that anyone flying over Greenland en route to Europe from North America would instantly have recognized a problem with the Times Atlas (assuming they knew their location of course). As Kargel and colleagues write in their paper:
“Distinguishing manifest, ignorable nonsense from falsehoods that might take root in the public mind is difficult, but the magnitude of and apparent authority behind this particular mistake seemed to warrant a rapid and firm response. The eventually constructive reaction of HarperCollins, which not only withdrew its mistaken claim but also produced a new map to be included in the Times Atlas as an insert, shows the value of such a response. No less than grotesque trivialization, grotesque exaggeration of the pace or consequences of climate change needs to be countered energetically.”
Nevertheless, they caution that “scientists cannot possibly challenge all of the innumerable misunderstandings and misrepresentations of their work in public discourse.”
Well said. Of course, many scientists can do more, and we encourage all of our colleagues to speak publically about their research and, as the international glaciological research community did in this case, to try to correct misconceptions. At the same time, hopefully, HarperCollins will catch on and recognize that being scientifically literate is not just scientists’ responsibility, but is everyone’s responsibility.
Speculative polar cartography
Guest commentary from Kevin Brown
The curious mismapping of Greenland’s ice sheet cover by the venerable Times Atlas recently has excited a lot of outraged commentary. But few people noted that this follows an old tradition of speculative cartography of the polar regions. ‘Modern’ mapmakers as early as the 16th century combined real facts and scientific knowledge with fundamental misinterpretations of that knowledge to create speculative mappings of the world’s unknown shores – and nowhere was this more prevalent than at the poles.
Early cartographers had a particularly difficult time mapping the Polar Regions. Factually, they based their maps on reports from mariners who dared sail the dangerous waters. This was supplemented by information from earlier maps, speculations based upon their personal theories of geography, religious beliefs, and the fiscal and political ambitions of their patrons.
[Read more…] about Speculative polar cartography
Greenland meltdown
After a record-breaking 2010 in terms of surface melt area in Greenland Tedesco et al, 2011, numbers from 2011 have been eagerly awaited. Marco Tedseco and his group have now just reported their results. This is unrelated to other Greenland meltdown this week that occurred at the launch of the new Times Atlas.
[Read more…] about Greenland meltdown
References
- M. Tedesco, X. Fettweis, M.R. van den Broeke, R.S.W. van de Wal, C.J.P.P. Smeets, W.J. van de Berg, M.C. Serreze, and J.E. Box, "The role of albedo and accumulation in the 2010 melting record in Greenland", Environmental Research Letters, vol. 6, pp. 014005, 2011. http://dx.doi.org/10.1088/1748-9326/6/1/014005
The unnoticed melt
Guest commentary from Dirk Notz, MPI Hamburg
“Well, it’s not really good timing to write about global warming when the summer feels cold and rainy”, a journalist told me last week. Hence, at least here in Germany, there hasn’t been much reporting about the recent evolution of Arctic sea ice – despite the fact that Arctic sea ice extent in July, for example, was the lowest ever recorded for that month throughout the entire satellite record. Sea-ice extent in August was also extremely low, second only to August 2007 (Fig. 1). Whether or not we’re in for a new September record, the next weeks will show.
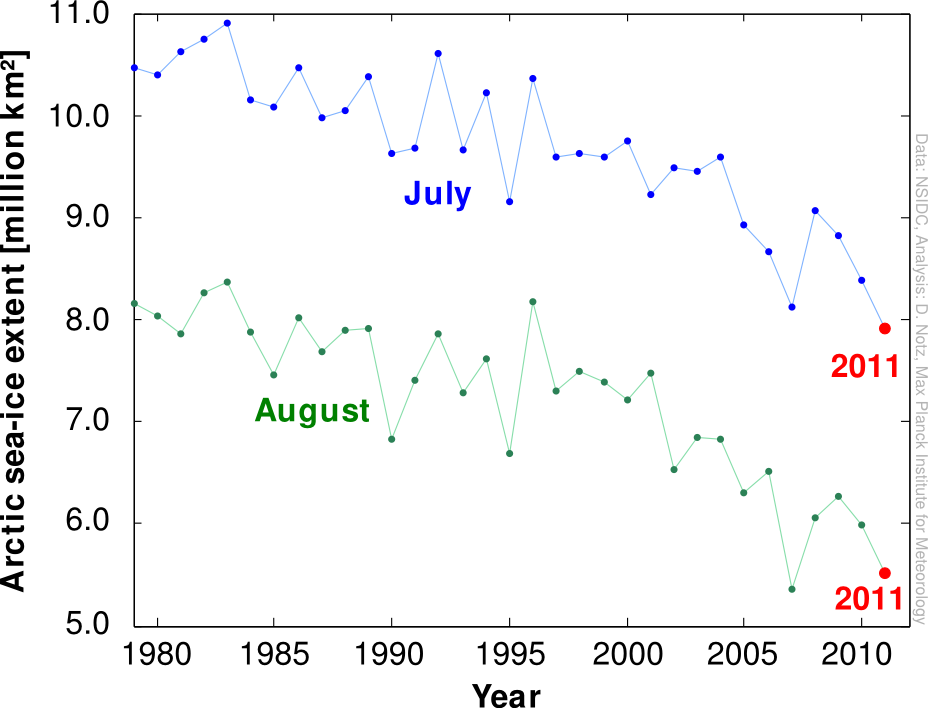
Figure 1: Evolution of Arctic sea-ice extent in July and August from 1979 until 2011. (NSIDC)
[Read more…] about The unnoticed melt
Arctic sea ice minimum discussions
Here is a continuation of the last Arctic sea ice discussion as we get closer to the 2011 minimum. All figures will update continuously.
JAXA Sea ice extent and area:


Cryosphere Today sea ice concentration:

Estimated sea ice volume from UW PIOMAS (updated every month):
