Guest commentary from Nathan Lenssen (Colorado School of Mines)
A new analysis of historical temperatures suggests that things are getting warmer faster, but what does it mean for the future?
[Read more…] about How robust is our accelerometer?Climate science from climate scientists...
Guest commentary from Nathan Lenssen (Colorado School of Mines)
A new analysis of historical temperatures suggests that things are getting warmer faster, but what does it mean for the future?
[Read more…] about How robust is our accelerometer?Climate change has become “that” topic – like evolution of species, plate tectonics, or AI where the public has heard so much about it that many think they know everything they need to know. Such confidence can be both a good and bad thing.
The upside is that the biggest global societal problem of our time, climate change, has become a part of the broader culture. The vast majority of the world agrees that something must be done to mitigate global warming – 69% of the world population is willing to contribute 1% of their income to climate mitigation, and 89% demand climate action from their governments and politicians. 62% of Americans feel a personal duty to reduce the effects of climate change. However, the downside is that most lack a sufficient foundation in the science of climate change which creates misconceptions, a lack of ability to discern pseudoscience, and an ill-founded surety about the realities of global warming. Misconceptions get in the way of understanding the science behind the predictions of climate change to the point where mitigation efforts are derailed or stalled. The consequence is that anthropogenic climate change, a phrase used to describe the change in climate attributable to human activity, becomes a political “belief” rather than accepted as scientific discourse.
The U.S. is among the most politically divided countries about anthropogenic climate change. Despite 61% of Americans regarding the scientific evidence supporting a warming Earth as solid, the current administration has successfully and systematically defunded most of its institutions providing the most scientifically sound information and educational materials about climate change. The damage to NASA, NOAA, NIH, and EPA is profound and is threatening the exalted status of the U.S. as a global leader in scientific research. Such misguidedness stems in part from “The vast majority of the world” (the tendency of individuals to underestimate the willingness of others to want to mitigate climate change), and in greater part from “climate modeling ignorance.”
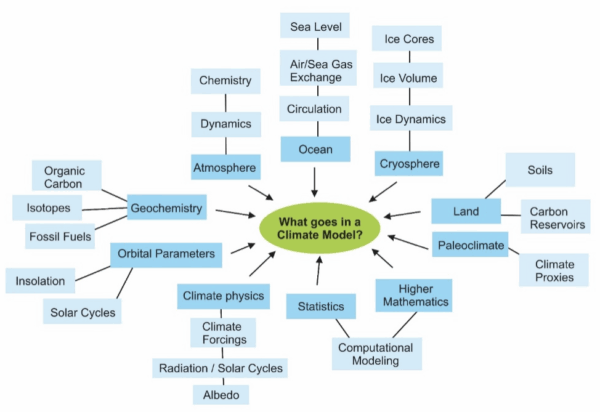
One of the most pernicious misconceptions about climate change is the idea that climate models make projections for the next 100 years by simply extrapolating the globally averaged changes in weather patterns over the last 40 – 50 years into the future. This is an important misconception to correct because it goes to the core of the credibility of climate models in the mind of lay people who make political decisions about mitigating hazards of anthropogenic climate change. This misconception is an outgrowth from another one – that weather and climate are the same thing. Many lay people do not realize that both regional and global climate is determined by many factors beyond atmospheric chemistry and dynamics, including (but not limited to) ocean circulation, the thermal properties of both seawater and ice, the extent and volume of ice cover as well as Earth’s orbital parameters – are all part and parcel of climate models:
For example, “will it snow tomorrow?” is a ‘weather’ question, while “how do El Niño events in the tropical Pacific Ocean affect winters in West Michigan?” is a climate question. This distinction matters for making decisions about mitigating climate change because it fosters the understanding that teleconnections affect both global and regional climate, and that a persistent change related to global warming in the natural cyclicity of a distant interaction between ocean and atmosphere (El Niño in the tropical Pacific) can change what to expect in West Michigan in the next 50 or 100 years.
Another pervasive misconception is the confusion of Environmental Science with Climate Science. Two big questions arise: “what can a climatologist do that an environmental scientist cannot?” and “why does developing Climate Science programs in colleges distinct from environmental science matter for the lay person, the broader public?”
Nationally, while both Environmental Science and Climate Science programs are broadly
multidisciplinary and interrelated, they have important differences. Climate Science is a physical science focusing on the causes, direct effects, and changes in climate through all of Earth’s history including the Anthropocene (the “Human Era”) through computational models involving the chemistry and physics of climate change; while Environmental Science is a natural science broadly involving ecology, microbiology, soil science, conservation, restoration, natural resource management, entomology, pollution, water quality, and similar.
For example, pollution of a river system is a massive environmental problem. So is recycling waste. But neither are problems directly related to climate change. Similarly, availability of food or clean water is a sustainability question related more to human population growth, economics, politics, and environmental change than climate change; though of course the greater the human population, the greater the amount of greenhouse gasses emitted to the atmosphere which leads to climate warming. So, climate change affects and informs environmental change and sustainability but is only one aspect of those fields. The change in duration of the annual growth season or warmer temperatures shifting to higher latitudes will affect availability of food and water – these are sustainability issues.
Unfortunately, only a handful of colleges and universities across the United States have developed college majors specifically in Climate Science, most recently Grand Valley State University. However, academic programs specifically dedicated to Climate System Science are a new national trend – so new in fact that it is difficult to find information about the number of students enrolled or graduates produced annually nationwide.
What has this got to do with “climate modeling ignorance”?
Creating academic programs specifically focused on Climate System Science with a bend toward climate modeling is crucial at these times of swift and dangerous climate change. Lay people (the voting public) need to better understand the scientific basis for the causes and predictions related to anthropogenic climate change so humanity can make better informed decisions about mitigation efforts.
Not everyone can dedicate resources and time to majoring in Climate Science but growing a population of well-educated climate scientists will help create a more climate literate public. Individuals specialized in climate system science who understand the strengths and uncertainties associated with climate modeling can inform the broader public about anthropogenic climate change and more effective ways of countering and preventing its hazardous effects.
A Communications major minoring in Climate Science may pursue a career as a climate journalist or spokesperson. In essence, a student minoring or majoring in Climate Science becomes a person who fosters climate literacy in their communities. According to the Bureau of Labor Statistics, the average salary for climatologists is $94,570 annually, there were 10,500 people employed as climatologists in 2020, and the projected growth rate for climatologist jobs between 2020 and 2030 is 8%. According to ZipRecruiter, the average earnings for a climate scientist or climate change specialist is $111,343.
In summary, degrees in Climate Science and Environmental Science are distinct from one another by content and by job prospects they offer. The job prospects for climate scientists are numerous and varied because climatologists are urgently needed in a world where climate is changing fast and often times unpredictably.
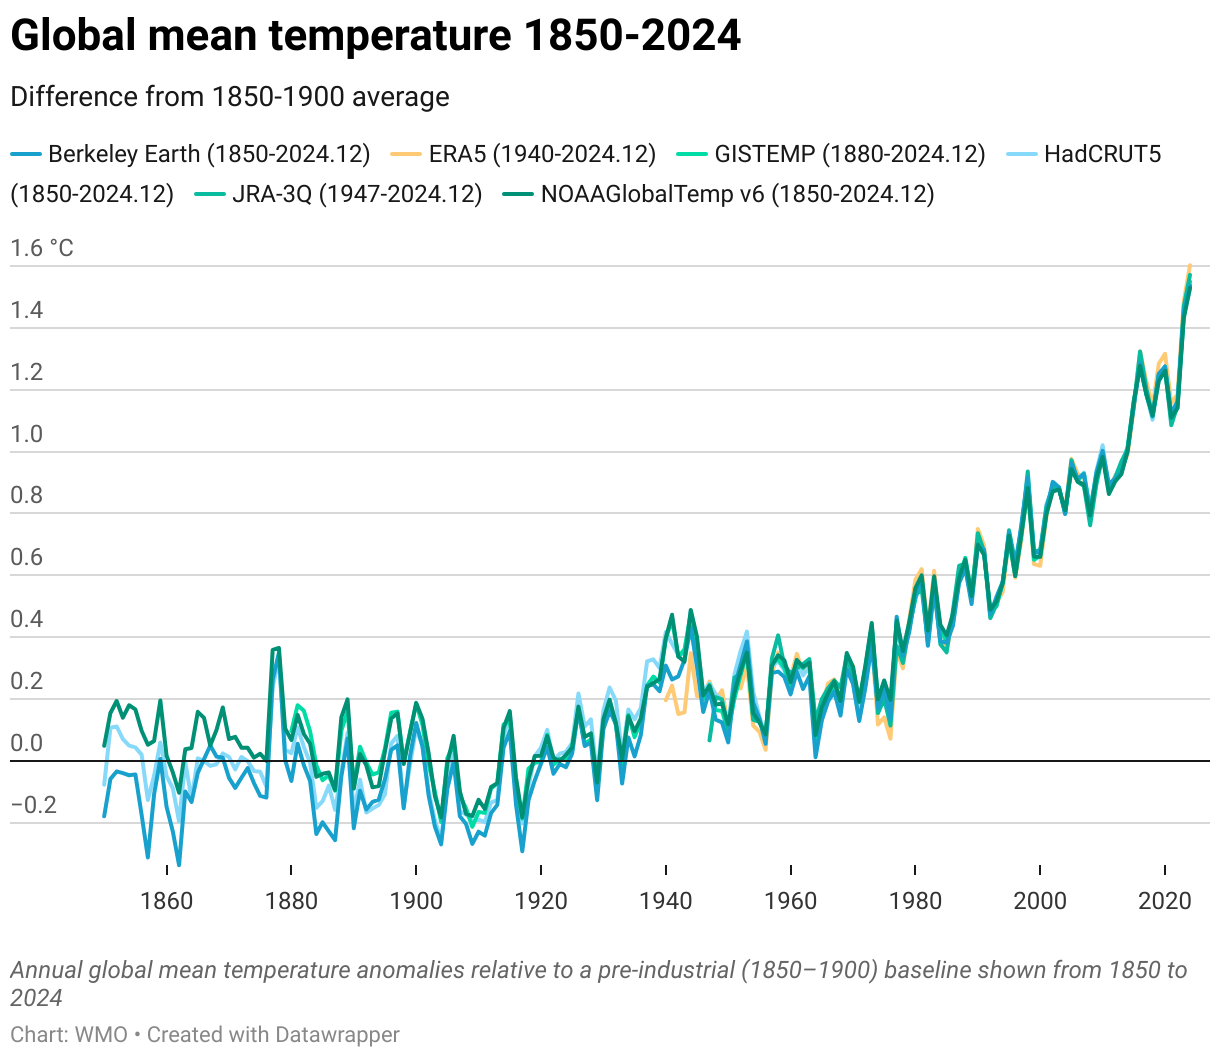
The WMO released its (now) annual state of the climate report this week. As well as the (now) standard set of graphs related to increasing greenhouse gas concentrations, rising temperatures, reducing glacier mass, etc., Zeke Hausfather and I wrote up a short synthesis on the contributions to recent temperature anomalies.
[Read more…] about WMO: Update on 2023/4 AnomaliesTo no-one’s surprise 2024 was the warmest year on record – and by quite a clear margin.
[Read more…] about 2024 HindsightThis is a follow-on post to the previous summary of interesting work related to the temperatures in 2023/2024. I’ll have another post with a quick summary of the AGU session on the topic that we are running on Tuesday Dec 10th, hopefully in the next couple of weeks.
6 Dec 2024: Goessling et al (2024)
This is perhaps the most interesting of the papers so far that look holistically at the last couple of years of anomalies. The principle result is a tying together the planetary albedo and the temperature changes. People have been connecting these changes in vague (somewhat hand-wavy ways) for a couple of years, but this is the first paper to do so quantitatively.
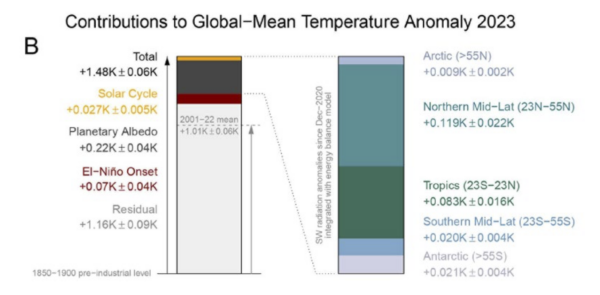
The authors use the CERES data and some aspects of the ERA5 reanalysis (which is not ideal for these purposes because of issues we discussed last month) to partition the changes by latitude, and to distinguish impacts from the solar cycle anomaly (~0.03 K), ENSO (~0.07K) and the albedo (~0.22K) (see figure above).
What they can’t do using this methodology is partition the albedo changes across cloud feedbacks, aerosol effects, surface reflectivity, volcanic activity etc., and even less, partition that into the impacts of marine shipping emission reductions, Chinese aerosol emissions, aerosol-cloud interactions etc. So, in terms of what the ultimate cause(s) are, more work is still needed.
Watch this space…
[Last update Dec 6, 2024] There were a number of media reports today [May 11, 2024] related to Yuan et al. (2024), for instance, New Scientist, The Guardian etc. However, this is really just the beginning of what is likely to be a bit of a cottage industry in the next few months relating to possible causes/influences on the extreme temperatures seen in 2023. So to help people keep track, we’ll maintain a list here to focus discussions. Additionally, we’ll extract out the key results (such as the reported radiative forcing) as a guide to how this will all eventually get reconciled.
[Read more…] about New journal: Nature 2023?There has been a lot of commentary about perceived disagreements among climate scientists about whether climate change is (or will soon be) accelerating. As with most punditry, there is less here than it might seem.
[Read more…] about Much ado about accelerationAs the climate monitoring groups add an additional dot to their graphs this week, there is some disquiet among people paying attention about just how extraordinary 2023 really was.
[Read more…] about Not just another dot on the graph?For the last few years (since at least 2016), I’ve shared predictions for the next annual global mean surface air temperature (GMSAT) anomaly based on the long term trend and the state of ENSO at the start of the year. Generally speaking, this has been quite skillful compared to persistence or just the long term trend alone – the eventual anomaly was consistently within the predicted bounds. Until 2023.
[Read more…] about Annual GMSAT predictions and ENSOThe world is full of climate dashboards (and dashboards of dashboards), and so you might imagine that all datasets and comparisons are instantly available in whatever graphical form you like. Unfortunately, we often want graphics to emphasize a particular point or comparison, and generic graphs from the producers of the data often don’t have the same goal in mind. Dashboards that allow for more flexibility (like WoodForTrees) are useful, but aren’t as visually appealing as they could be. Thus, I find myself creating bespoke graphics of climate and climate model data all the time.
Some of these are maintained on the Climate model-observations comparison page but many of the graphs that I make (often to make a point on twitter) aren’t saved there and often their provenance is a bit obscure. Given that twitter will not last forever (though it might be around for slightly longer than a head of lettuce), it’s probably useful to have a spot to upload these graphics to, along with some explanation, to serve as a reference.
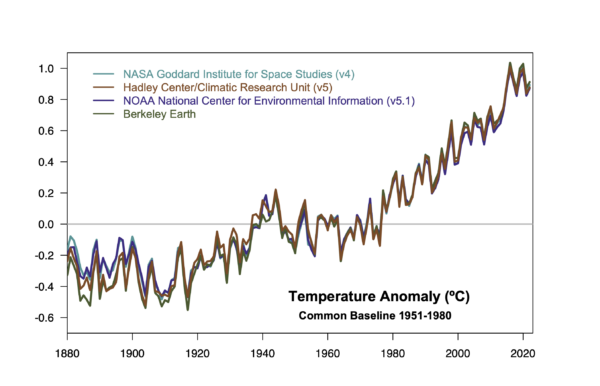
I have therefore created a couple of ‘pages’ (in wordpress speak) with fixed URLs where I will be curating relevant graphics I make (and findable at the bottom of the page under “DATA AND GRAPHICS”). The first is focused on the surface temperature records. I often update relevant graphics associated with this in early January (when we get another dot on the graphs), but there are associated graphs that I’ve made that don’t make it into those updates, so this is a place for them too. This includes the impacts of ENSO, comparisons across different platforms, or the impact of homogenization.
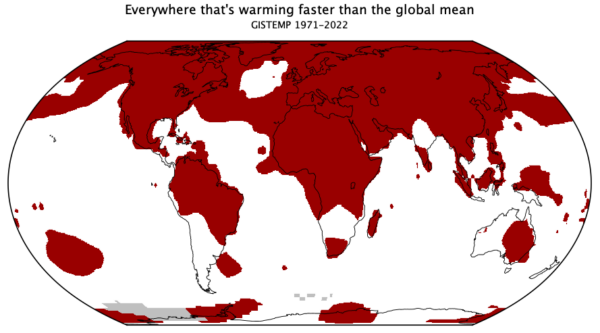
The second page is bit more eclectic. These are graphs that are relevant to some trope or talking point that often pops up, and my graphs are an attempt to provide context (usually), or to debunk it entirely. This is where you’ll find maps of where the climate is warming faster than the global average, time-series of river ice break-up dates, and an example of sensible scaling of CO2 changes and temperature.
To start with, I’m just going to upload some graphs I’ve made recently (with any updates that are needed), and I’ll add content as I make something new. If there are any other ideas (that aren’t too involved!), I’ll be happy to look at adding those too. Let me know if this is useful.