• Skip to primary navigation
  • Skip to main content
  • Skip to primary sidebar
  • Skip to footer

RealClimate

Climate science from climate scientists...

  • Start here
  • Model-Observation Comparisons
  • Miscellaneous Climate Graphics
  • Surface temperature graphics
You are here: Home / Archives for Climate Science / Greenhouse gases

Greenhouse gases

Pre-industrial anthropogenic CO2 emissions: How large?

11 Oct 2018 by mike

Guest article by William Ruddiman

Fifteen years after publication of Ruddiman (2003), the early anthropogenic hypothesis is still debated, with relevant evidence from many disciplines continuing to emerge. Recent findings summarized here lend support to the claim that greenhouse-gas emissions from early agriculture (before 1850) were large enough to alter atmospheric composition and global climate substantially.

Marine isotopic stage (MIS) 19 is the closest orbital analog to the current MIS 1 interglaciation (Tzedakis et al., 2012), with similarly small changes in precession (εsinω) and nearly synchronous peaks in sin and obliquity (Fig. 1a, b). MIS 11 was once claimed to be the closest MIS 1 analog (for example, Broecker and Stocker, 2006), but that claim is now rejected because obliquity and precession peaks in MIS 11 were far offset.


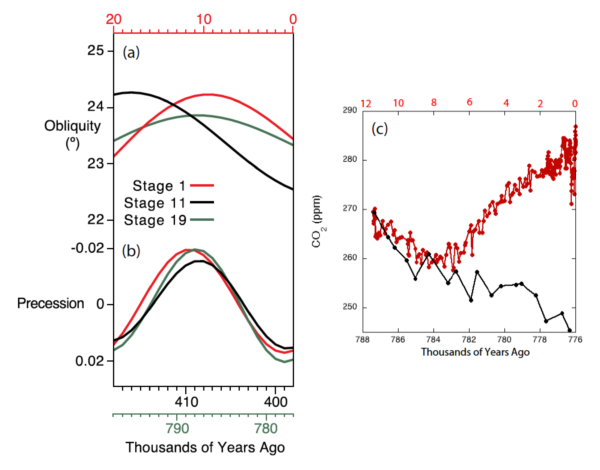
Figure 1 Comparison of (a) obliquity and (b) precession (εsinω) trends during MIS19, (green), MIS11 (black) and MIS1 (red). Based on Tzedakis et al. (2012). (c) CO2 trends during MIS19 (black) and MIS1 (red). CO2 data for MIS 19 are from Dome C (Bereiter et al. 2015). CO2 data for MIS 1 are from Law Dome (MacFarling Meure et al. 2006) and Dome C (Monnin et al. 2001, 2004) for MIS1.


With MIS 11 eliminated as an analog, the focus is on MIS 19. The CO2 signals early in MIS 1 and MIS 19 (Fig. 1c) reached nearly identical peaks of 270 and 269 ppm, after which the MIS 1 value fell for 4000 years but then rose by 20 ppm to a late pre-industrial 280-285 ppm. In contrast, the MIS 19 CO2 trend continued downward for more than 10,000 years to 245-250 ppm by the time equivalent to the present day. This value is consistent with the 240-245 ppm level proposed in the early anthropogenic hypothesis for a natural Holocene world (with no human overprint). The 35-ppm difference between the two interglaciations is close to the 40-ppm Holocene anomaly inferred by Ruddiman (2003).

A GCM simulation of the MIS 19 time equivalent to today by Vavrus et al. (2018) indicates that the low CO2 values would have caused year-round snow cover (indicative of incipient glaciation) in the Canadian Archipelago and over Baffin Island (an area roughly the size of Greenland), as well as other Arctic regions (see also Ganopolski et al., 2014).

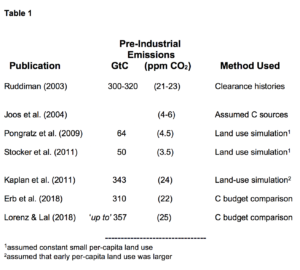
Ruddiman (2003) estimated pre-industrial carbon emissions of 300-320 Gt, based on a back-of-the-envelope compilation of the incomplete forest clearance histories then available (Table 1). [One Gt is one billion tons]. That estimate was for a while rejected as too high by a factor of 5 to 10 (Joos et al., 2004; Pongratz et al., 2008; Stocker et al., 2011. However, Kaplan et al. (2011) found that those estimates had been biased downward because they assumed much smaller early per-capita clearance than the large amounts shown by actual historical data. Those estimates also ignored areas that had been cleared and were not in active agricultural use, but had not yet reforested. Adjusting for these factors, Kaplan and colleagues estimated pre-industrial emissions of 343 GtC.

Erb et al. (2017) averaged 7 estimates of the amount of carbon that would currently be stored in Earth’s potential natural vegetation had there been no human activities (910 GtC) compared to the 460 GtC carbon actually stored there today. They attributed the difference of 450 GtC to cumulative vegetation removal by humans (mostly deforestation). With ~140 GtC of clearance having occurred during the industrial era, that left an estimated 310 GtC as the total removed and emitted to the atmosphere during pre-industrial time. In a similar analysis, Lorenz and Lal (2018) estimated pre-industrial carbon emissions of ‘up to’ 357 GtC.

Studies in other disciplines have begun adding direct ground-truth evidence about early clearance. Analyses of pollen in hundreds of European lake cores (Fyfe et al., 2014; Roberts et al, 2018) show that forest vegetation began to decrease after 6000 years ago and reached near-modern levels before the start of the industrial era (Fig. 2). In China, compilations of over 50,000 archaeological sites by Li et al. (2009) and Hosner et al. (2016) show major increases of farming settlements in previously forested areas beginning 7,000 years ago. These extensive compilations support the above estimates of large early anthropogenic clearance and C emissions.


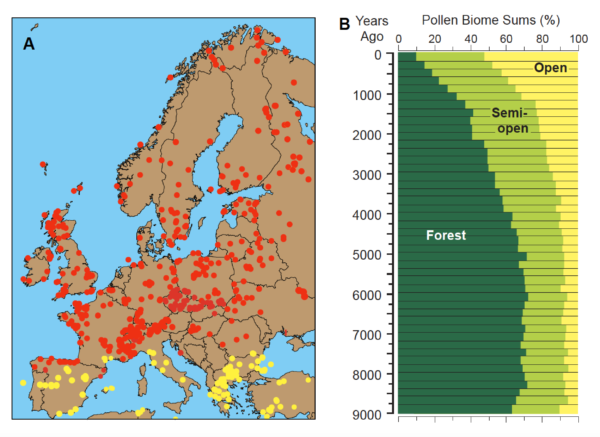
Figure 2. Evidence of early forest clearance in Europe. (A) Locations of cores in the European pollen database. Cores used for pollen summary in B are shown in red (Fyfe et al., 2015). (B) Changes in forest, open, and semi-open (mixed forest and open) vegetation plotted as ‘pseudobiome’ sums.


As this wide-ranging multi-disciplinary evidence has emerged, some scientists continue to reject the early anthropogenic hypothesis. Most of the opposition is based on a geochemical index (δ13CO2) measured in CO2 contained in air bubbles trapped in ice cores. The δ13CO2 index shows the relative balance through time between the amount of 12C-rich terrestrial carbon from the land and 13C-neutral carbon from the ocean. The small 13C decrease in atmospheric CO2 during the last 7000 years has been interpreted as indicating minimal input of 12C-rich terrestrial carbon during that time (Broecker and Stocker, 2006; Elsig et al., 2009). In a July 20, 2018 Scienceonline.org post, Jeff Severinghaus estimated the early human contribution to the observed CO2 rise as “1 to 2 ppm at the most”, or just 5-10% of the recent estimates reviewed in Table 1.

Other scientists (Stocker et al., 2018; Ruddiman et al., 2016) have pointed out that the δ13CO2 index cannot be used to isolate the amount of deforestation carbon unless all significant carbon sources and sinks are well constrained. The compilation by Yu (2011) indicating that ~300 Gt of terrestrial (12C-rich) carbon were buried in boreal peats during the last 7000 years shows that this constraint had not been satisfied in previous studies. Burial of ~300 GtC in boreal peats requires a counter-balancing emission of more than 300 GtC of terrestrial carbon during the last 7000 years, and the discussion above summarizes evidence that pre-industrial deforestation can fill that deficit. Even now, however, carbon exchanges (whether sources or sinks) in non-peat permafrost areas and in river floodplains and deltas during the last 7000 years remain poorly known.

Scientists trying to make up their minds about this still-ongoing debate can now weigh wide-ranging multi-disciplinary evidence for large early forest clearance against reliance on the as-yet poorly constrained δ13CO2 index.

References

Bereiter, B., S. Eggleston, J. Schmitt, C. Nehrbass-Ahles, T. F. Stocker, et al. (2015), Revision of the EPICA Dome C CO2 record from 800 to 600 kyr before present, Geophys. Res. Lett., 42, 542–549.

Broecker, W. S. and T. L. Stocker (2006), The Holocene CO2 rise: Anthropogenic or natural? EOS Trans. Amer. Geophysical Union 87, 27.

Erb, K.-H., T. Kastner, C. Plutzar, C., A. L. S Bais, N. Carvalhai., et al. (2018), Unexpectedly large impact of forest management on global vegetation biomass. Nature 553, 73-76.

Elsig J., J. Schmitt, D. Leuenberger, R. Schneider, M. Eyer, et al. (2009), Stable isotope constraints on Holocene carbon cycle changes from an Antarctic ice core. Nature 461, 507-510.

Fyfe, R. M., J. Woodbridge, and N. Roberts (2015), From forest to farmland: pollen-inferred land cover changes across Europe using the pseudobiomization approach. Global Change Biology 20, 1197-1212.

Ganopolski, A., R. Winkelmann and H. J. Schellenhuber, (2014), Critical insolation-CO2 relation for diagnosing past and future glacial inception. Nature 529, 200-203.

Hosner, D., M. Wagner, P. E. Tarasov, X. Chen, and C. Leipe (2016), Spatiotemporal distribution patterns of archaeological sites in China during the Neolithic and Bronze Age: An overview. The Holocene 26, 1576-1583.

Joos F, Gerber S, Prentice IC, et al. (2004) Transient simulations of Holocene atmospheric carbon dioxide and terrestrial carbon since the last glacial maximum. Global Biogeochemical Cycles 18. DOI: 10.1029/2003GB002156.

Kaplan J. O, K. M. Krumhardt, E. C. Ellis, W. F. Ruddiman, C. Lemmen, et al. Goldewijk (2011), Holocene carbon emissions as a result of anthropogenic land cover change. The Holocene 21, 775-792.

Li, X., J. Dodson, J. Zhou, and X. Zhou (2008), Increases of population and expansion of rice agriculture in Asia, and anthropogenic methane emissions since 5000 BP. Quat. Int. 202, 41-50.

Lorenz, K. and R. Lal (2018), Agricultural land use and the global carbon cycle. In: Carbon sequestration in agricultural systems, p. 1-37.

MacFarling Meure, C., D. Etheridge, C. Trudinger, P. Steele, R. Langenfelds, et al. (2006), Law Dome CO2, CH4 and N2O ice core records extended to 2000 years BP. Geophys. Res. Lett., 33, L14810, doi:10.1029/2006GL026152.

Monnin E., A. Indermühle, A. Dällenbach, J. Flückinger, B. Stauffer, et al. (2001), Atmospheric CO¬¬2 concentrations over the Last Glacial Termination. Science, 291, 112-114.

Pongratz, J., C. Reick, T. Raddatz, and M. A. Claussen (2008), A reconstruction of global agricultural areas and land cover for the last millennium. Global Geochemical Cycles 22, GB3018m doi:10.1029/2008GLO36394.

Roberts N, R. M. Fyfe, J. Woodbridge, et al. (2018), Europe’s forests: A pollen-based synthesis for the last 11,000 years. Nature Scientific Reports. DOI: 10.1038/s41598-017-18646-7
Ruddiman, W. F. (2003), The anthropogenic greenhouse era began thousands of years ago. Climatic Change 61, 261-293.

Ruddiman, W. F., D. Q. Fuller, J. E Kutzbach, P. C. Tzedakis, J. O. Kaplan et al. (2016), Late Holocene climate: Natural or anthropogenic? Rev. of Geophys. 54, 93-118.

Stocker, B. D., K. Strassmann, and F. Joos (2011), Sensitivity of Holocene atmospheric CO2 and the modern carbon budget to early human land use: analyses with a process-base model. Biogeosciences 8, 69-88.

Stocker, B.D., Z. Yu, and F. Joos (2018), Constraining CO2 emissions from different Holocene land-use histories: does the carbon budget add up? PAGES 26, 6-7.

Tzedakis, P. C., J. E. T. Channell, D. A. Hodell, H. F. Kleiven, and L. K. Skinner (2012), Determining the length of the current interglacial. Nature Geoscience 5, 138-141.

Vavrus, S. J., F. He, J. E. Kutzbach, W. F. Ruddiman, and P. C. Tzedakis (2018), Glacial inception in marine isotope stage 19: An orbital analog for a
natural Holocene. Nature Scientific Reports 81, doi:10.1038/s41598-018-28419-5.

Filed Under: Carbon cycle, Climate Science, Greenhouse gases, Paleoclimate Tagged With: co2, early anthropocene, greenhouse gases

30 years after Hansen’s testimony

21 Jun 2018 by Gavin

“The greenhouse effect is here.”
– Jim Hansen, 23rd June 1988, Senate Testimony

The first transient climate projections using GCMs are 30 years old this year, and they have stood up remarkably well.

We’ve looked at the skill in the Hansen et al (1988) (pdf) simulations before (back in 2008), and we said at the time that the simulations were skillful and that differences from observations would be clearer with a decade or two’s more data. Well, another decade has passed!

[Read more…] about 30 years after Hansen’s testimony

References

  1. J. Hansen, I. Fung, A. Lacis, D. Rind, S. Lebedeff, R. Ruedy, G. Russell, and P. Stone, "Global climate changes as forecast by Goddard Institute for Space Studies three‐dimensional model", Journal of Geophysical Research: Atmospheres, vol. 93, pp. 9341-9364, 1988. http://dx.doi.org/10.1029/JD093iD08p09341

Filed Under: Climate modelling, Climate Science, Greenhouse gases

The Alsup Aftermath

25 Apr 2018 by group

The presentations from the Climate Science tutorial last month have all been posted (links below), and Myles Allen (the first presenter for the plaintiffs) gives his impression of the events.
[Read more…] about The Alsup Aftermath

Filed Under: Carbon cycle, Climate modelling, Climate Science, Greenhouse gases, In the News, Instrumental Record, IPCC, Tutorials

Alsup asks for answers

11 Mar 2018 by Gavin

Some of you might have read about the lawsuit by a number of municipalities (including San Francisco and Oakland) against the major oil companies for damages (related primarily to sea level rise) caused by anthropogenic climate change. The legal details on standing, jurisdiction, etc. are all very interesting (follow @ColumbiaClimate for those details), but somewhat uniquely, the judge (William Alsup) has asked for a tutorial on climate science (2 hours of evidence from the plaintiffs and the defendents). Furthermore, he has posted a list of eight questions that he’d like the teams to answer.

[Read more…] about Alsup asks for answers

Filed Under: Carbon cycle, Climate modelling, Climate Science, Greenhouse gases, Instrumental Record, Paleoclimate, Scientific practice

Climate Sensitivity Estimates and Corrections

12 Jul 2017 by Gavin

You need to be careful in inferring climate sensitivity from observations.

Two climate sensitivity stories this week – both related to how careful you need to be before you can infer constraints from observational data. (You can brush up on the background and definitions here). Both cases – a “Brief Comment Arising” in Nature (that I led) and a new paper from Proistosescu and Huybers (2017) – examine basic assumptions underlying previously published estimates of climate sensitivity and find them wanting.

[Read more…] about Climate Sensitivity Estimates and Corrections

References

  1. C. Proistosescu, and P.J. Huybers, "Slow climate mode reconciles historical and model-based estimates of climate sensitivity", Science Advances, vol. 3, 2017. http://dx.doi.org/10.1126/sciadv.1602821

Filed Under: Carbon cycle, Climate modelling, Climate Science, Greenhouse gases, Instrumental Record, Paleoclimate

Why global emissions must peak by 2020

2 Jun 2017 by Stefan

(by Stefan Rahmstorf and Anders Levermann)

In the landmark Paris Climate Agreement, the world’s nations have committed to “holding the increase in the global average temperature to well below 2 °C above pre-industrial levels and to pursue efforts to limit the temperature increase to 1.5 °C above pre-industrial levels”. This goal is deemed necessary to avoid incalculable risks to humanity, and it is feasible – but realistically only if global emissions peak by the year 2020 at the latest.

Let us first address the importance of remaining well below 2°C of global warming, and as close to 1.5°C as possible. The World Meteorological Organization climate report[i] for the past year has highlighted that global temperature and sea levels keep rising, reaching record highs once again in 2016. Global sea ice cover reached a record low, and mountain glaciers and the huge ice sheets in Greenland and Antarctica are on a trajectory of accelerating mass loss. More and more people are suffering from increasing and often unprecedented extreme weather events[ii], both in terms of casualties and financial losses. This is the situation after about 1°C global warming since the late 19th Century. [Read more…] about Why global emissions must peak by 2020

Filed Under: Climate Science, Greenhouse gases, Solutions

Judy Curry’s attribution non-argument

18 Apr 2017 by Gavin

Following on from the ‘interesting’ House Science Committee hearing two weeks ago, there was an excellent rebuttal curated by ClimateFeedback of the unsupported and often-times misleading claims from the majority witnesses. In response, Judy Curry has (yet again) declared herself unconvinced by the evidence for a dominant role for human forcing of recent climate changes. And as before she fails to give any quantitative argument to support her contention that human drivers are not the dominant cause of recent trends.

Her reasoning consists of a small number of plausible sounding, but ultimately unconvincing issues that are nonetheless worth diving into. She summarizes her claims in the following comment:

… They use models that are tuned to the period of interest, which should disqualify them from be used in attribution study for the same period (circular reasoning, and all that). The attribution studies fail to account for the large multi-decadal (and longer) oscillations in the ocean, which have been estimated to account for 20% to 40% to 50% to 100% of the recent warming. The models fail to account for solar indirect effects that have been hypothesized to be important. And finally, the CMIP5 climate models used values of aerosol forcing that are now thought to be far too large.

These claims are either wrong or simply don’t have the implications she claims. Let’s go through them one more time.

[Read more…] about Judy Curry’s attribution non-argument

Filed Under: Climate modelling, Climate Science, Greenhouse gases

Why correlations of CO2 and Temperature over ice age cycles don’t define climate sensitivity

24 Sep 2016 by Gavin

We’ve all seen how well temperature proxies and CO2 concentrations are correlated in the Antarctic ice cores – this has been known since the early 1990’s and has featured in many high-profile discussions of climate change.


EPICA Dome C ice core greenhouse gas and isotope records.

The temperature proxies are water isotope ratios that can be used to estimate Antarctic temperatures and, via a scaling, the global values. The CO2 and CH4 concentration changes can be converted to radiative forcing in W/m2 based on standard formulas. These two timeseries can be correlated and the regression (in ºC/(W/m2)) has the units of climate sensitivity – but what does it represent?

[Read more…] about Why correlations of CO2 and Temperature over ice age cycles don’t define climate sensitivity

Filed Under: Carbon cycle, Climate Science, Greenhouse gases, Paleoclimate

Comparing models to the satellite datasets

7 May 2016 by Gavin

How should one make graphics that appropriately compare models and observations? There are basically two key points (explored in more depth here) – comparisons should be ‘like with like’, and different sources of uncertainty should be clear, whether uncertainties are related to ‘weather’ and/or structural uncertainty in either the observations or the models. There are unfortunately many graphics going around that fail to do this properly, and some prominent ones are associated with satellite temperatures made by John Christy. This post explains exactly why these graphs are misleading and how more honest presentations of the comparison allow for more informed discussions of why and how these records are changing and differ from models.
[Read more…] about Comparing models to the satellite datasets

Filed Under: Climate modelling, Climate Science, El Nino, Greenhouse gases, Instrumental Record, IPCC, Model-Obs Comparisons, statistics

The Volcano Gambit

9 Apr 2016 by Gavin

Anyone reading pundits and politicians pontificating profusely about climate or environmental science will, at some point, have come across the “volcano gambit”. During the discussion they will make a claim that volcanoes (or even a single volcano) produce many times more pollutant emissions than human activities. Often the factor is extremely precise to help give an illusion of science-iness and, remarkably, almost any pollutant can be referenced. This “volcano gambit” is an infallible sign that indicates the author is clueless about climate science, but few are aware of its long and interesting history…

[Read more…] about The Volcano Gambit

Filed Under: Carbon cycle, Climate Science, Greenhouse gases, Instrumental Record, skeptics

  • « Go to Previous Page
  • Page 1
  • Page 2
  • Page 3
  • Page 4
  • Page 5
  • Page 6
  • Interim pages omitted …
  • Page 16
  • Go to Next Page »

Primary Sidebar

Search

Search for:

Email Notification

get new posts sent to you automatically (free)
Loading

Recent Posts

  • Unforced variations: Oct 2025
  • “But you said the ice was going to disappear in 10 years!”
  • Time and Tide Gauges wait for no Voortman
  • Lil’ NAS Express
  • DOE CWG Report “Moot”?
  • Climate Scientists response to DOE report

Our Books

Book covers
This list of books since 2005 (in reverse chronological order) that we have been involved in, accompanied by the publisher’s official description, and some comments of independent reviewers of the work.
All Books >>

Recent Comments

  • Nigelj on Unforced variations: Oct 2025
  • Kevin McKinney on Unforced variations: Oct 2025
  • Kevin McKinney on Unforced variations: Oct 2025
  • Kevin McKinney on Unforced variations: Oct 2025
  • Kevin McKinney on “But you said the ice was going to disappear in 10 years!”
  • Atomsk's Sanakan on Unforced variations: Oct 2025
  • Susan Anderson on “But you said the ice was going to disappear in 10 years!”
  • Tomáš Kalisz on Unforced variations: Oct 2025
  • Atomsk's Sanakan on Unforced variations: Oct 2025
  • JCM on Unforced variations: Oct 2025
  • Atomsk's Sanakan on Unforced variations: Oct 2025
  • Atomsk's Sanakan on Unforced variations: Oct 2025
  • Piotr on Unforced variations: Oct 2025
  • David on Unforced variations: Oct 2025
  • David on Unforced variations: Oct 2025
  • David on Unforced variations: Oct 2025
  • David on Unforced variations: Oct 2025
  • David on Unforced variations: Oct 2025
  • Mo watever on “But you said the ice was going to disappear in 10 years!”
  • Killian on Unforced variations: Oct 2025
  • Mo watever on “But you said the ice was going to disappear in 10 years!”
  • Killian on Unforced variations: Oct 2025
  • Killian on Unforced variations: Oct 2025
  • Killian on Unforced variations: Oct 2025
  • Keith Woollard on “But you said the ice was going to disappear in 10 years!”
  • Mo Yunus on Unforced variations: Oct 2025
  • Tomáš Kalisz on Unforced variations: Oct 2025
  • Mo Yunus on Unforced variations: Oct 2025
  • prl on Unforced variations: Oct 2025
  • Piotr on “But you said the ice was going to disappear in 10 years!”

Footer

ABOUT

  • About
  • Translations
  • Privacy Policy
  • Contact Page
  • Login

DATA AND GRAPHICS

  • Data Sources
  • Model-Observation Comparisons
  • Surface temperature graphics
  • Miscellaneous Climate Graphics

INDEX

  • Acronym index
  • Index
  • Archives
  • Contributors

Realclimate Stats

1,383 posts

11 pages

247,494 comments

Copyright © 2025 · RealClimate is a commentary site on climate science by working climate scientists for the interested public and journalists.