There is a need to make climate science more agile and more responsive, and that means moving (some of it) from research to operations.
[Read more…] about Operationalizing Climate ScienceGreenhouse gases
Oh My, Oh Miocene!
A recent paper suggested that ‘climate sensitivity’ derived from a new paleo-CO2 record is around 7.2ºC (for equilibrium climate sensitivity ECS) and ~13.9ºC (Earth System Sensitivity – ESS) for a doubling of CO2. Some press has suggested that this means that “Earth’s Temperature Could Increase by 25 Degrees” (F). Huge if true! Fortunately these numbers should not be taken at face value, but we need to dig into the subtleties to see why.
[Read more…] about Oh My, Oh Miocene!Much ado about acceleration
There has been a lot of commentary about perceived disagreements among climate scientists about whether climate change is (or will soon be) accelerating. As with most punditry, there is less here than it might seem.
[Read more…] about Much ado about accelerationThe Scafetta Saga
It has taken 17 months to get a comment published pointing out the obvious errors in the Scafetta (2022) paper in GRL.
Back in March 2022, Nicola Scafetta published a short paper in Geophysical Research Letters (GRL) purporting to show through ‘advanced’ means that ‘all models with ECS > 3.0°C overestimate the observed global surface warming’ (as defined by ERA5). We (me, Gareth Jones and John Kennedy) wrote a note up within a couple of days pointing out how wrongheaded the reasoning was and how the results did not stand up to scrutiny.
[Read more…] about The Scafetta SagaReferences
- N. Scafetta, "Advanced Testing of Low, Medium, and High ECS CMIP6 GCM Simulations Versus ERA5‐T2m", Geophysical Research Letters, vol. 49, 2022. http://dx.doi.org/10.1029/2022GL097716
As Soon as Possible
The latest contrarian crowd pleaser from Soon et al (2023) is just the latest repetition of the old “it was the sun wot done it” trope[1] that Willie Soon and his colleagues have been pushing for decades. There is literally nothing new under the sun.
[Read more…] about As Soon as PossibleReferences
- W. Soon, R. Connolly, M. Connolly, S. Akasofu, S. Baliunas, J. Berglund, A. Bianchini, W. Briggs, C. Butler, R. Cionco, M. Crok, A. Elias, V. Fedorov, F. Gervais, H. Harde, G. Henry, D. Hoyt, O. Humlum, D. Legates, A. Lupo, S. Maruyama, P. Moore, M. Ogurtsov, C. ÓhAiseadha, M. Oliveira, S. Park, S. Qiu, G. Quinn, N. Scafetta, J. Solheim, J. Steele, L. Szarka, H. Tanaka, M. Taylor, F. Vahrenholt, V. Velasco Herrera, and W. Zhang, "The Detection and Attribution of Northern Hemisphere Land Surface Warming (1850–2018) in Terms of Human and Natural Factors: Challenges of Inadequate Data", Climate, vol. 11, pp. 179, 2023. http://dx.doi.org/10.3390/cli11090179
CMIP6: Not-so-sudden stratospheric cooling
As predicted in 1967 by Manabe and Wetherald, the stratosphere has been cooling.
A new paper by Ben Santer and colleagues has appeared in PNAS where they extend their previous work on the detection and attribution of anthropogenic climate change to include the upper stratosphere, using observations from the Stratospheric Sounding Units (SSUs) (and their successors, the AMSU instruments) that have flown since 1979.
[Read more…] about CMIP6: Not-so-sudden stratospheric coolingReferences
- B.D. Santer, S. Po-Chedley, L. Zhao, C. Zou, Q. Fu, S. Solomon, D.W.J. Thompson, C. Mears, and K.E. Taylor, "Exceptional stratospheric contribution to human fingerprints on atmospheric temperature", Proceedings of the National Academy of Sciences, vol. 120, 2023. http://dx.doi.org/10.1073/pnas.2300758120
New misguided interpretations of the greenhouse effect from William Kininmonth
I have a feeling that we are seeing the start of a new wave of climate change denial and misrepresentation of science. At the same time, CEOs of gas and oil companies express optimism for further exploitation of fossil energy in the wake of Russia’s invasion of Ukraine, at least here in Norway.
Another clue is William Kininmonth’s ‘rethink’ on the greenhouse effect for The Global Warming Policy Foundation. He made some rather strange claims, such as that the Intergovernmental Panel on Climate Change (IPCC) allegedly should have forgotten that the earth is a sphere because “most absorption of solar radiation takes place over the tropics, while there is excess emission of longwave radiation to space over higher latitudes”.
[Read more…] about New misguided interpretations of the greenhouse effect from William KininmonthA CERES of fortunate events…
The CERES estimates of the top-of-atmosphere radiative fluxes are available from 2001 to the present. That is long enough to see that there has been a noticeable trend in the Earth’s Energy Imbalance (EEI), mostly driven by a reduction in the solar radiation reflected by the planet, while the outgoing long wave radiation does not appear to contribute much. But what can be causing this?
A paper last year (Goode et al., 2021) also reported on a two decade estimate of Earthshine measurements which appear to confirm a small decrease in albedo (and decrease in reflected short wave (SW) radiation). While the two measurements are subtly different due to the distinct geometries, they do show sufficient coherence to give us some confidence that they are real.
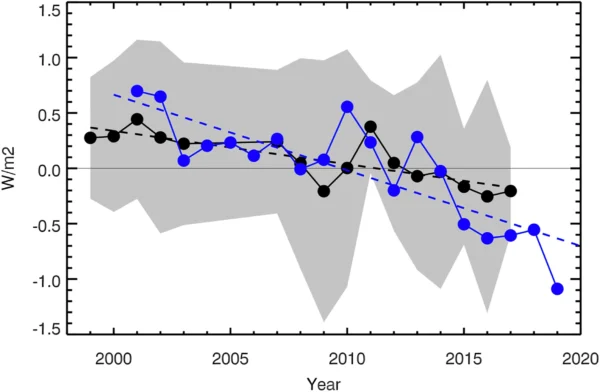
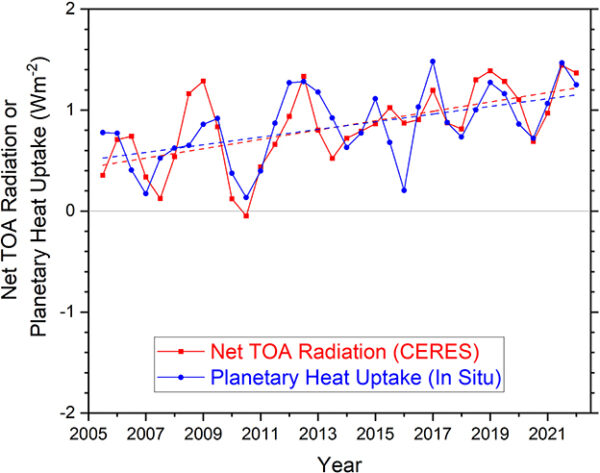
Similarly, Loeb et al. (2021) show that the trends in the EEI derived from CERES match what you get from the changes in ocean heat content.
A few people have started to interpret the dominance of the SW trends to imply that the overall trends in climate are not (despite copious evidence) being driven by the rise in greenhouse gases (for instance, the rather poorly argued and seemingly un-copyedited Dübal and Vahrenholt (2021)) but these simplistic interpretations are seriously confused.
We can explore the issues and pitfalls of this using the ‘simple model’ of the greenhouse effect we explored back in 2007. At that time, we said:
[Read more…] about A CERES of fortunate events…You should think of these kinds of exercises as simple flim-flam detectors – if someone tries to convince you that they can do a simple calculation and prove everyone else wrong, think about what the same calculation would be in this more straightforward system and see whether the idea holds up. If it does, it might work in the real world (no guarantee though) – but if it doesn’t, then it’s most probably garbage.
References
- P.R. Goode, E. Pallé, A. Shoumko, S. Shoumko, P. Montañes‐Rodriguez, and S.E. Koonin, "Earth's Albedo 1998–2017 as Measured From Earthshine", Geophysical Research Letters, vol. 48, 2021. http://dx.doi.org/10.1029/2021GL094888
- N.G. Loeb, G.C. Johnson, T.J. Thorsen, J.M. Lyman, F.G. Rose, and S. Kato, "Satellite and Ocean Data Reveal Marked Increase in Earth’s Heating Rate", Geophysical Research Letters, vol. 48, 2021. http://dx.doi.org/10.1029/2021GL093047
- H. Dübal, and F. Vahrenholt, "Radiative Energy Flux Variation from 2001–2020", Atmosphere, vol. 12, pp. 1297, 2021. http://dx.doi.org/10.3390/atmos12101297
Climate impacts of the #IRA
With the signing of the Inflation Reduction Act (IRA) on Tuesday Aug 16, the most significant climate legislation in US federal history (so far) became law.

Despite the odd name (and greatly overused TLA), the IRA contains a huge number of elements, totalling roughly $350 billion of investment, in climate solutions over the next ten years. This is an historic effort though it falls short of the broader ‘Green New Deal‘ goals that were proposed in 2019, and doesn’t include all of the elements that were in the proposed 2021 reconcilliation package (the American Jobs Plan in “Build Back Better“) that ultimately floundered.
[Read more…] about Climate impacts of the #IRAThe CO2 problem in six easy steps (2022 Update)
One of our most-read old posts is the step-by-step explanation for why increasing CO2 is a significant problem (The CO2 problem in 6 easy steps). However, that was written in 2007 – 15 years ago! While the basic steps and concepts have not changed, there’s 15 years of more data, updates in some of the details and concepts, and (it turns out) better graphics to accompany the text. And so, here is a mildly updated and referenced version that should be a little more useful.
[Read more…] about The CO2 problem in six easy steps (2022 Update)