• Skip to primary navigation
  • Skip to main content
  • Skip to primary sidebar
  • Skip to footer

RealClimate

Climate science from climate scientists...

  • Start here
  • Model-Observation Comparisons
  • Miscellaneous Climate Graphics
  • Surface temperature graphics
You are here: Home / Archives for Climate Science / Instrumental Record

Instrumental Record

Joy plots for climate change

22 Jul 2017 by Gavin

This is joy as in ‘Joy Division’, not as in actual fun.

Many of you will be familiar with the iconic cover of Joy Division’s Unknown Pleasures album, but maybe fewer will know that it’s a plot of signals from a pulsar (check out this Scientific American article on the history). The length of the line is matched to the frequency of the pulsing so that successive pulses are plotted almost on top of each other. For many years this kind of plot did not have a well-known designation until, in fact, April this year:

I hereby propose that we call these "joy plots" #rstats https://t.co/uuLGpQLAwY

— Jenny Bryan (@JennyBryan) April 25, 2017

So “joy plots” it is.

[Read more…] about Joy plots for climate change

Filed Under: Climate Science, Communicating Climate, Instrumental Record

Climate Sensitivity Estimates and Corrections

12 Jul 2017 by Gavin

You need to be careful in inferring climate sensitivity from observations.

Two climate sensitivity stories this week – both related to how careful you need to be before you can infer constraints from observational data. (You can brush up on the background and definitions here). Both cases – a “Brief Comment Arising” in Nature (that I led) and a new paper from Proistosescu and Huybers (2017) – examine basic assumptions underlying previously published estimates of climate sensitivity and find them wanting.

[Read more…] about Climate Sensitivity Estimates and Corrections

References

  1. C. Proistosescu, and P.J. Huybers, "Slow climate mode reconciles historical and model-based estimates of climate sensitivity", Science Advances, vol. 3, 2017. http://dx.doi.org/10.1126/sciadv.1602821

Filed Under: Carbon cycle, Climate modelling, Climate Science, Greenhouse gases, Instrumental Record, Paleoclimate

Nenana Ice Classic 2017

2 May 2017 by Gavin

Translations: (Español)

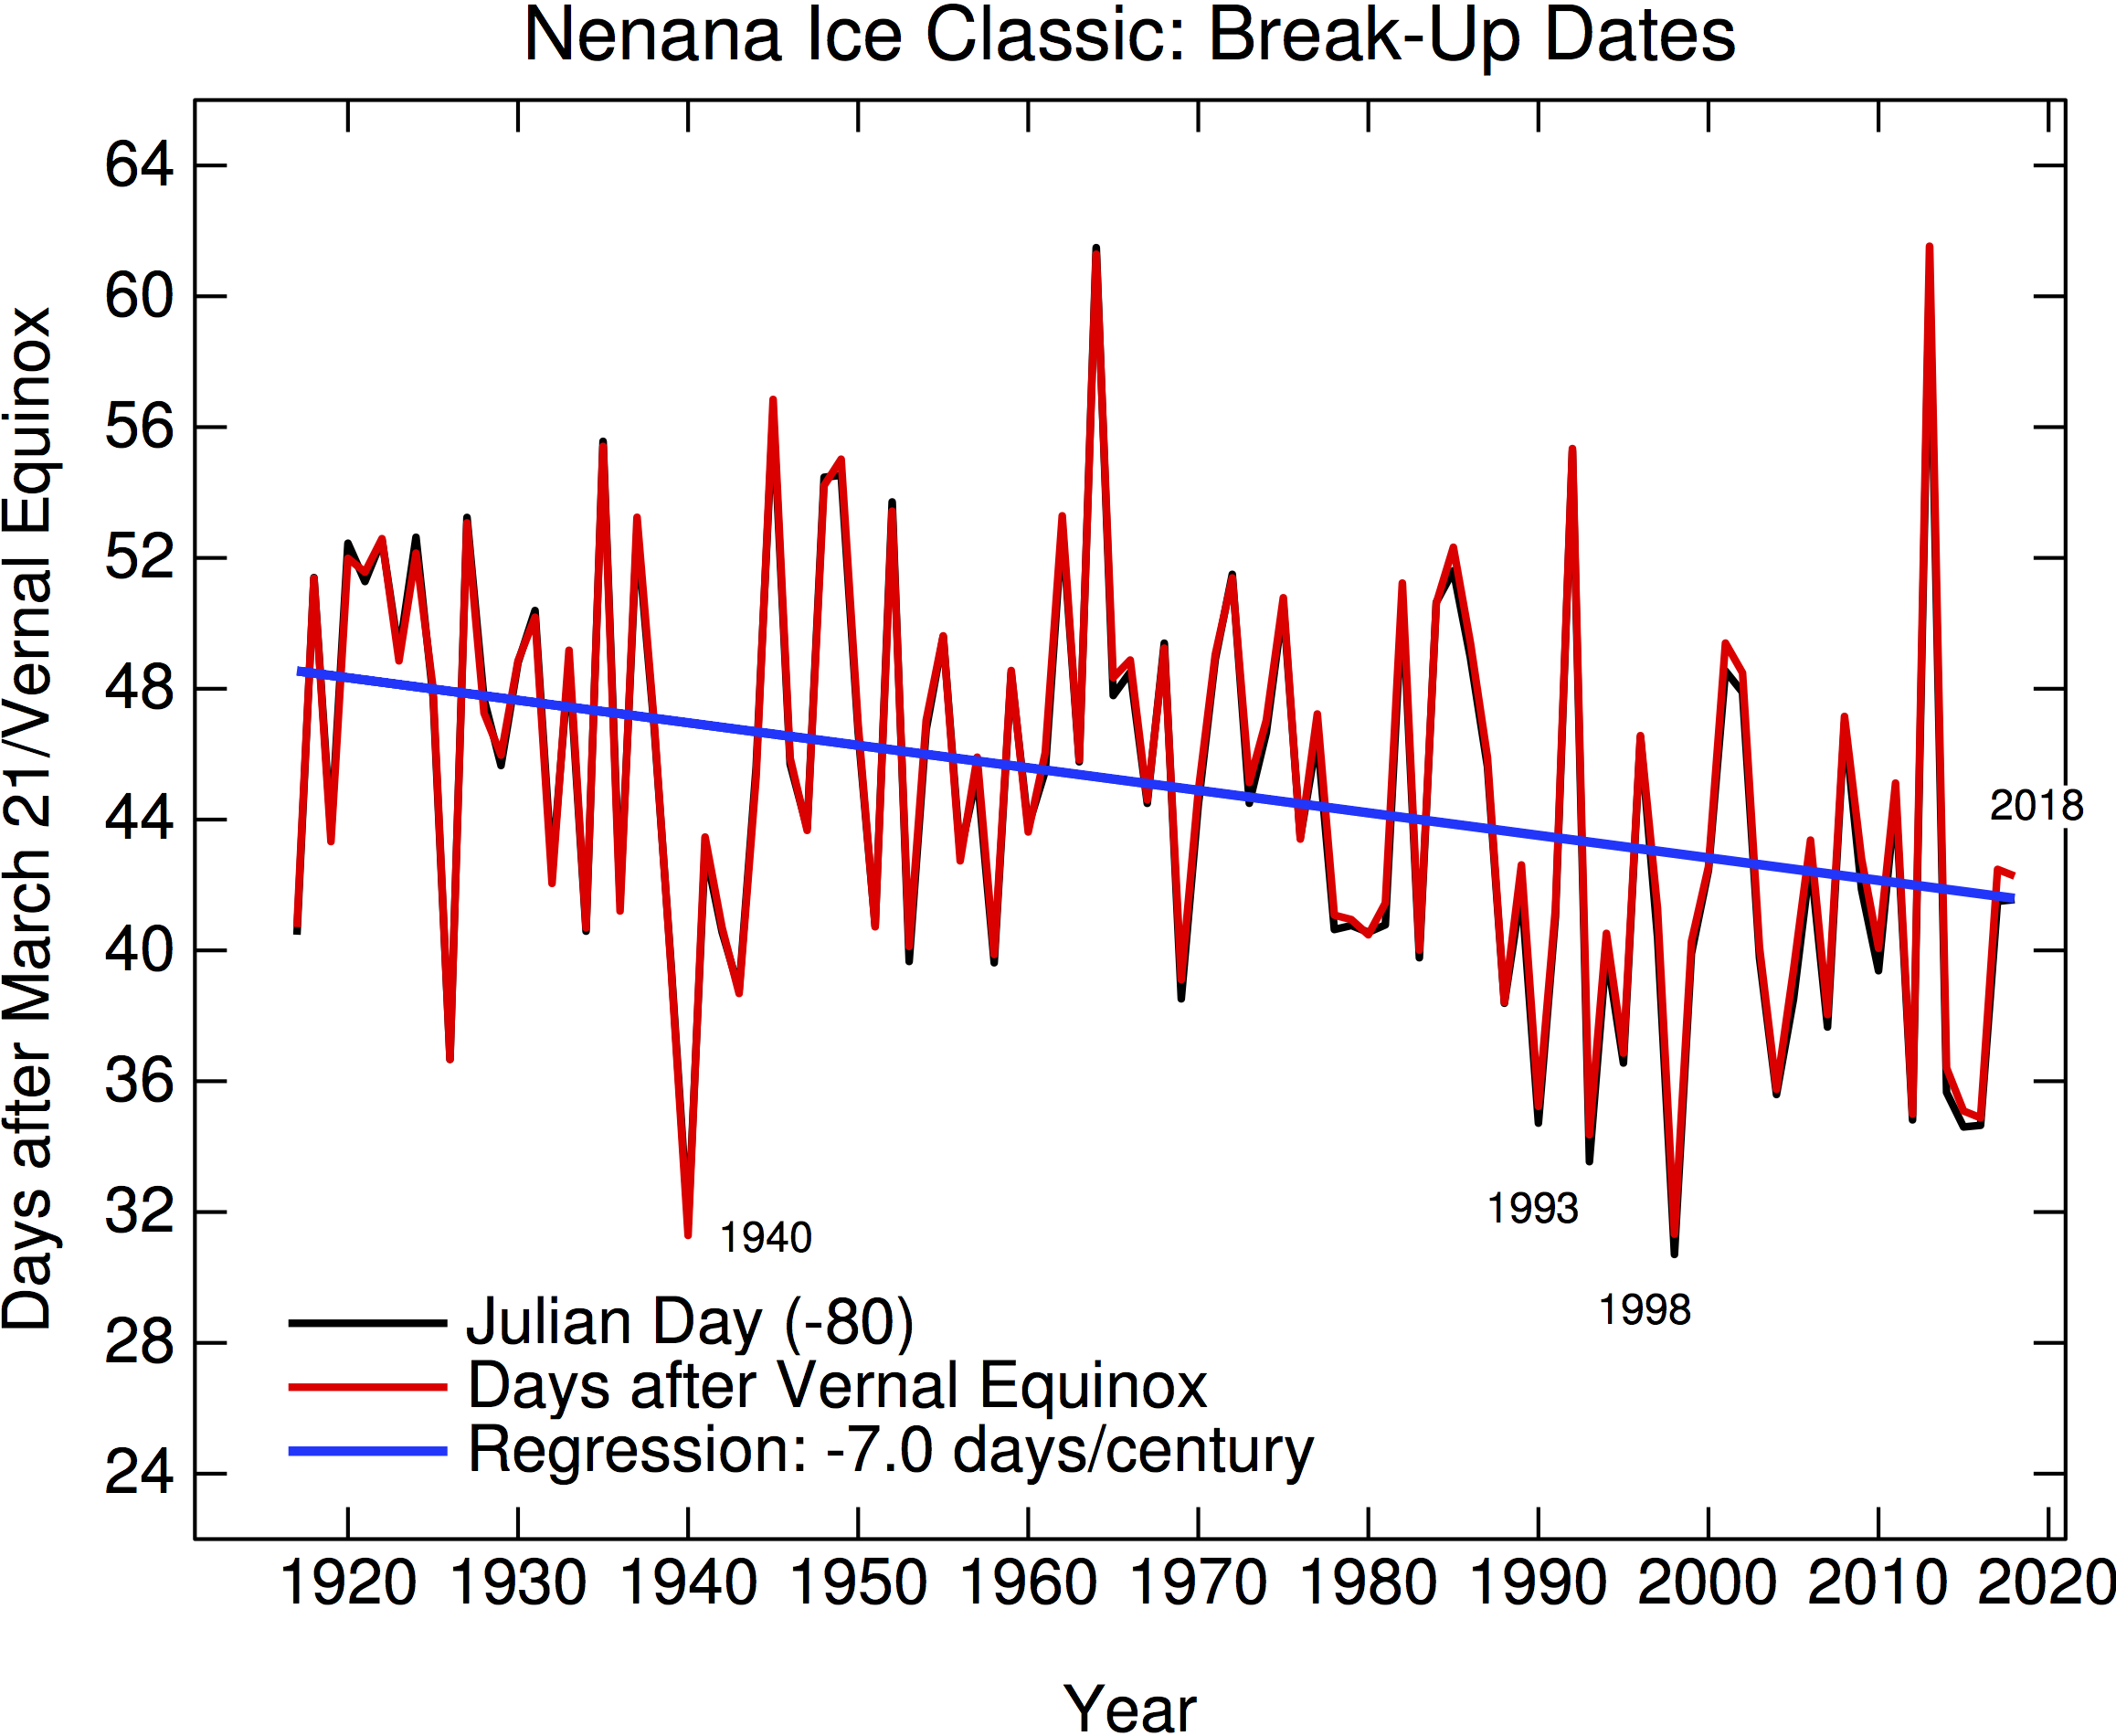
As I’ve done for a few years, here is the updated graph for the Nenana Ice Classic competition, which tracks the break up of ice on the Tanana River near Nenana in Alaska. It is now a 101-year time series tracking the winter/spring conditions in that part of Alaska, and shows clearly the long term trend towards earlier break up, and overall warming.

2017 was almost exactly on trend – roughly one week earlier than the average break up date a century ago. There was a short NPR piece on the significance again this week, but most of the commentary from last year and earlier is of course still valid.

My shadow bet on whether any climate contrarian site will mention this dataset remains in play (none have since 2013 which was an record late year).

Filed Under: Climate impacts, Climate Science, Instrumental Record

Model projections and observations comparison page

11 Apr 2017 by Gavin

We should have done this ages ago, but better late than never!

We have set up a permanent page to host all of the model projection-observation comparisons that we have monitored over the years. This includes comparisons to early predictions for global mean surface temperature from the 1980’s as well as more complete projections from the CMIP3 and CMIP5. The aim is to maintain this annually, or more often if new datasets or versions become relevant.

We are also happy to get advice on stylistic choices or variations that might make the graphs easier to comprehend or be more accurate – feel free to suggest them in the comments below (since the page itself will be updated over time, it doesn’t have comments associated with it).

If there are additional comparisons you are aware of that you think would be useful to include, please point to the model and observational data set(s) and we’ll try and include that too. We should have the Arctic sea ice trends up shortly for instance.

Filed Under: Climate modelling, Climate Science, Instrumental Record

What is the uncertainty in the Earth’s temperature rise?

11 Apr 2017 by group

Guest commentary by Shaun Lovejoy (McGill University)

Below I summarize the key points of a new Climate Dynamics (CD) paper that I think opens up new perspectives on understanding and estimating the relevant uncertainties. The main message is that the primary sources of error and bias are not those that have been the subject of the most attention – they are not human in origin. The community seems to have done such a good job of handling the “heat island”, “cold park”, and diverse human induced glitches that in the end these make only a minor contribution to the final uncertainty. The reason of course, is the huge amount of averaging that is done to obtain global temperature estimates, this averaging essentially averages out most of the human induced noise.

Two tough sources of uncertainty remain: missing data and a poor definition of the space-time resolution; the latter leads to the key scale reduction factor. In spite of these large low frequency uncertainties, at centennial scales, they are still only about 13% of the IPCC estimated anthropogenic increase (with 90% certainty).

This paper is based on 6 monthly globally averaged temperature series over the common period 1880-2012 using data that were publically available in May 2015. These were NOAA NCEI, NASA GISTEMP, HadCRUT4, Cowtan and Way, Berkeley Earth and the 20th Century Reanalysis. In the first part on relative uncertainties, the series are systematically compared with each other over scales ranging from months to 133 years. In the second part on absolute uncertainties, a stochastic model is developed with two parts. The first simulates the true temperatures, the second treats the measurement errors that would arise from this series from three different sources of uncertainty: i) usual auto-regressive (AR)-type short range errors, ii) missing data, iii) the “scale reduction factor”.

The model parameters are fit by treating each of the six series as a stochastic realization of the stochastic measurement process. This yields an estimate of the uncertainty (spread) of the means of each series about the true temperature – an absolute uncertainty – not simply the spread of the series means about their common mean value (the relative uncertainty). This represents the absolute uncertainty of the series means about a (still unknown) absolute reference point (which is another problem for another post).

[Read more…] about What is the uncertainty in the Earth’s temperature rise?

References

  1. S. Lovejoy, "How accurately do we know the temperature of the surface of the earth?", Climate Dynamics, vol. 49, pp. 4089-4106, 2017. http://dx.doi.org/10.1007/s00382-017-3561-9

Filed Under: Climate Science, Instrumental Record

Serving up a NOAA-thing burger

9 Feb 2017 by Gavin

I have mostly been sitting back and watching the John Bates story go through the predictable news-cycle of almost all supposed ‘scandalous’ science stories. The patterns are very familiar – an initial claim of imperfection spiced up with insinuations of misconduct, coordination with a breathless hyping of the initial claim with ridiculous supposed implications, some sensible responses refuting the initial specific claims and demolishing the wilder extrapolations. Unable to defend the nonsense clarifications are made that the initial claim wasn’t about misconduct but merely about ‘process’ (for who can argue against better processes?). Meanwhile the misconduct and data falsification claims escape into the wild, get more exaggerated and lose all connection to any actual substance. For sure, the technical rebuttals to the specific claims compete with balance of evidence arguments and a little bit of playful trolling for the attention of anyone who actually cares about the details. None of which, unfortunately, despite being far more accurate, have the narrative power of the original meme.

The next stages are easy to predict as well – the issues of ‘process’ will be lost in the noise, the fake overreaction will dominate the wider conversation and become an alternative fact to be regurgitated in twitter threads and blog comments for years, the originators of the issue may or may not walk back the many mis-statements they and others made but will lose credibility in any case, mainstream scientists will just see it as hyper-partisan noise and ignore it, no papers will be redacted, no science will change, and the actual point (one presumes) of the ‘process’ complaint (to encourage better archiving practices) gets set back because it’s associated with such obvious nonsense.

This has played out many, many times before: The Yamal story had a very similar dynamic, and before that the ‘1934‘ story, etc. etc.

Assuming for the sake of politeness that sound and fury signifying nothing is not the main goal for at least some participants, the question arises: since this is so predictable why do people still keep making the same mistakes?

[Read more…] about Serving up a NOAA-thing burger

Filed Under: Climate Science, Instrumental Record, Scientific practice

There was no pause

22 Jan 2017 by rasmus

I think that the idea of a pause in the global warming has been a red herring ever since it was suggested, and we have commented on this several times here on RC: On how data gaps in some regions (eg. the Arctic) may explain an underestimation of the recent warming. We have also explained how natural oscillations may give the impression of a faux pause. Now, when we know the the global mean temperature for 2016, it’s even more obvious.

Easterling and Wehner (2009) explained that it is not surprising to see some brief periods with an apparent decrease in a temperature record that increases in jumps and spurts, and Foster and Rahmstorf (2012) showed in a later paper how temperature data from the most important observations show consistent global warming trends when known short-term influences such as El Niño Southern oscillation (ENSO), volcanic aerosols and solar variability are accounted for.

A recent paper by Hausfather et al. (2017) adds little new to our understanding, although it confirms that there has not been a recent “hiatus” in the global warming. However, if there are doubts about a physical condition, then further scientific research is our best option for establishing the facts. This is exactly what this recent study did.

The latest findings confirm the results of Karl et al. 2015 from the National Oceanic Atmospheric Administration (NOAA), which Gavin described in a previous post here on RC. The NOAA analysis received unusual attention because of the harassment it drew from the chair of the US House Science Committee and the subpoena demand for emails.

[Read more…] about There was no pause

References

  1. D.R. Easterling, and M.F. Wehner, "Is the climate warming or cooling?", Geophysical Research Letters, vol. 36, 2009. http://dx.doi.org/10.1029/2009GL037810
  2. G. Foster, and S. Rahmstorf, "Global temperature evolution 1979–2010", Environmental Research Letters, vol. 6, pp. 044022, 2011. http://dx.doi.org/10.1088/1748-9326/6/4/044022
  3. Z. Hausfather, K. Cowtan, D.C. Clarke, P. Jacobs, M. Richardson, and R. Rohde, "Assessing recent warming using instrumentally homogeneous sea surface temperature records", Science Advances, vol. 3, 2017. http://dx.doi.org/10.1126/sciadv.1601207
  4. T.R. Karl, A. Arguez, B. Huang, J.H. Lawrimore, J.R. McMahon, M.J. Menne, T.C. Peterson, R.S. Vose, and H. Zhang, "Possible artifacts of data biases in the recent global surface warming hiatus", Science, vol. 348, pp. 1469-1472, 2015. http://dx.doi.org/10.1126/science.aaa5632

Filed Under: Climate Science, Instrumental Record, Oceans, RC Forum

2016 Temperature Records

19 Jan 2017 by Gavin

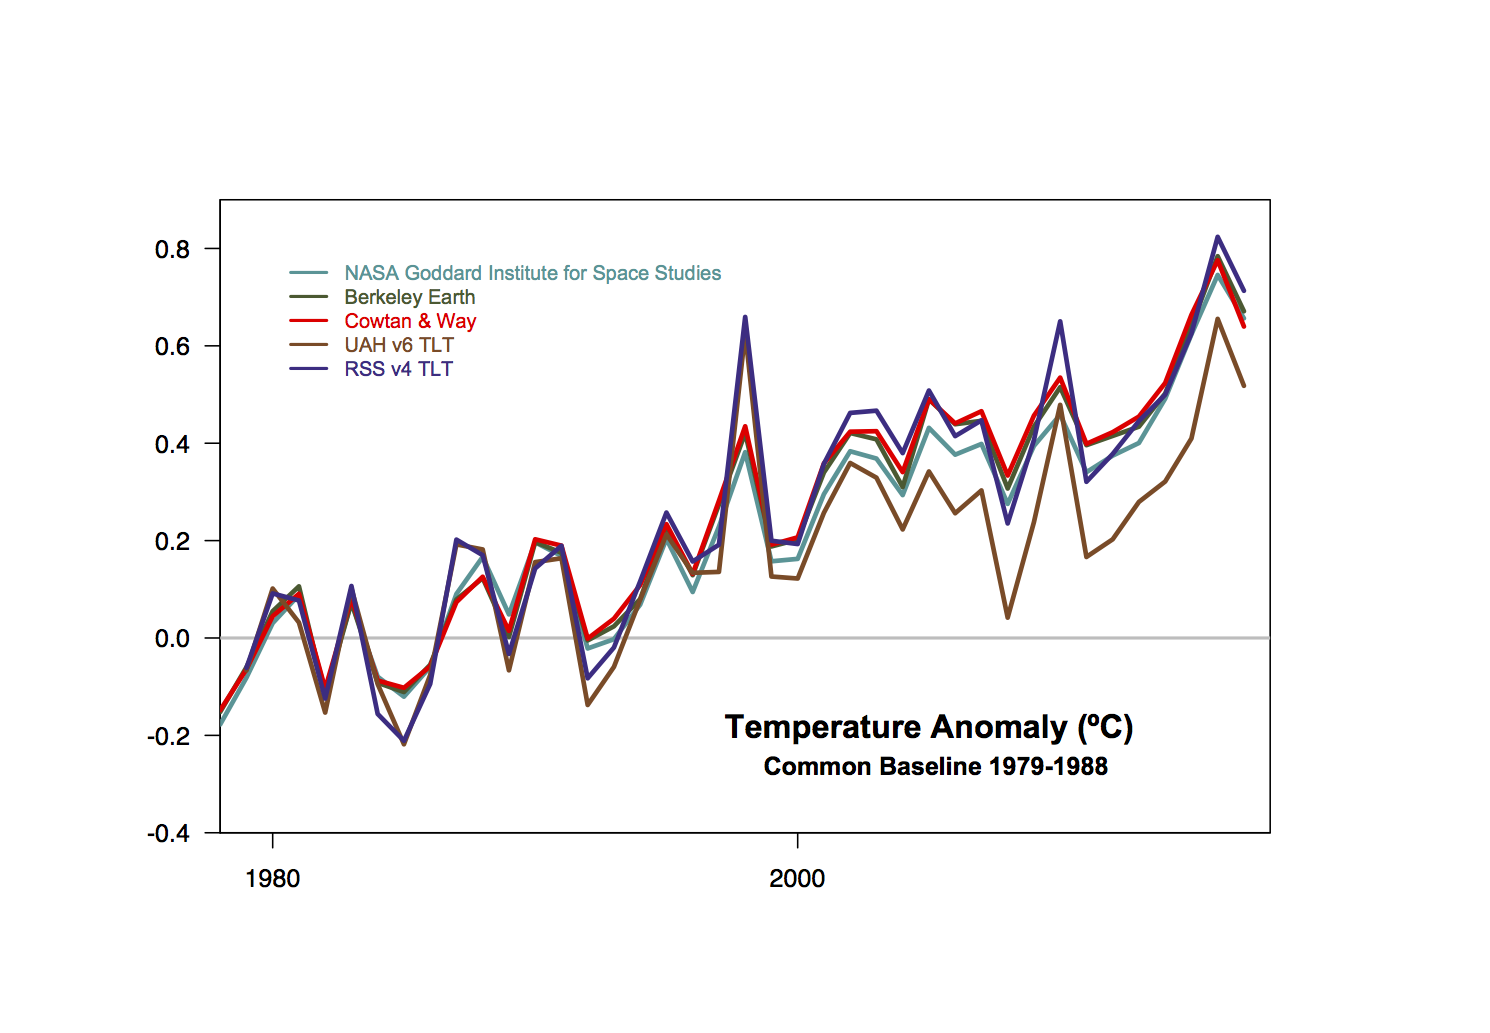
To nobody’s surprise, all of the surface datasets showed 2016 to be the warmest year on record.


Barely more surprising is that all of the tropospheric satellite datasets and radiosonde data also have 2016 as the warmest year.


Coming as this does after the record warm 2015, and (slightly less definitively) record warm 2014, the three records in row might get you to sit up and pay attention.

[Read more…] about 2016 Temperature Records

Filed Under: Climate Science, Instrumental Record

The NASA data conspiracy theory and the cold sun

16 Jan 2017 by Stefan

When climate deniers are desperate because the measurements don’t fit their claims, some of them take the final straw: they try to deny and discredit the data.

The years 2014 and 2015 reached new records in the global temperature, and 2016 has done so again. Some don’t like this because it doesn’t fit their political message, so they try to spread doubt about the observational records of global surface temperatures. A favorite target are the adjustments that occur as these observational records are gradually being vetted and improved by adding new data and eliminating artifacts that arise e.g. from changing measurement practices or the urban heat island effect. More about this is explained in this blog article by Victor Venema from Bonn University, a leading expert on homogenization of climate data. And of course the new paper by Hausfather et al, that made quite a bit of news recently, documents how meticulously scientists work to eliminate bias in sea surface temperature data, in this case arising from a changing proportion of ship versus buoy observations. [Read more…] about The NASA data conspiracy theory and the cold sun

Filed Under: Climate Science, Instrumental Record, Scientific practice, skeptics, Sun-earth connections

Climatology and meteorology are your friends

19 Dec 2016 by rasmus

The Norwegian Meteorological institute has celebrated its 150th anniversary this year. It was founded to provide weather data and tentative warnings to farmers, sailors, and fishermen. The inception of Norwegian climatology in the mid-1800s started with studies of geographical climatic variations to adapt important infrastructure to the ambient climate. The purpose of the meteorology and climatology was to protect lives and properties.

[Read more…] about Climatology and meteorology are your friends

Filed Under: Climate Science, Communicating Climate, Instrumental Record, RC Forum, Reporting on climate

  • « Go to Previous Page
  • Page 1
  • Interim pages omitted …
  • Page 7
  • Page 8
  • Page 9
  • Page 10
  • Page 11
  • Interim pages omitted …
  • Page 24
  • Go to Next Page »

Primary Sidebar

Search

Search for:

Email Notification

get new posts sent to you automatically (free)
Loading

Recent Posts

  • The most recent climate status
  • Unforced variations: May 2025
  • Unforced Variations: Apr 2025
  • WMO: Update on 2023/4 Anomalies
  • Andean glaciers have shrunk more than ever before in the entire Holocene
  • Climate change in Africa

Our Books

Book covers
This list of books since 2005 (in reverse chronological order) that we have been involved in, accompanied by the publisher’s official description, and some comments of independent reviewers of the work.
All Books >>

Recent Comments

  • Piotr on Unforced variations: May 2025
  • William on The most recent climate status
  • Mr. Know It All on Unforced variations: May 2025
  • Piotr on The most recent climate status
  • Nigelj on Unforced variations: May 2025
  • Kevin McKinney on Unforced variations: May 2025
  • Kevin McKinney on The most recent climate status
  • Kevin McKinney on The most recent climate status
  • Kevin McKinney on The most recent climate status
  • Mr. Know It All on The most recent climate status
  • K on Unforced variations: May 2025
  • Tomáš Kalisz on Unforced variations: May 2025
  • Tomáš Kalisz on Unforced variations: May 2025
  • Piotr on Unforced variations: May 2025
  • Piotr on Unforced variations: May 2025
  • Susan Anderson on Unforced variations: May 2025
  • Ken Towe on The most recent climate status
  • Keith Woollard on The most recent climate status
  • Dan on Unforced variations: May 2025
  • Nigelj on The most recent climate status

Footer

ABOUT

  • About
  • Translations
  • Privacy Policy
  • Contact Page
  • Login

DATA AND GRAPHICS

  • Data Sources
  • Model-Observation Comparisons
  • Surface temperature graphics
  • Miscellaneous Climate Graphics

INDEX

  • Acronym index
  • Index
  • Archives
  • Contributors

Realclimate Stats

1,365 posts

11 pages

243,185 comments

Copyright © 2025 · RealClimate is a commentary site on climate science by working climate scientists for the interested public and journalists.